
- Polkadot has faced strong resistance at $4.27, but the RSI shows a breakout is now possible.
- The price has also touched the 50-day SMA, indicating that the short-term trend is flipping bullish.
Polkadot [DOT] traded at $4.25 at press time after a nearly 2% gain in 24 hours. The altcoin has faced strong resistance above its current price, with every breakout attempt failing due to a lack of buyer support.
However, interest in Polkadot is now building up. CoinMarketCap shows that in the last 24 hours, DOT’s trading volumes have increased by more than 20%.
Besides these rising volumes, several indicators suggest that the trend could be reversing.
Key reasons why DOT can overcome resistance
Bulls are getting ready to support DOT’s breakout above the $4.27 resistance level. This price has acted as a strong resistance for nearly two weeks, showing a lack of interest by buyers.
The Relative Strength Index (RSI) shows that the momentum is shifting. The RSI stood at 50, indicating that the market sentiment has shifted from negative to neutral.
The rising RSI also crossed above the signal line, suggesting that a bullish trend is underway.
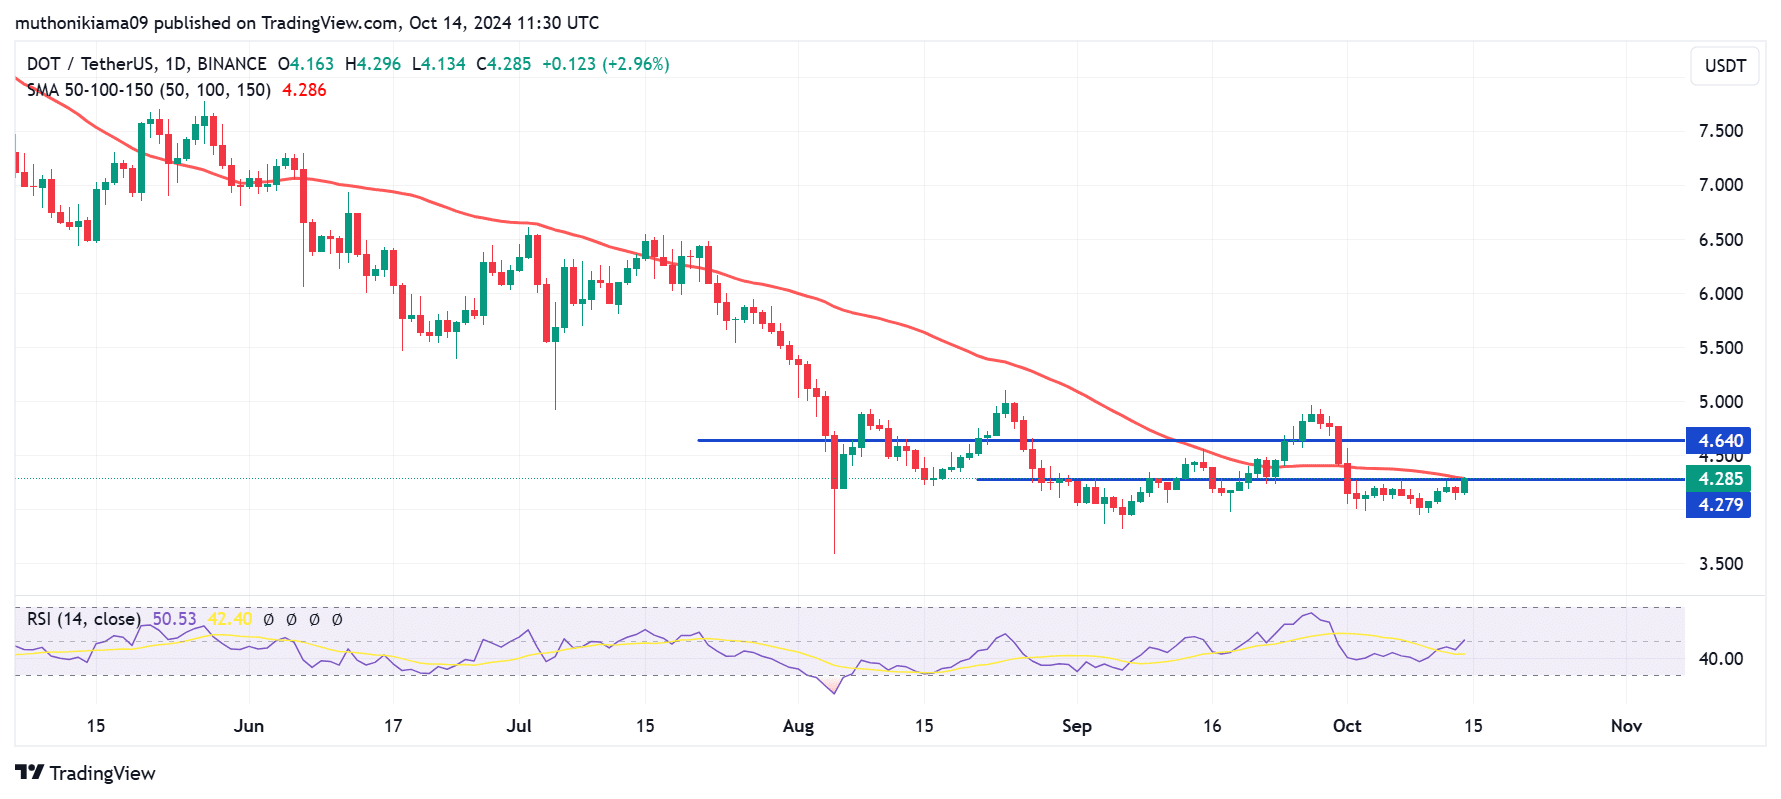
Source: TradingView
DOT has also touched the 50-day Simple Moving Average (SMA) at $4.28. If the price shifts above this level, it will flip the short-term sentiment to bullish, with the price poised to rally to test the next resistance at $4.64.
Analyzing derivatives data
A look at data from Coinglass shows that derivative traders are opening and maintaining their positions on DOT. Trading volumes have spiked by more than 60% while Open Interest has jumped by around 2% to $223 million.
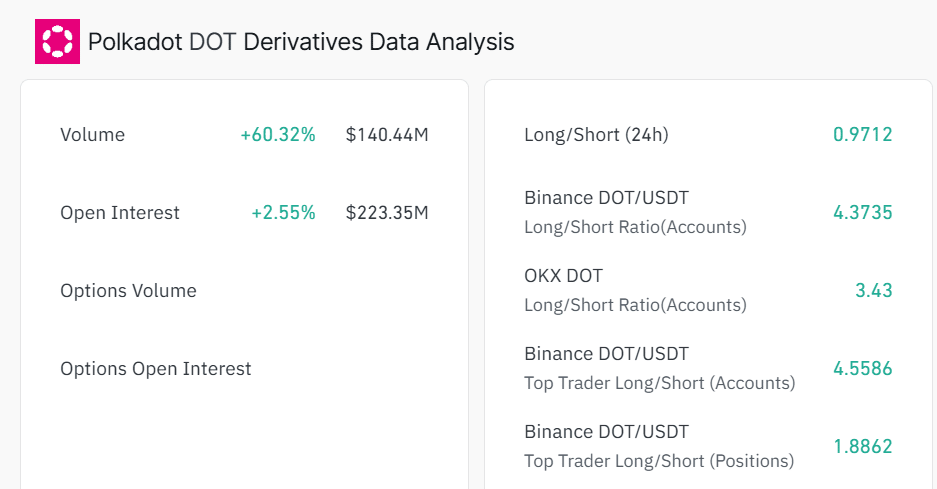
Source: Coinglass
The Long/Short Ratio was at a neutral level of 0.97, showing that the market is not heavily biased to either long traders or short traders.
However, on Binance, there seems to be a significantly higher number of long traders than short traders, with a Long/Short Ratio of 4.37.
Polkadot network activity
One of the factors that might be hindering Polkadot’s breakout above resistance is a drop in network activity.
According to Token Terminal, there has been a notable drop in the number of daily active addresses, showing declining usage.
Since the start of the month, daily active addresses have dropped from 5,200 to around 3,600. On the other hand, the daily transaction count has been relatively flat with no major changes.
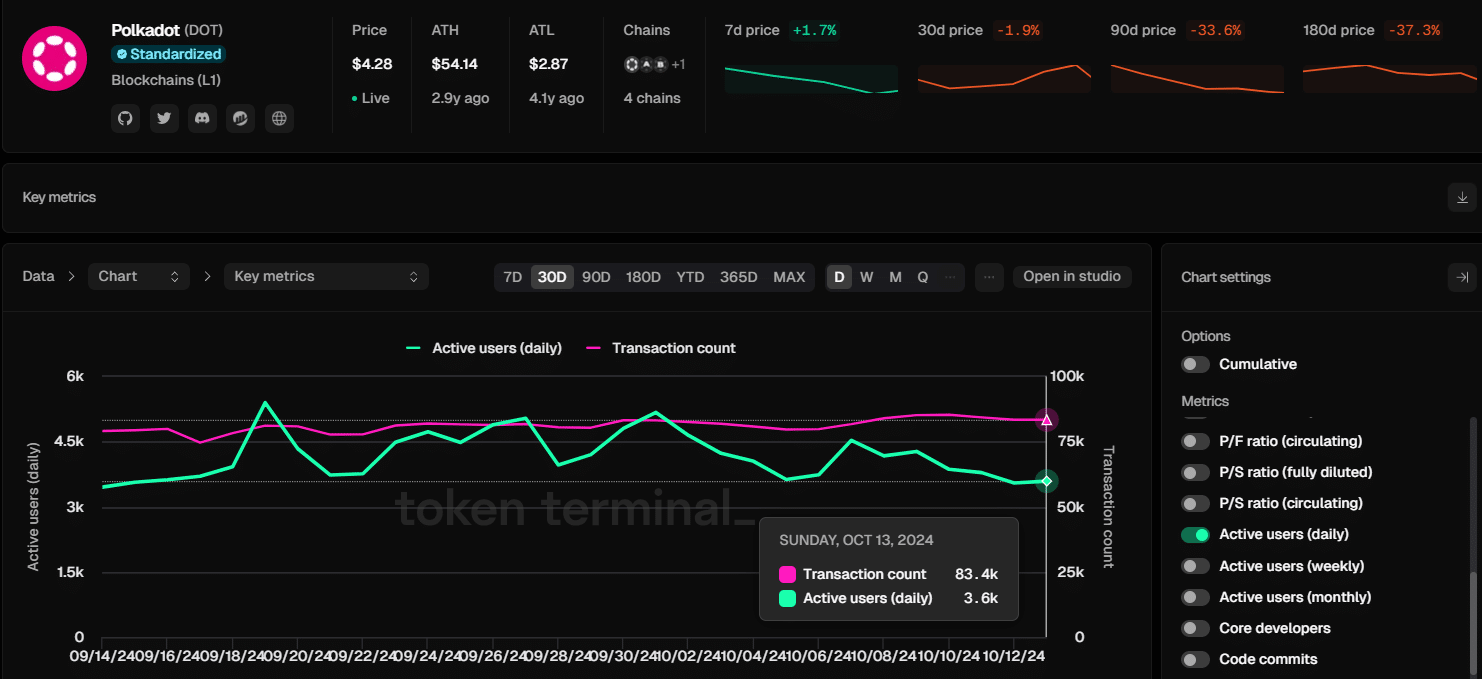
Source: Token Terminal
Read Polkadot’s [DOT] Price Prediction 2024–2025
Declining network usage tends to reduce demand for a token. It also points towards declining confidence in Polkadot, which further dampens the market sentiment.
Data from Market Prophit shows that the sentiment around Polkadot has been predominantly negative over the past month. If this sentiment does not change, DOT will likely continue facing a suppressed performance.