- Polkadot saw a strong revival over the past few weeks. Can the bulls continue to exert pressure?
- The altcoin’s derivates data revealed a slight bullish edge.
Polkadot [DOT] recent recovery has put the altcoin at an important juncture, at the confluence of the 20-day and 50-day EMAs as well as the crucial $6.5 resistance level.
For nearly three weeks, DOT saw higher troughs on its daily chart and bounced off its near-term trendline support. A potential close above or below this support level will likely inflict a volatile move in the coming weeks.
DOT traded at around $6.2 at the time of writing, up by around 0.5% over the past day.
Can DOT bulls inflict a rally?
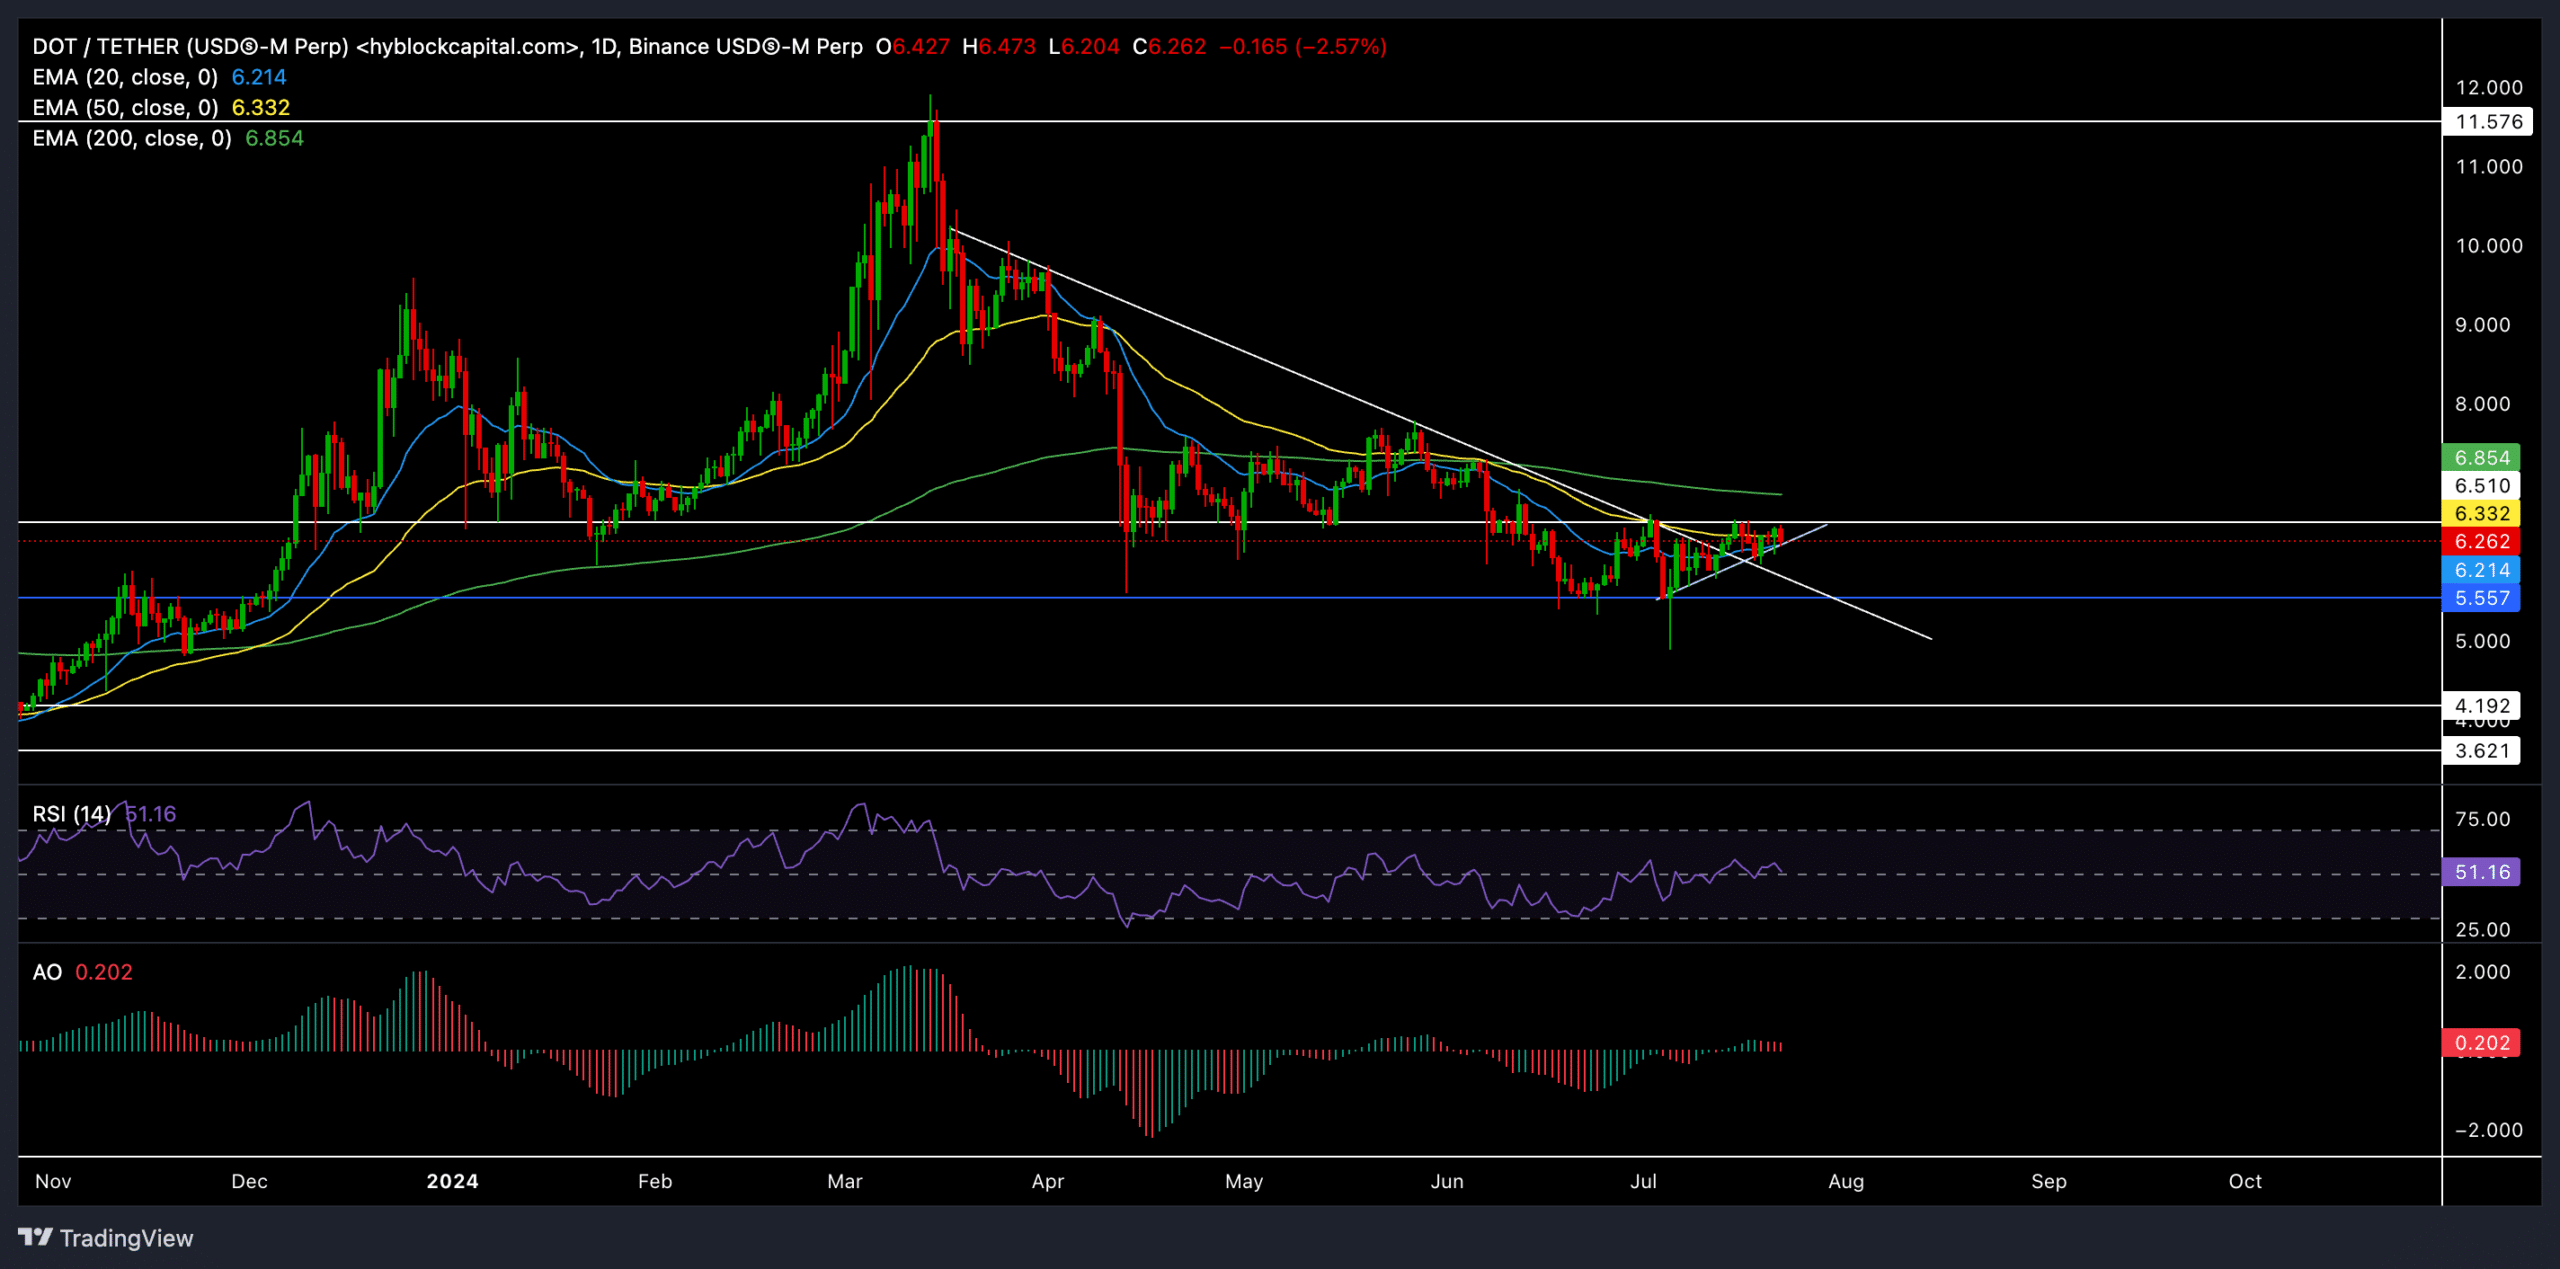
Source: TradingView, DOT/USDT
The reversal from the $11.5 resistance in March set the stage for the bears to provoke a streak of red candles. As a result, DOT lost nearly 45% of its value over the past three months after touching its two-year high in March.
DOT then found support near the $5.55 level, which the bears tested twice over the past month. It’s worth noting that the altcoin fell below its crucial 20, 50, and 200-day EMA levels amid this downturn.
However, the recent rebound from the $5.55 baseline has reignited some recovery hopes. DOT was up nearly 13% over the last three weeks. In the meantime, it also tested the $6.5 resistance multiple times and formed an ascending triangle-like structure.
Should the price close above the immediate resistance level at $6.5, this could provoke an immediate uptrend. The 200 EMA at $6.8 would be the first major resistance level in this case.
However, if the price falls below the 20 and 50-day EMA, it could delay the immediate recovery prospects. In this case, DOT would likely rebound from the $5.55 level to retest the $6.5 resistance.
The Relative Strength Index finally found a close above the 50-level and reaffirmed an ease in selling pressure. However, buyers should wait for a sustained close above this level to gauge the chances of an uptrend in the coming days.
Similarly, the Awesome Oscillator closed above its equilibrium but saw a few red lines on its histogram over the last few days.
Read Polkadot [DOT] Price Prediction 2024-2025
Here’s what the derivatives data revealed

Source: Coinglass
Coinglass data showed bullish sentiment among traders, especially on Binance and OKX. However, the overall market seems slightly more short-biased in the past 24 hours.
Traders are now positioning themselves for potential larger moves, with a slight preference for long positions. However, it’s crucial to consider Bitcoin and the overall market sentiment before making any trading decisions.