Polkadot roadmap: DOT at a crossroads, what’s the way ahead?
The rise in development activity and unique addresses on the Polkadot network in Q2 has played an important role in its ecosystem. However, DOT is yet to benefit from this.

- The rise in development activity and unique addresses in Q2 for Polkadot hasn’t translated into significant gains for DOT.
- However, bullish sentiment in the market could result in rapid gains for DOT in Q3.
Blockchain interoperability has been one of the hottest topics in the crypto industry with the advancement of blockchain technology raising the need for different blockchains to interact with each other seamlessly. Polkadot [DOT] is one of the leading projects rapidly advancing the development of blockchain interoperability.
Read Polkadot’s [DOT] Price Prediction 2023-24
The Polkadot blockchain provides an ecosystem of custom blockchains called “parachains.” Parachains are designed to host decentralized applications (dApps) and these parachains are deployed on Polkadot’s central hub called the Relay Chain.
Blockchain projects such as Centrifuge, Clover, and Moonbeam have used Polkadot’s interoperability to deliver scalable applications across parallel blockchains.
Polkadot’s native token, DOT, provides token holders with governance privileges and staking rewards. While the network privileges and staking rewards saw DOT have a bullish Q1 with gains of 86.19% taking it up to a year-high of $7.90, Q2 has seen a complete reversal of fortunes for DOT.
Languishing under a bearish market structure, DOT reversed all of its Q1 gains. Although the altcoin has been on a bullish rally since mid-June, it has failed to flip its market structure to bearish, as sellers continue to hold sway.
What can DOT traders and investors watch out for in the coming weeks?
Bullish rally severely limited by southward price movement
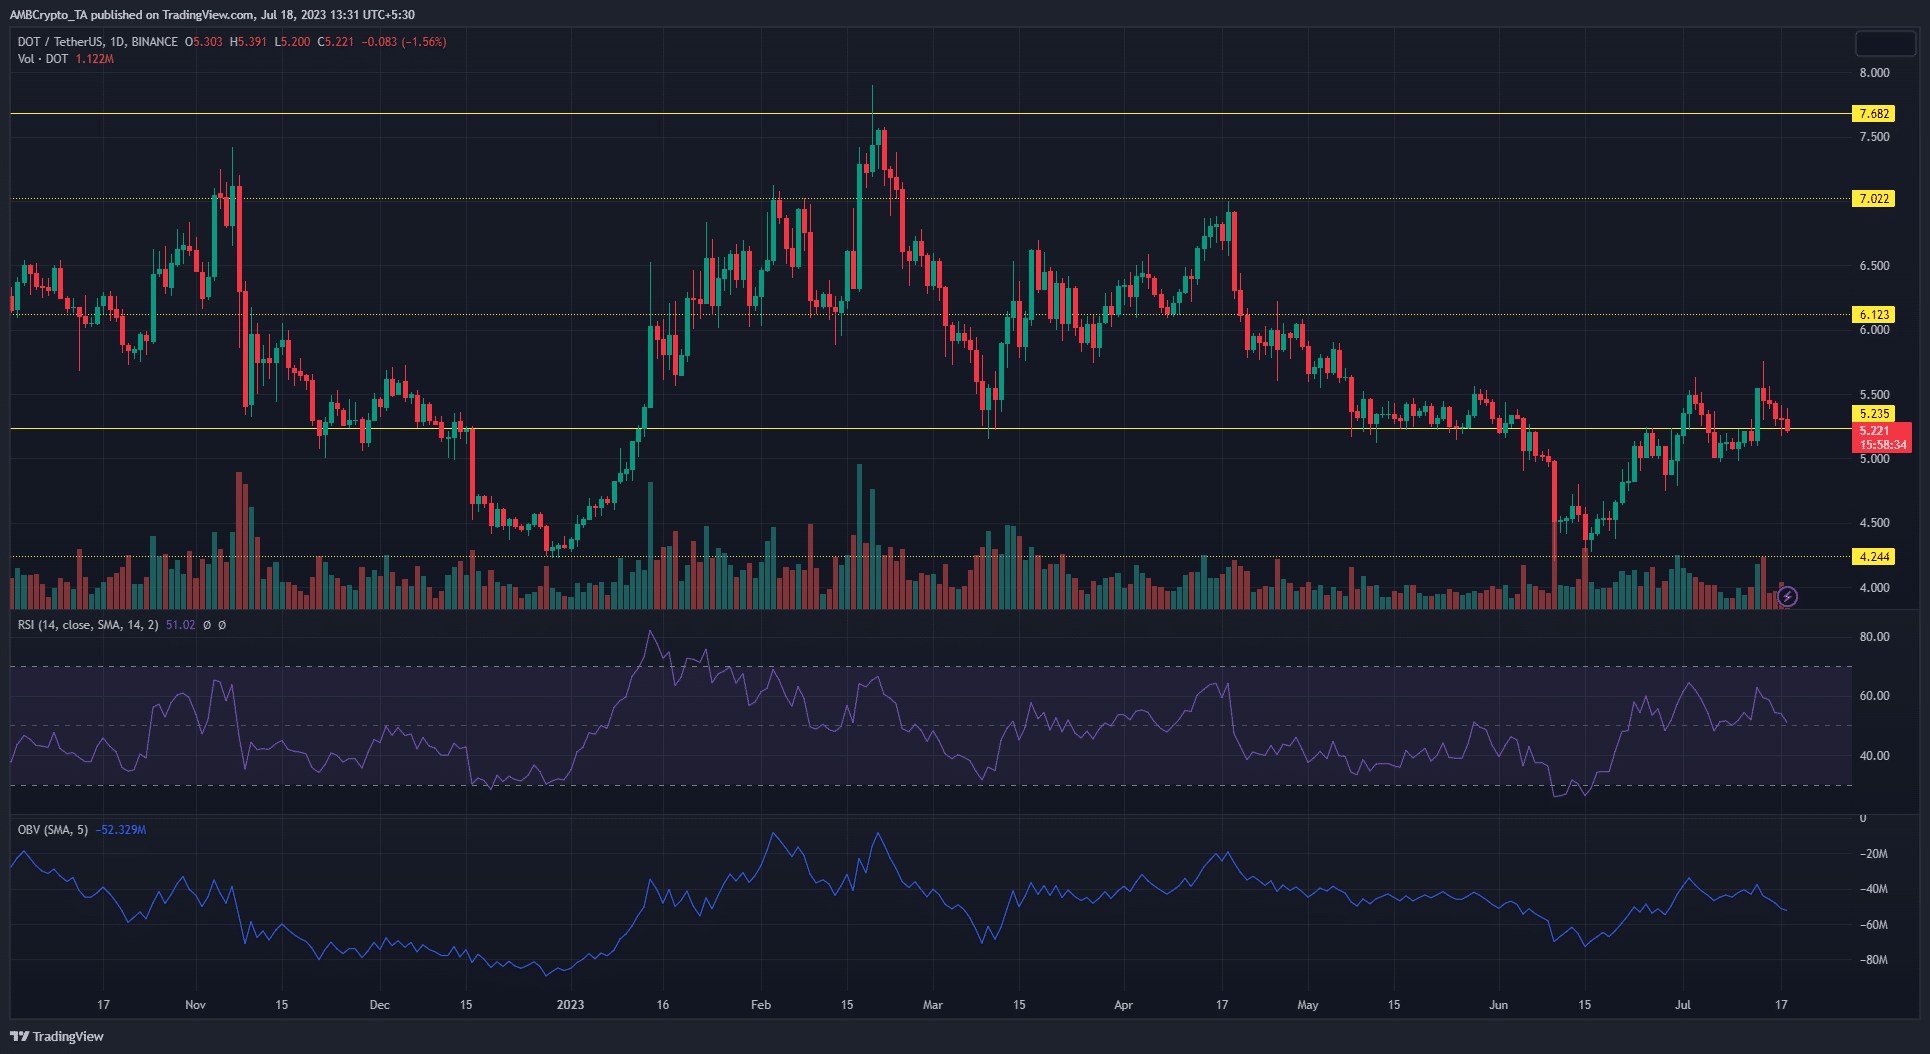
The daily price chart for DOT showed the token has been on a downtrend since mid-February. The market structure was firmly bearish with the last lower high at $7. This lower high was recorded on 18 April and DOT hasn’t been able to achieve any significant gains to break this key bearish level.
The dip to the December 2022 low of $4.24 on 16 June saw a positive reaction from the bulls. An ensuing 33.9% gain saw DOT reach $5.74 breaking the $5.23 resistance level and the most recent lower low. However, dipping volumes, as highlighted by the On Balance Volume (OBV) indicator, have limited any further gains with prices stuck around the key resistance level.
The Relative Strength Index (RSI) was below the neutral-50 between April and June, which suggested a long-term downtrend. However, the RSI climbed above the neutral-50 in July which suggested that momentum could be shifting.
This uptick in buying pressure could be linked to recent developments in the Polkadot development ecosystem. According to a blogpost by the Polkadot network,
“Polkadot was the top Web3 protocol measured by development activity through the quarter, just as it had been in Q1 – and there was another impressive rise in unique accounts, with almost four million across the ecosystem.”
While this was sufficient for a short-term rally, the long-term prospects for DOT still look dim. A break below the key support level of $5.23 could see an extension of DOT’s bearish structure. With declining volume and waning buying pressure, the longer-term bottom could be in for DOT.
On-chain metrics highlighted the significant lack of demand for DOT
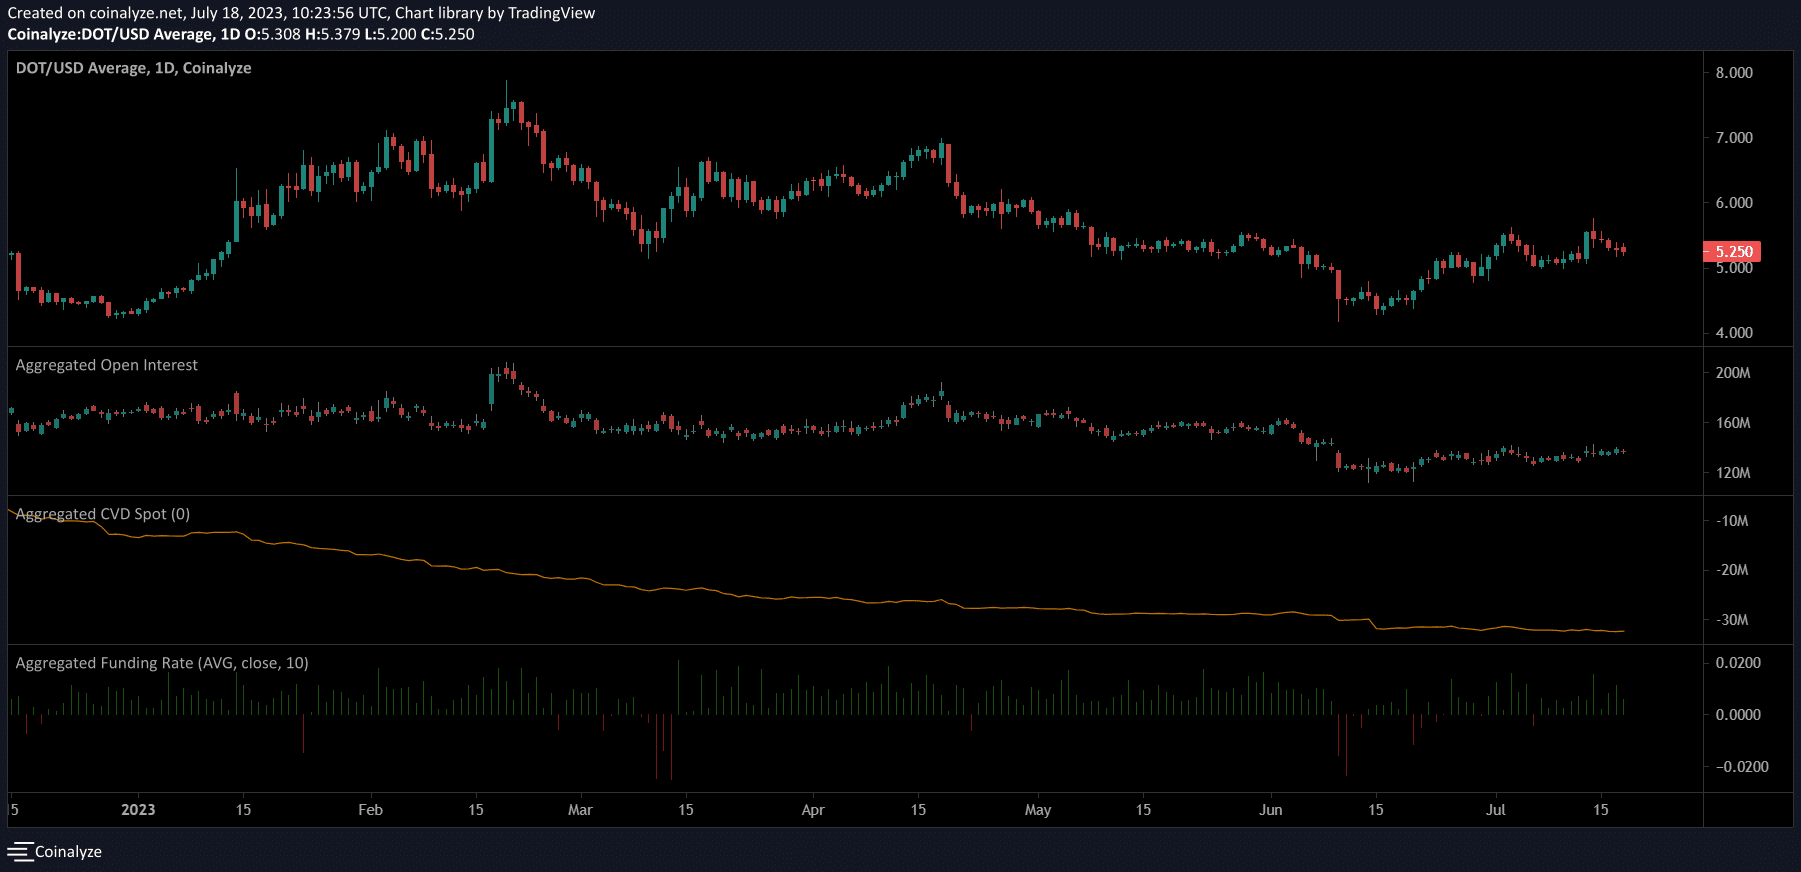
The bearish outlook on the charts carried over into the futures market, per data from Coinalyze. Open Interest has been on a decline since mid-April. The OI dropped by over $50 million between mid-April and July, with another significant drop on 10 June. The recent rally had little effect on the OI, with speculators continuing to reduce their exposure to DOT.
Similarly, Spot CVD remained in steep decline, highlighting the lack of demand for DOT. However, one metric that could encourage bulls is the Funding Rate, which has stayed positive since early July.
What does the near future hold for DOT?
With the market experiencing a bullish revival in recent weeks, DOT buyers are confident that a price reversal is a possibility. However, there are major hurdles that need to be crossed for this to happen.
How much are 1,10,100 DOTs worth today?
Sustaining the buying levels above the $5.23 support will be critical for a reversal. A bullish Bitcoin [BTC] could spur buyers in this regard. If the critical resistance level at $6.12 is flipped, bulls can firmly target $7 which would flip DOT bullish for the long term.
On the flip side, failure to defend the $5.23 support could see DOT sink to another year-low, especially if there is a significant market correction. Overall, DOT’s price movement hangs in the balance with the scale slightly tipped in the favor of bears.