Altcoin
Polkadot shadows Ethereum as DOT faces challenges
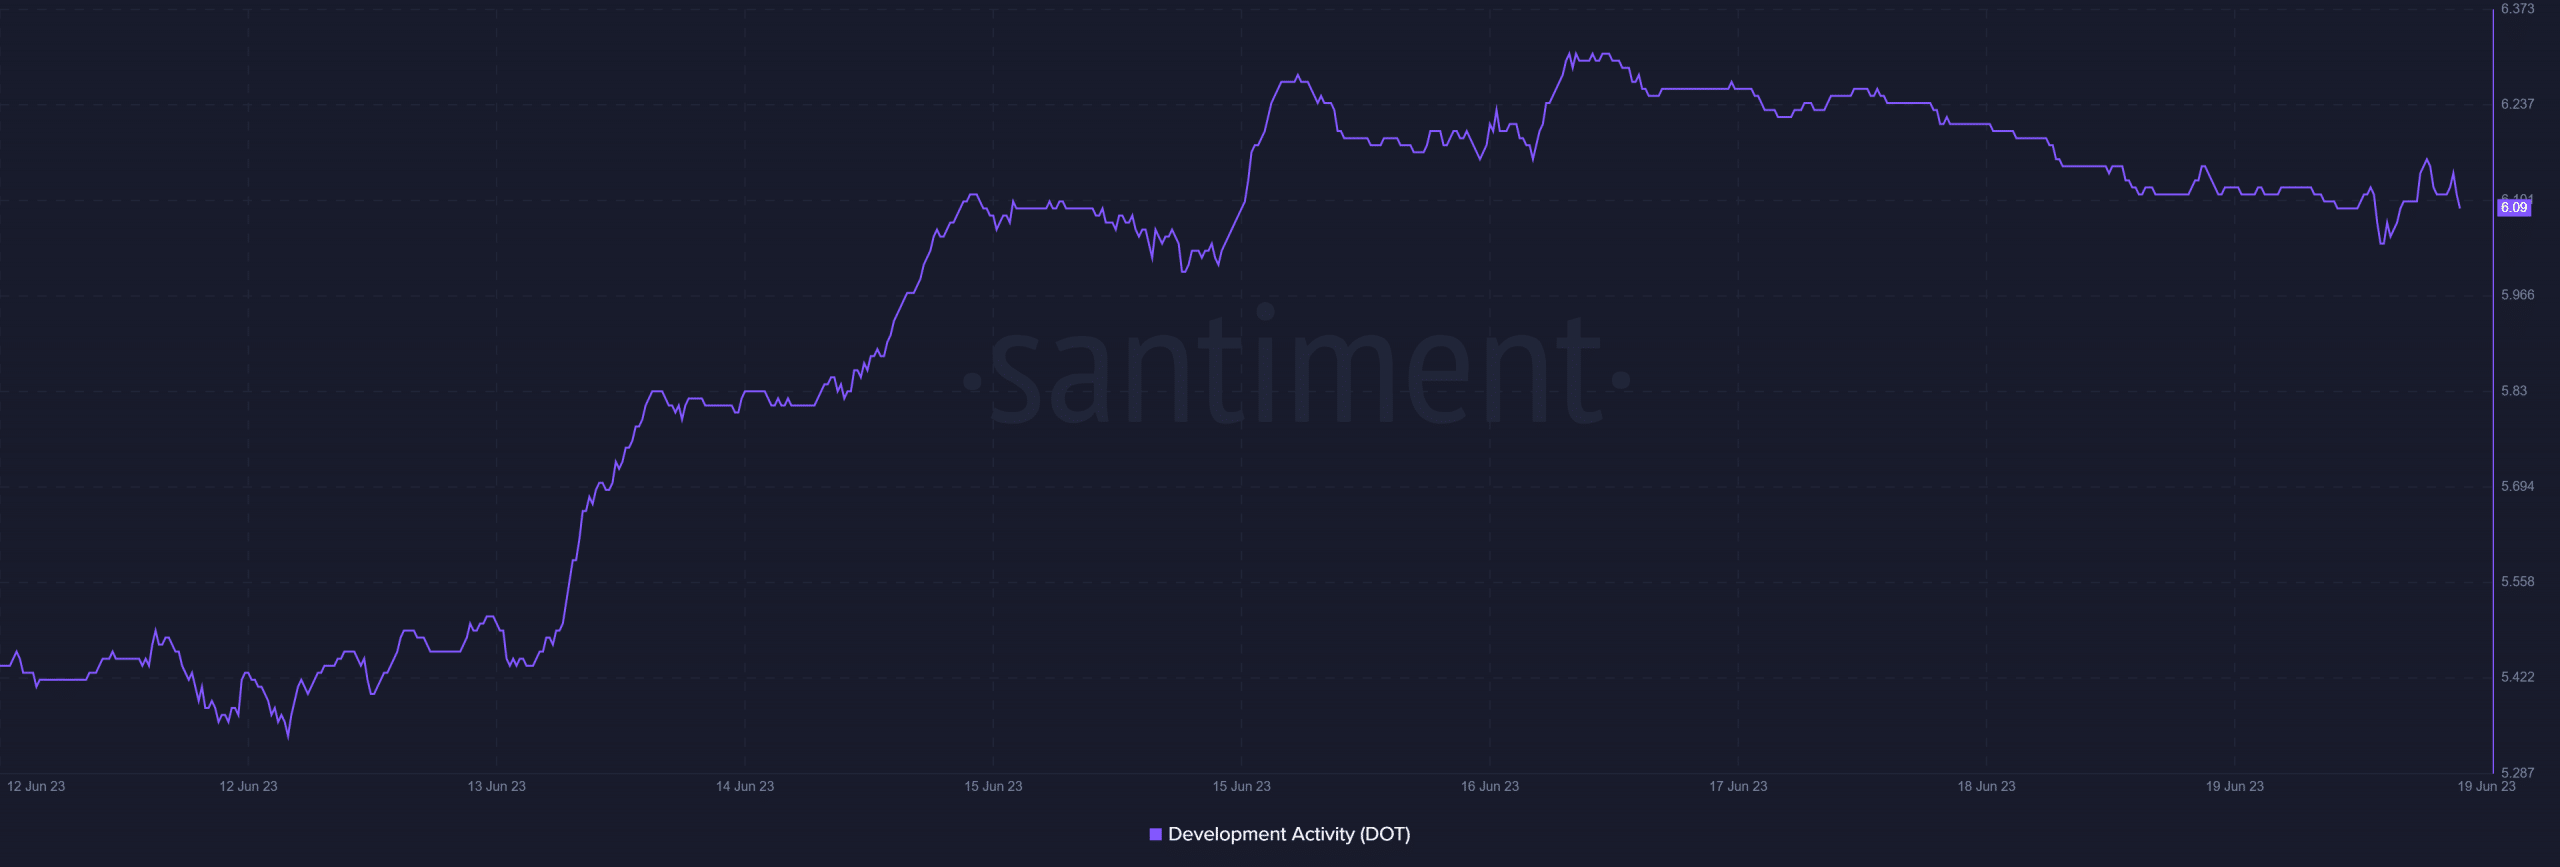
Santiment’s chart revealed that Polkadot’s development activity increased considerably over the last seven days, but DOT’s price has declined.

- Polkadot’s Open Interest declined, suggesting a trend reversal.
- DOT’s market indicators looked fairly bullish.
Polkadot [DOT], which is known for its high development activity, has maintained its leading streak yet again. Notably, Polkadot’s network activity has also remained on the higher side of late. However, these achievements were not reflected on DOT’s chart, as its 24-hour chart was in the red.
Is your portfolio green? Check out the Polkadot Profit Calculator
Polkadot development activity is on par
Polkadot Insider, in an 18 June tweet, revealed that the network was only behind Ethereum [ETH] in terms of weekly code commits.
This is the metric for the number of commits to the project's public #GitHub repositories in the past 7 days
Top 3 include:
? @ethereum: 11,518
? @Polkadot: 8,854
? @solana: 3,402Source: @Artemis__xyz #Polkadot #DOT #CodeCommits pic.twitter.com/iI8MUAkpel
— Polkadot Insider (@PolkadotInsider) June 18, 2023
Apart from Polkadot and Ethereum, Solana [SOL], Cosmos [ATOM], and Near Protocol [NEAR] completed the top 5 of the list. DOT’s high development was also seen on Santiment’s chart as the blockchain’s development activity increased sharply over the last week.
A closer look at Polkadot’s stats
Polkadot’s network value remained pretty stable over the last few weeks, as evident from DeFiLlama’s chart. The blockchain’s TVL, after witnessing a sudden downfall on 16 June, was quick to recover. At the time of writing, Polkadot’s TVL stood at $85,492.
However, Polkadot’s staking ecosystem did witness a downfall of late. As per Staking Reward, DOT’s total number of stakers spiked on 17 June, but later, the graph plummeted. At press time, Polkadot had a staking ratio of over 42% and a staking market cap of $2,564,367,871.
DOT is slow to move
The aforementioned positive development was not reflected in DOT’s price chart, which registered a decline. According to CoinMarketCap, DOT’s price has declined by 2% in the last 24 hours, trading at $4.53 with a market capitalization of over $5.4 billion.
However, the negative price action might soon end, as Coinglass’ data revealed that DOT’s Open Interest had declined at the time of writing.
Read Polkadot’s [DOT] Price Prediction 2023-24
Is a trend reversal possible?
Historically, prices of cryptos move the other way around when funding rates decline. As per Santiment, DOT’s Binance funding rate was red. Additionally, DOT’s popularity also increased last week, as evident from its social volume.
Polkadot’s MACD displayed the possibility of a bullish crossover. Besides that, DOT’s Money Flow Index (MFI) also registered an uptick. Nonetheless, its Chaikin Money Flow (CMF) was not entirely bullish as it took a sideways path.


