Polkadot shows signs of recovery: Could $4.25 be the next target?

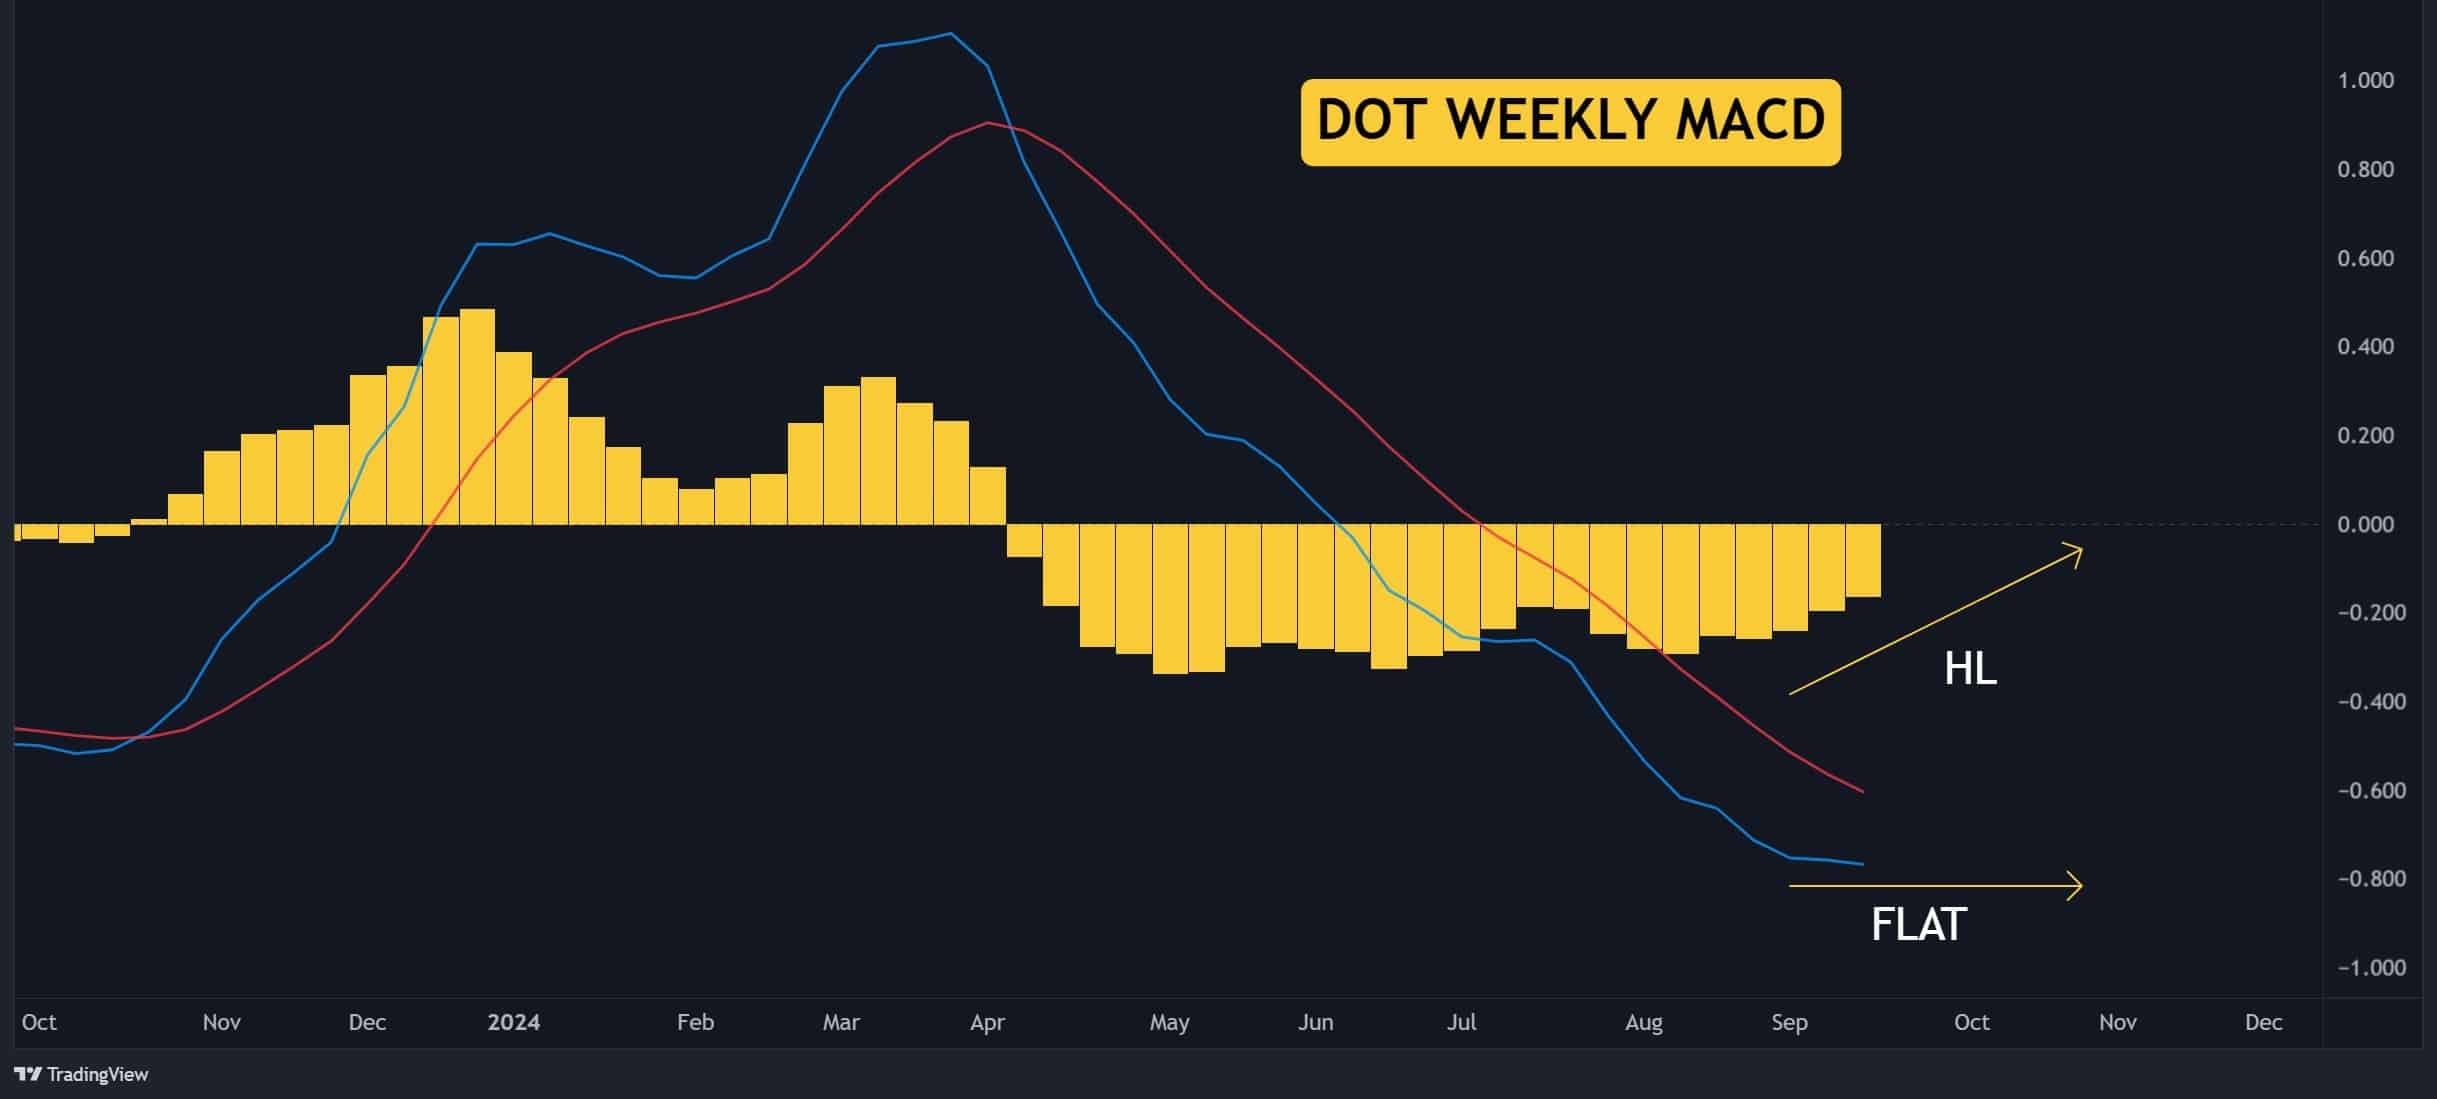
- MACD shows higher lows as moving averages flatten for Polkadot.
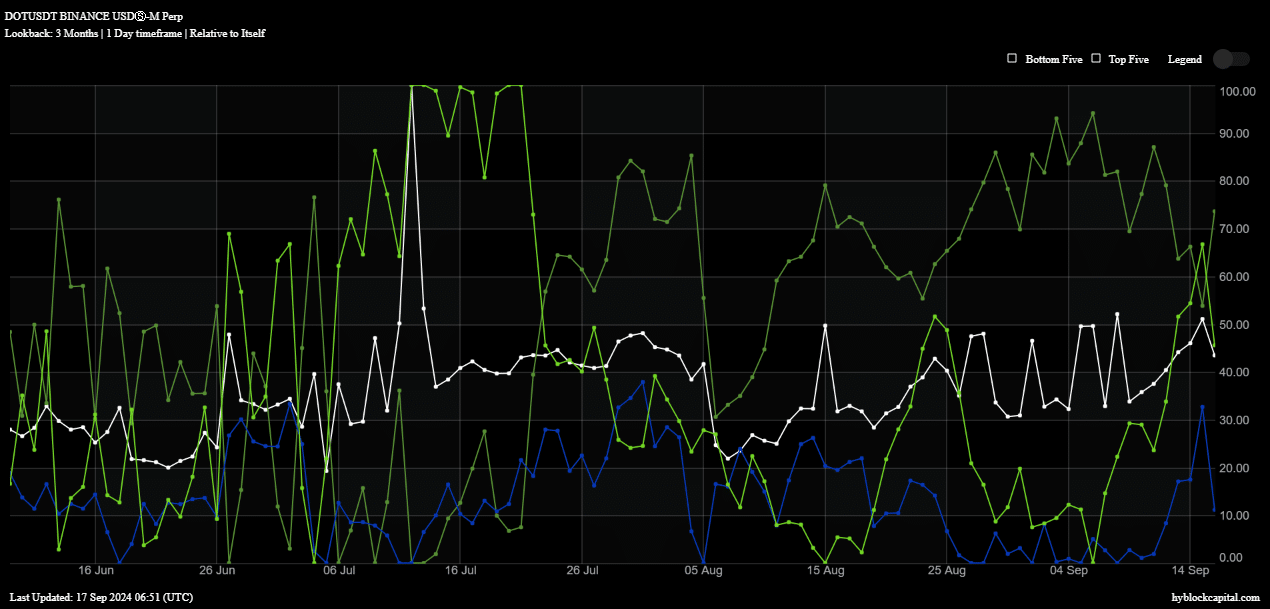
- Percentage of longs rising in conducive liquidity changes.
Polkadot [DOT] seems to be gradually gaining momentum in the Web3 space, following a recent upgrade that has attracted significant attention from developers.
Like other cryptocurrencies, DOT has faced declines in recent months. However, there are promising signs of a potential bottom forming, which has sparked optimism for the final quarter of 2024.
The weekly MACD is showing higher lows, and the moving averages are flattening, indicating that DOT could be preparing for a bullish run as the market stabilizes and recovers.

Source: TradingView
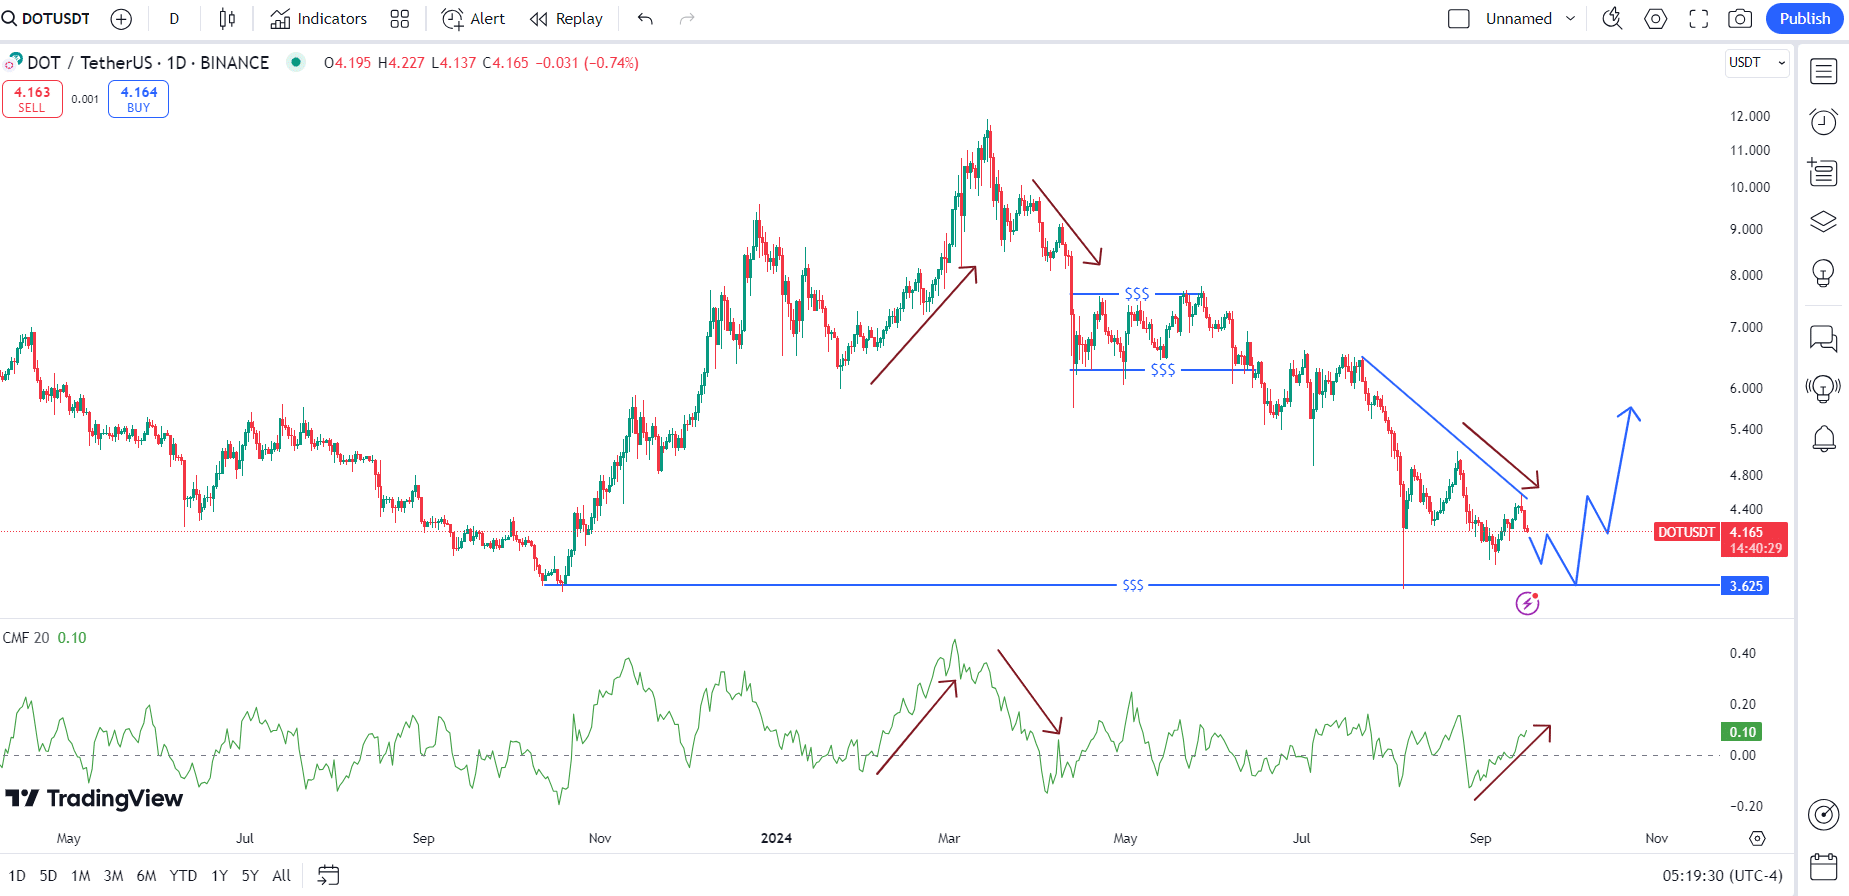
Polkadot’s price action further supports this outlook. DOT/USDT has shown resilience by failing to break below the low it reached in October 2023, which preceded a bull run that peaked in March.
Since then, the price has been trending downward. The August 5th market crash low has not been breached, suggesting accumulation is taking place.
A potential double bottom at $3.56 could indicate a reversal is near. When analyzing the Chaikin Money Flow (CMF) indicator alongside DOT’s price, a divergence appears: while CMF is rising, DOT’s price has been declining.
This divergence hints at accumulation and suggests buying pressure could soon drive the price higher.
Analysts at AMBCrypto predict that DOT may need to test the $3.56 level before making a decisive move to the upside.
DOT long positions rising…
Additionally, the percentage of long positions on Polkadot token is surging, currently standing at 73%.
This high percentage indicates growing bullish sentiment among whales, retail investors, and institutions, who are likely accumulating DOT in anticipation of a price increase.
The whale vs. retail delta, currently at 46%, also shows a bullish trend, with only a slight dip today, reinforcing the positive outlook for DOT.
Favorable liquidity dynamics
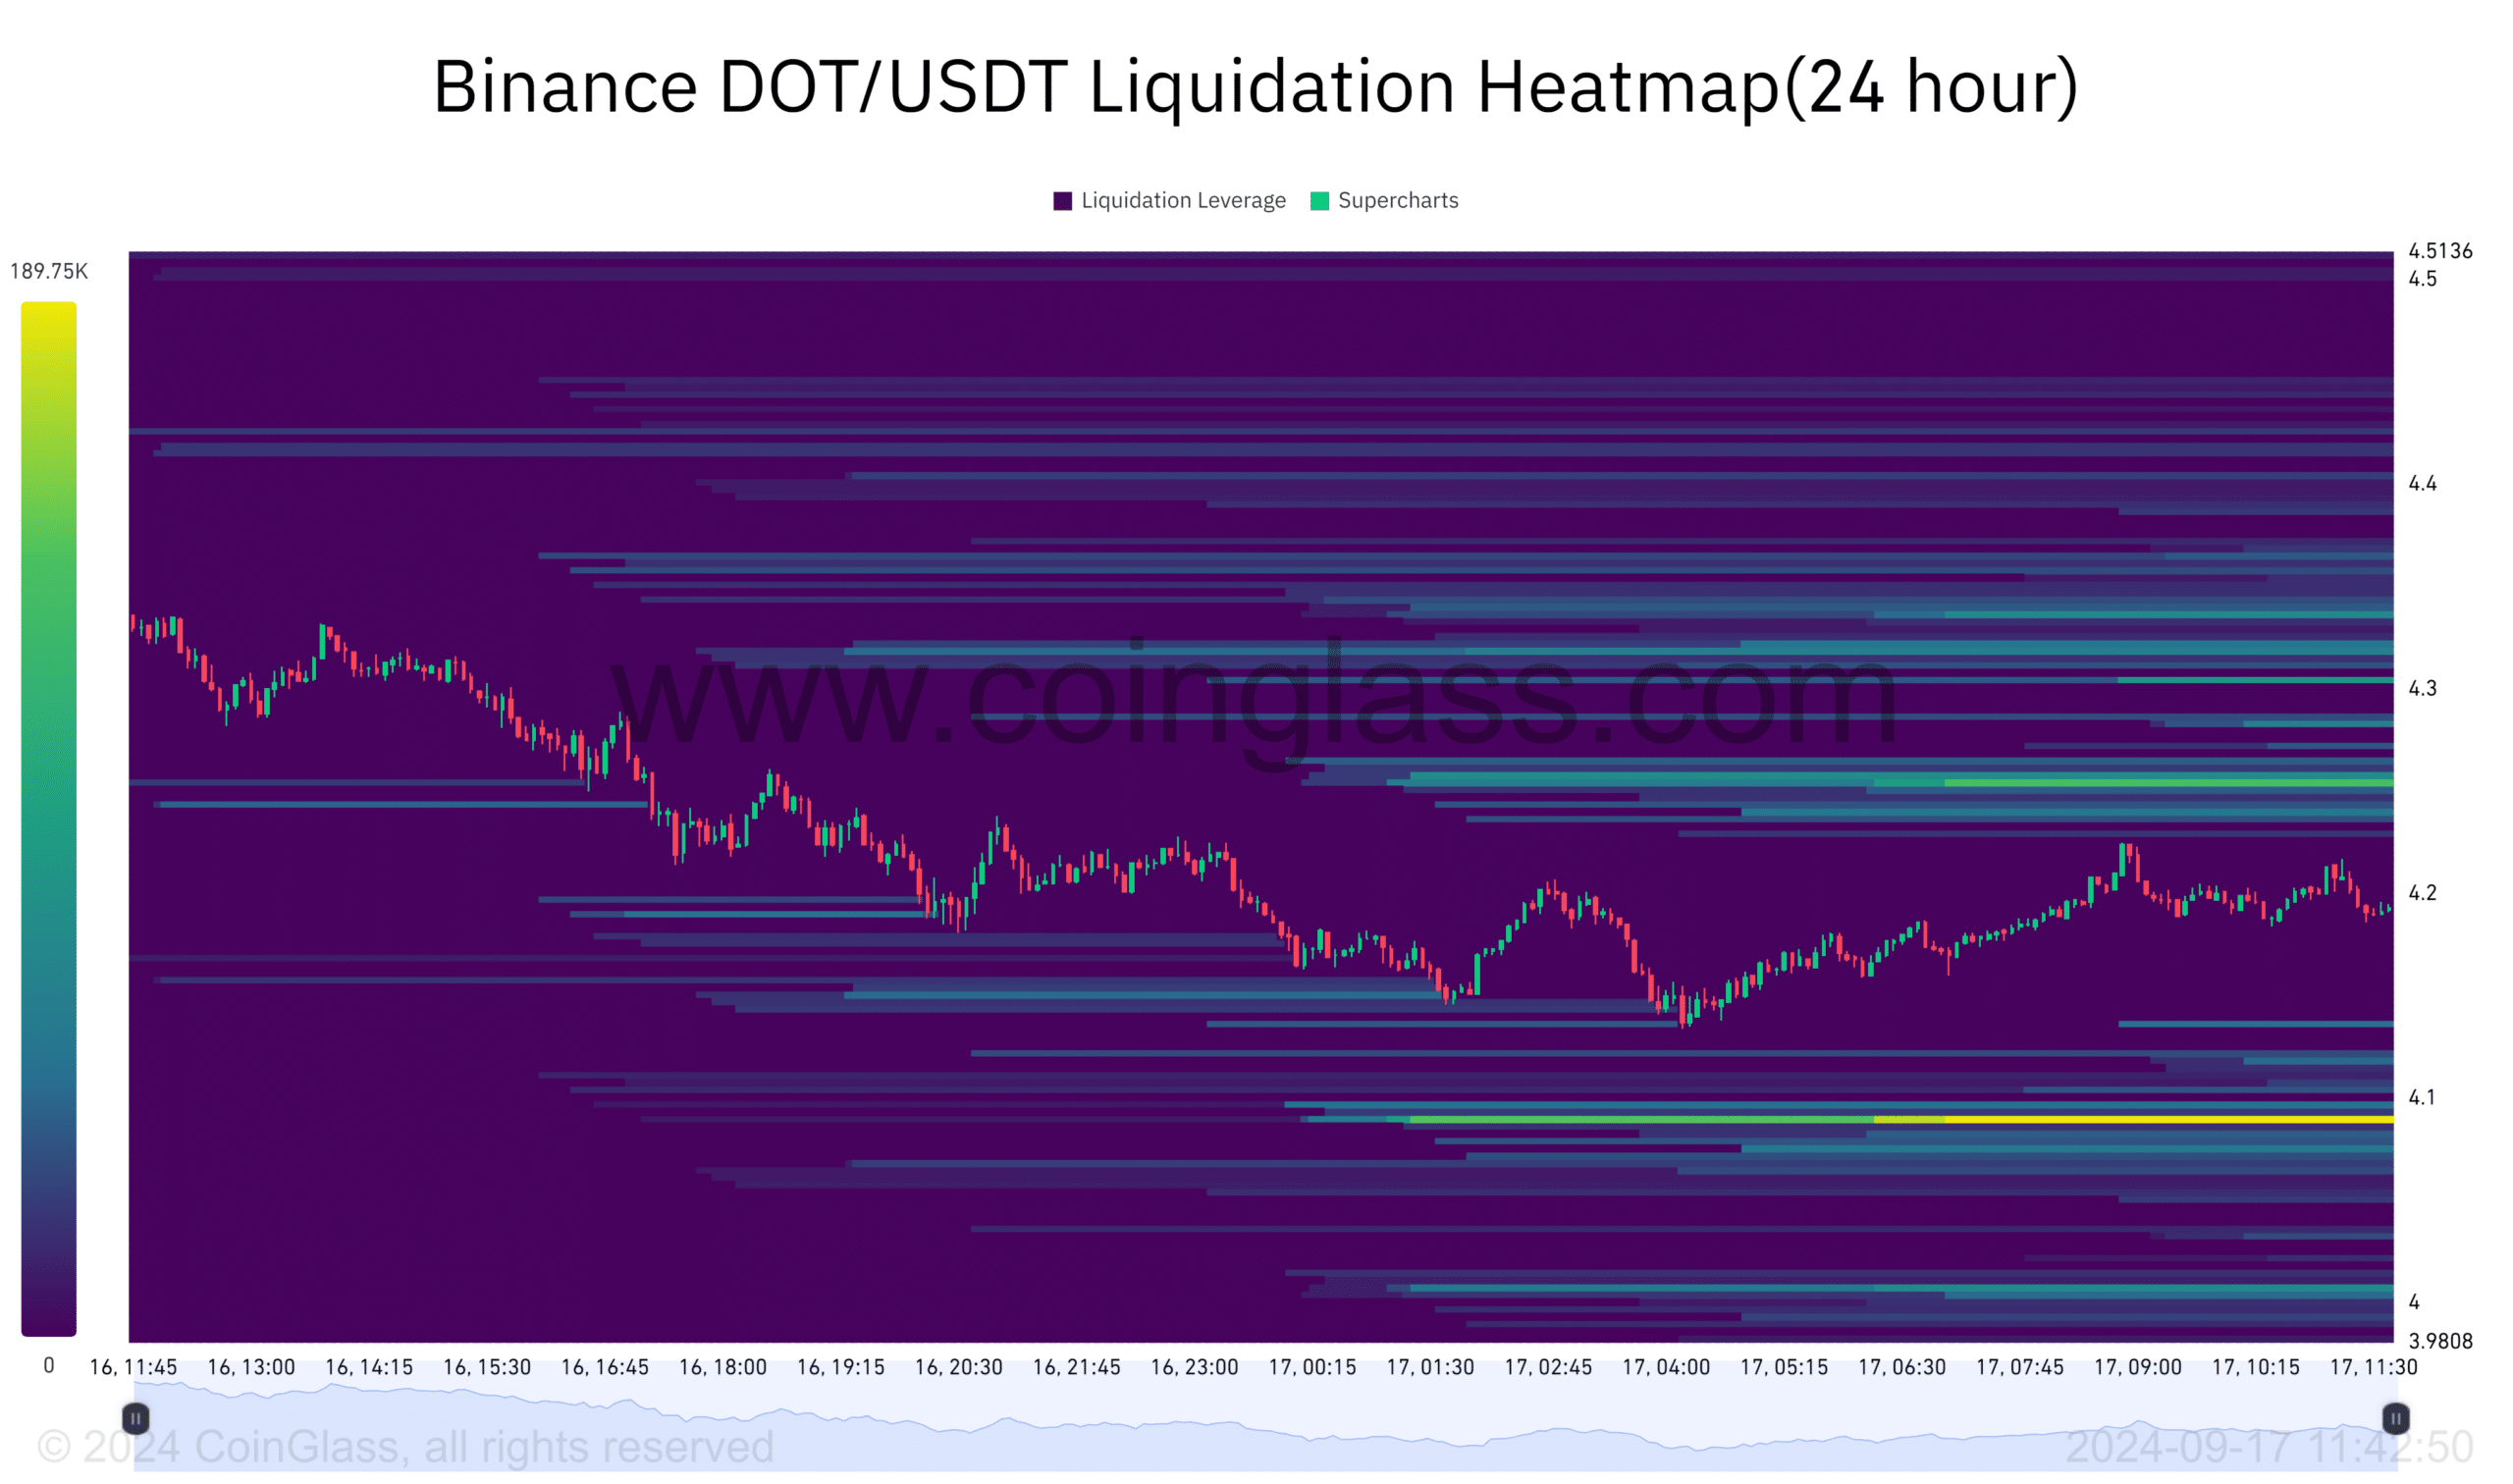
Polkadot’s price movement is largely influenced by liquidity zones. DOT tends to move from areas of low liquidity to those with higher liquidity.
At the moment, liquidity zones that suggest higher prices are closer to DOT’s current price action. This indicates that DOT is more likely to move upward, with the next significant target being the $4.25 level, which holds $117,000 in liquidations.
In contrast, the lower liquidity zone at $4.08 has $189,700 in liquidations, making an upward move the more probable scenario.
Read Polkadot’s [DOT] Price Prediction 2024-25
DOT has already picked up liquidity below its current price, so it is poised to aim for higher liquidity zones above, potentially driving its price higher.
Investors are watching closely as Polkadot prepares for what could be a significant upward move in the near future.


