Polkadot slides below $10: Why are bears targeting $7.09?
DOT rallied 77% in four days' time. Will Polkadot face a pullback?

- DOT saw a bullish moving average crossover as prices catapulted beyond $10.
- The bears began to pull this move back immediately as BTC prices began to slide lower as well.
Polkadot [DOT] rallied 185% from the lows posted at $3.7 on the 4th of November. It has retraced a portion of those gains, and a deeper price dip appeared likely.
Since the second half of March, Polkadot had been in a downtrend. It continued to trend lower even as November started, but the bulls were able to use the bullish momentum of Bitcoin [BTC] to recover.
The support levels for DOT traders to watch are highlighted below.
DOT breaks the $10 mark
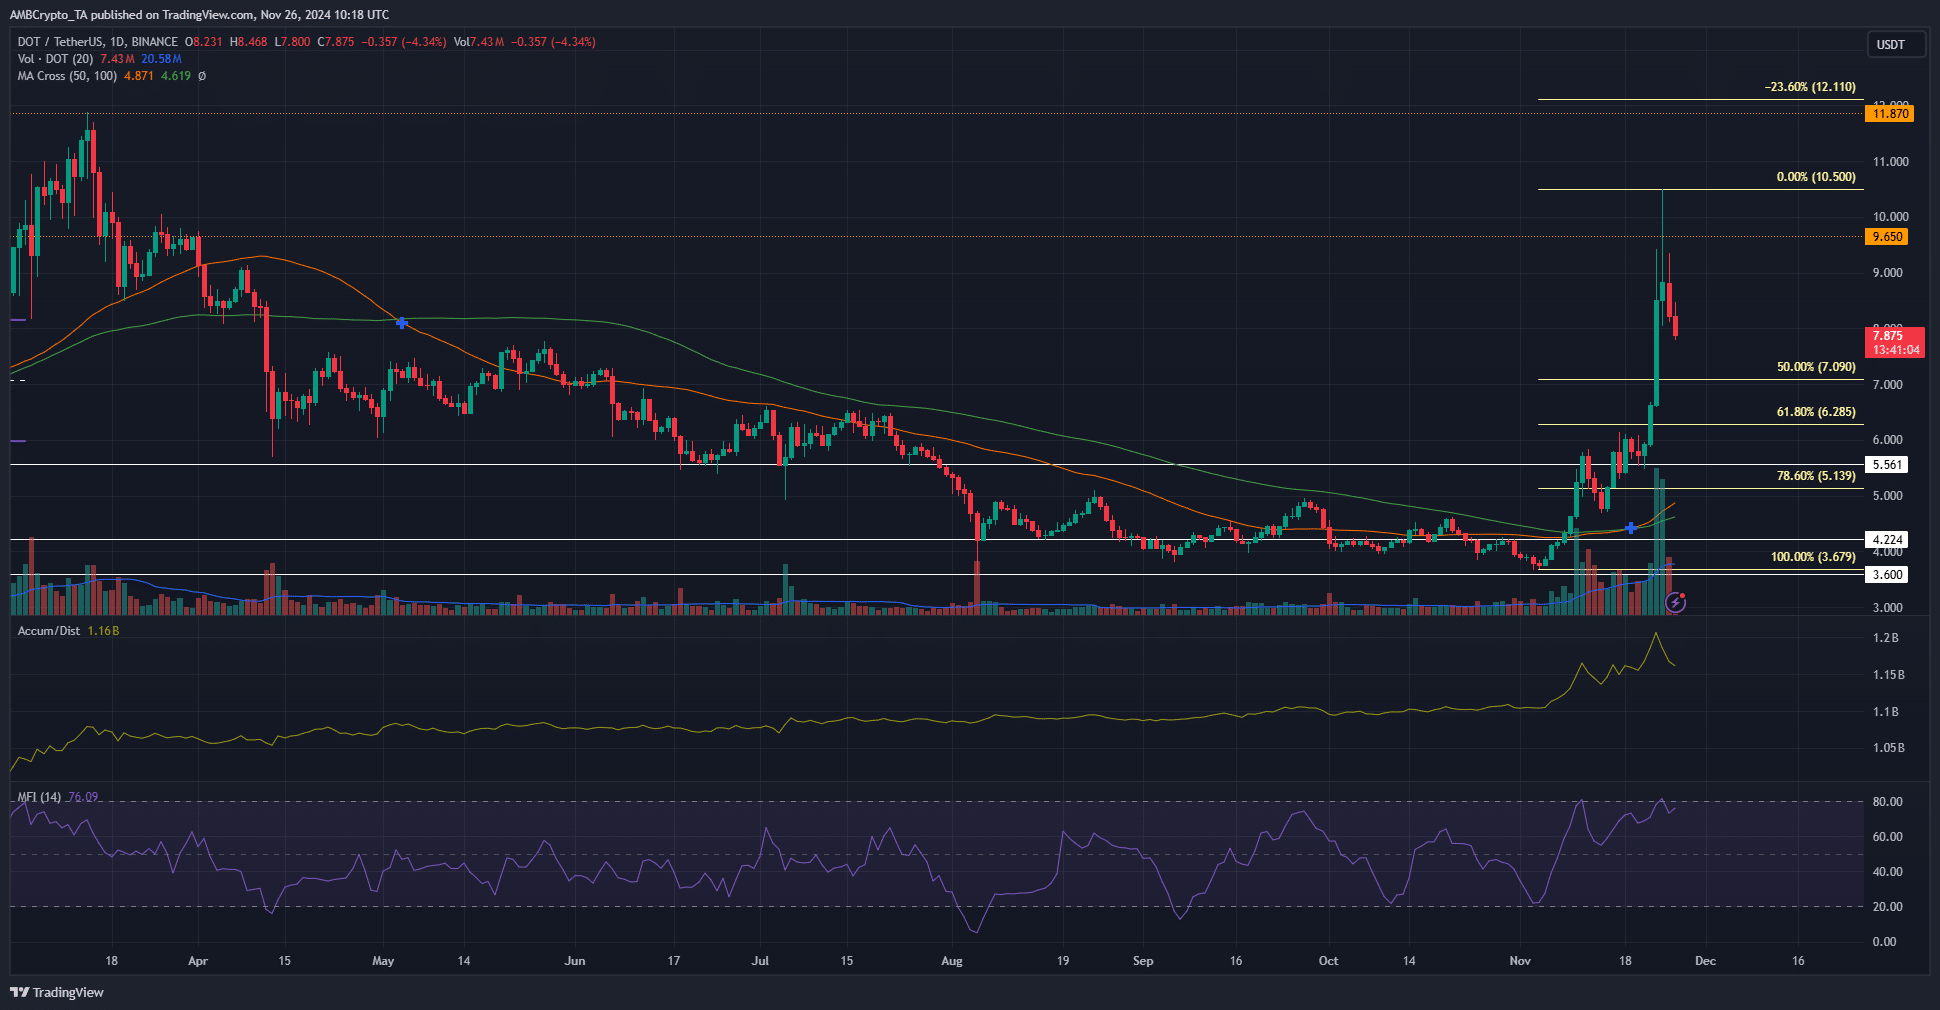
The early November bullish impetus carried DOT prices to $5.7. A pullback to $4.75 and some consolidation beneath the $6 mark allowed the bulls to gather themselves for the next rally.
From the 22nd to the 24th of November, DOT rallied by 77%.
It has retraced a good chunk of the move in the past couple of days and was trading at $7.87, at press time. The A/D indicator continued to climb strongly to show high demand for the token.
Additionally, the Money Flow Index did not signal a bearish divergence.
However, with Bitcoin headed toward the $90k support zone, it is likely that altcoins would suffer a setback. This could force Polkadot toward the Fibonacci retracement levels plotted at $7.09 and $6.285.
Such a dip would be a buying opportunity.
Spot CVD decline hints at weakened demand
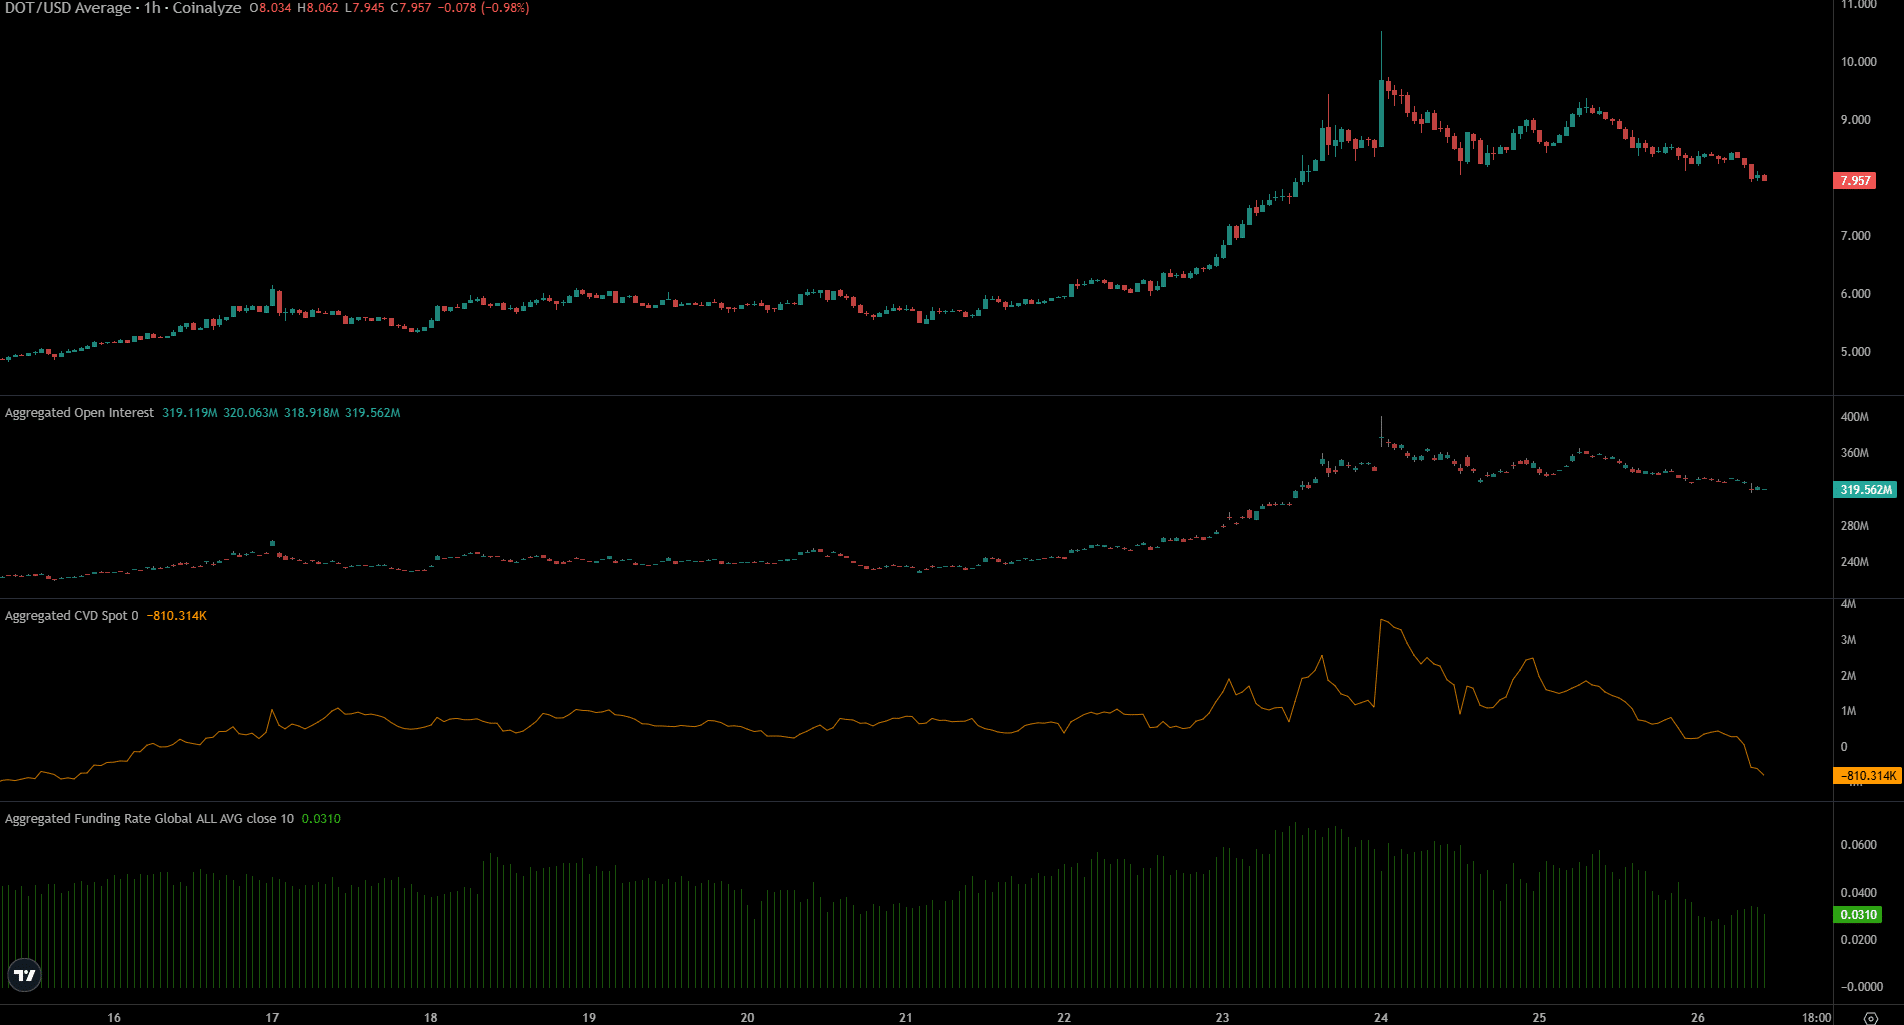
The Open Interest (OI) peaked at $399.8 million on Sunday, the 24th of November. On the same day, the spot CVD saw aggressive inflows and was on an uptrend. This began to change the following day.
Read Polkadot’s [DOT] Price Prediction 2024-25
The OI and the spot CVD began to trend downward, signaling reduced bidding in both the spot and futures markets.
The spot decline was especially steep, showing strong selling pressure in the lower timeframes. The funding rate remained positive, but overall further losses appear likely in the next few days.
Disclaimer: The information presented does not constitute financial, investment, trading, or other types of advice and is solely the writer’s opinion