Polkadot, Solana and Chainlink Price Analysis: June 20

The global crypto market cap was at $1.53 Trillion and a 1.5% decline over the past day was noticed. In correspondence to the decline, most altcoins have been moving southward. Solana saw a dip of 8.9%, DOT fell by almost 8% and lastly LINK by 8.3%. Overall, the altcoin market displayed bearish sentiments.
Polkadot (DOT)
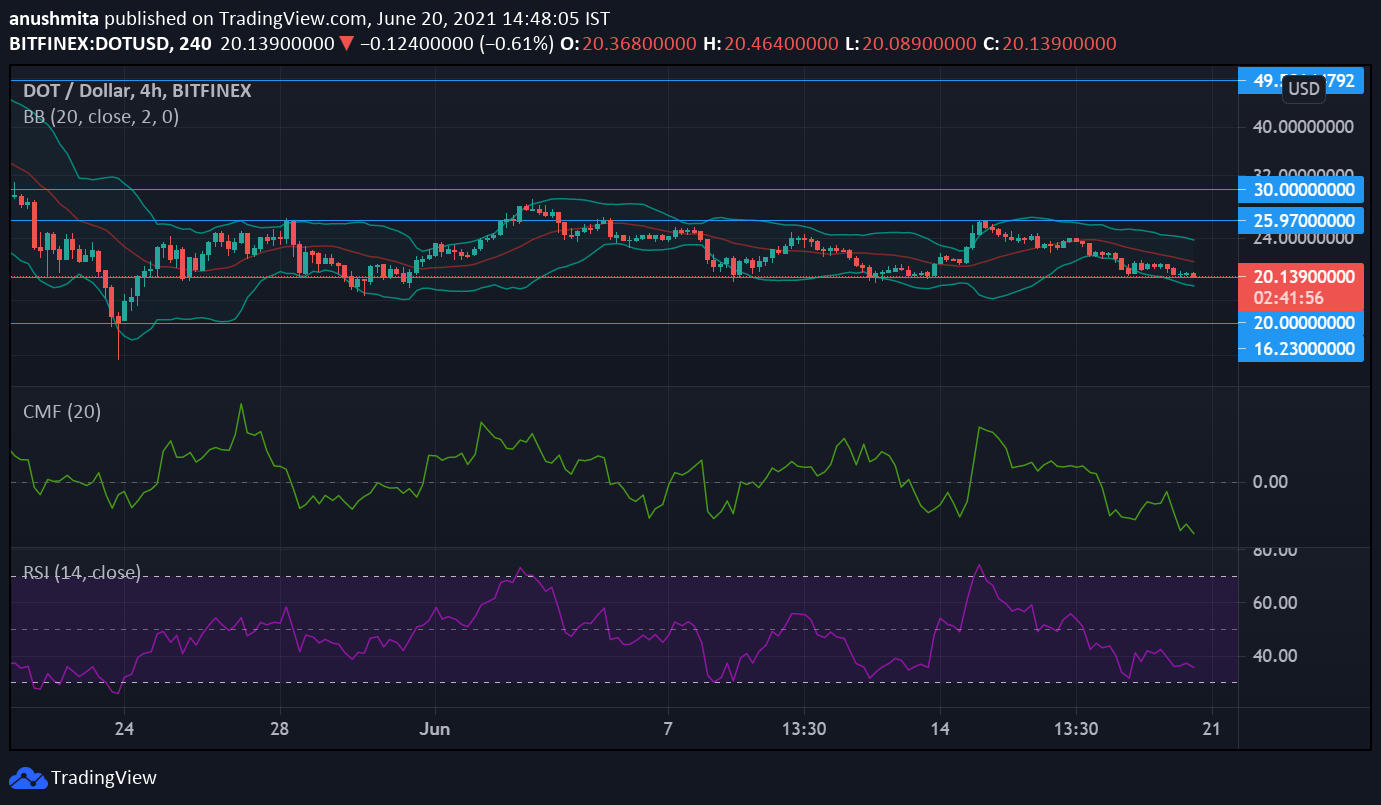
DOT saw a decline of almost 6% in the last 24 hours and was trading at $20.28 at press time. DOT hadn’t broken through the $25 resistance level for the past week, however, a further dip in prices would mean that the alt could fall below its $20 support mark.
The alt had witnessed some volatility since the beginning of this month, but Bollinger Bands indicated that price fluctuations are not anticipated as the bands remained convergent. Chaikin Money Flow demonstrated increased capital outflows than inflows.
Relative Strength Index displayed that the coin is about to reach the oversold zone as the indicator was almost about to touch the 30-mark.
Solana (SOL)
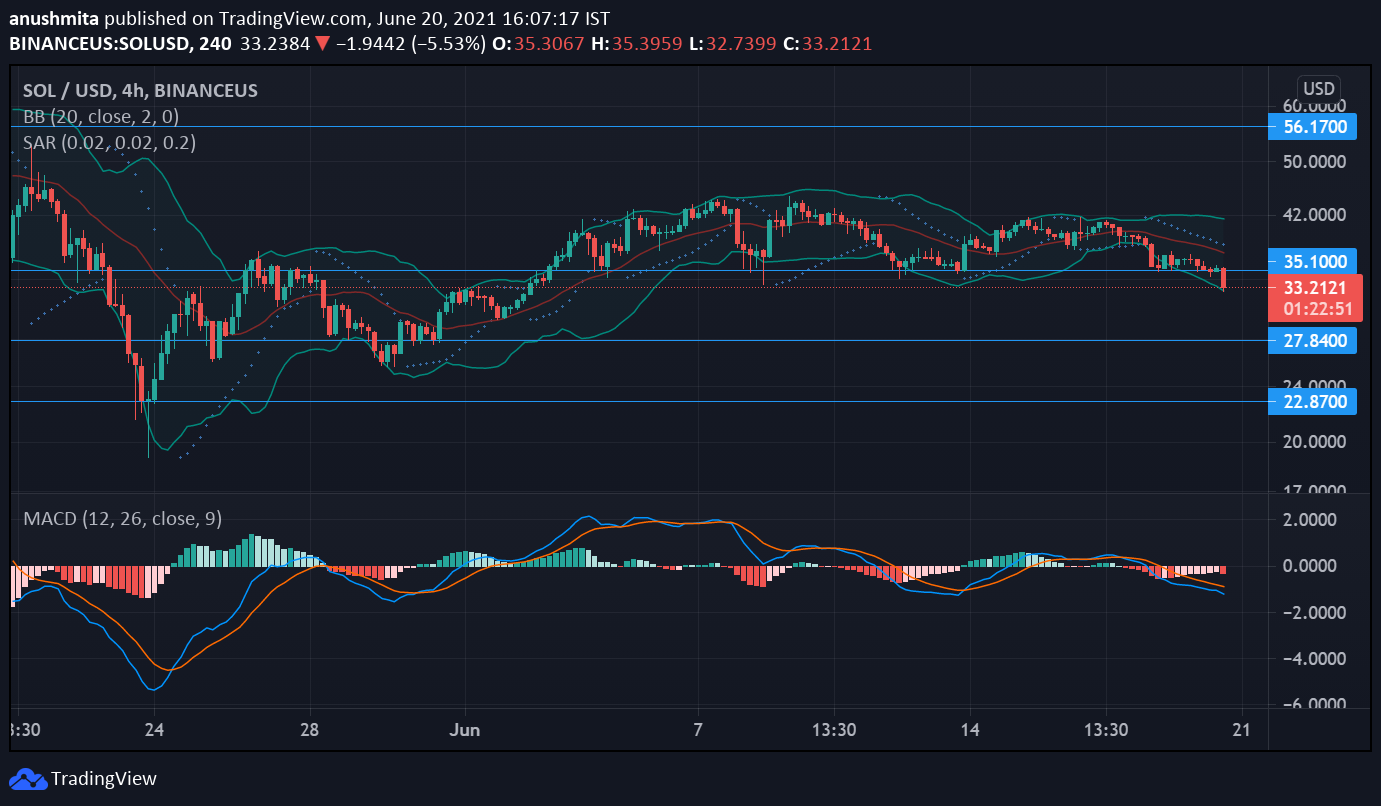
SOL had made a considerable recovery on June 14, however, prices started to dip since June 17. At the time of writing, the alt was trading in red; it was valued at $33.15 which indicated that it broke past its $35 support level. SOL will soon find support at the $27 level if prices continue to fall.
Parabolic SAR pointed toward a downtrend as prices have fallen since June 17. In regard to price fluctuations, the coin could potentially see price volatility as Bollinger Bands have broadened at press time.
The chart indicated a bearish crossover on June 17 as seen on the MACD indicator, the alt has started to tread on a bearish momentum ever since.
Chainlink (LINK)
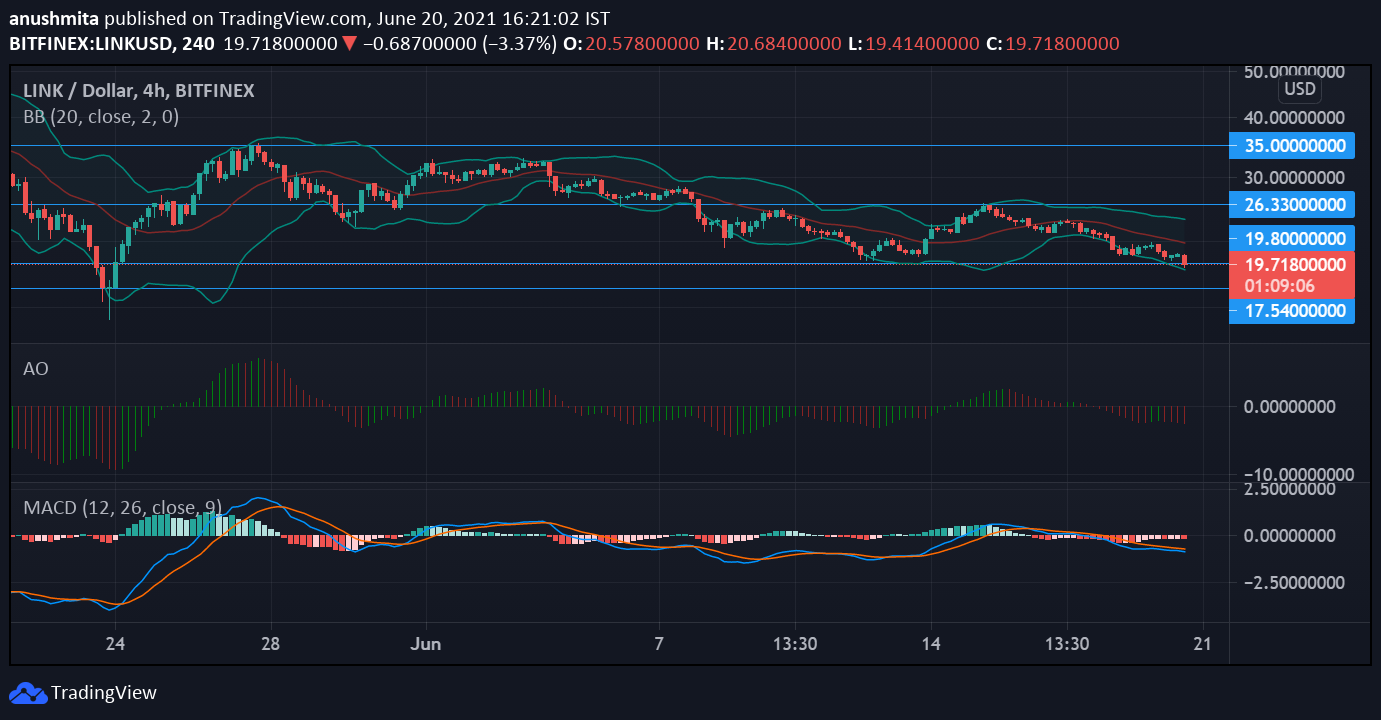
Chainlink fell by 8% in the past 24 hours, after recovering until June 15, there was a steady drop in prices ever since. After having broken the $21 support level in the last 48 hours, LINK could also go below the $19 support level. LINK traded at $19.66 at press time. Awesome Oscillator displayed affirmed bearish momentum which had set in on June 16. Bollinger Bands are appearing to diverge which indicated that volatility could increase in the coming days.
MACD demonstrated a bearish crossover on June 16 and as the market still belonged to the bears at the time of writing.