Polkadot, Solana, NEAR Price Analysis: 24 December

As the broader market witnessed a strong recovery wave, Ethereum crossed the $4,100-mark whilst Polkadot, Solana and NEAR saw a patterned breakout as a Christmas gift.
Polkadot (DOT)
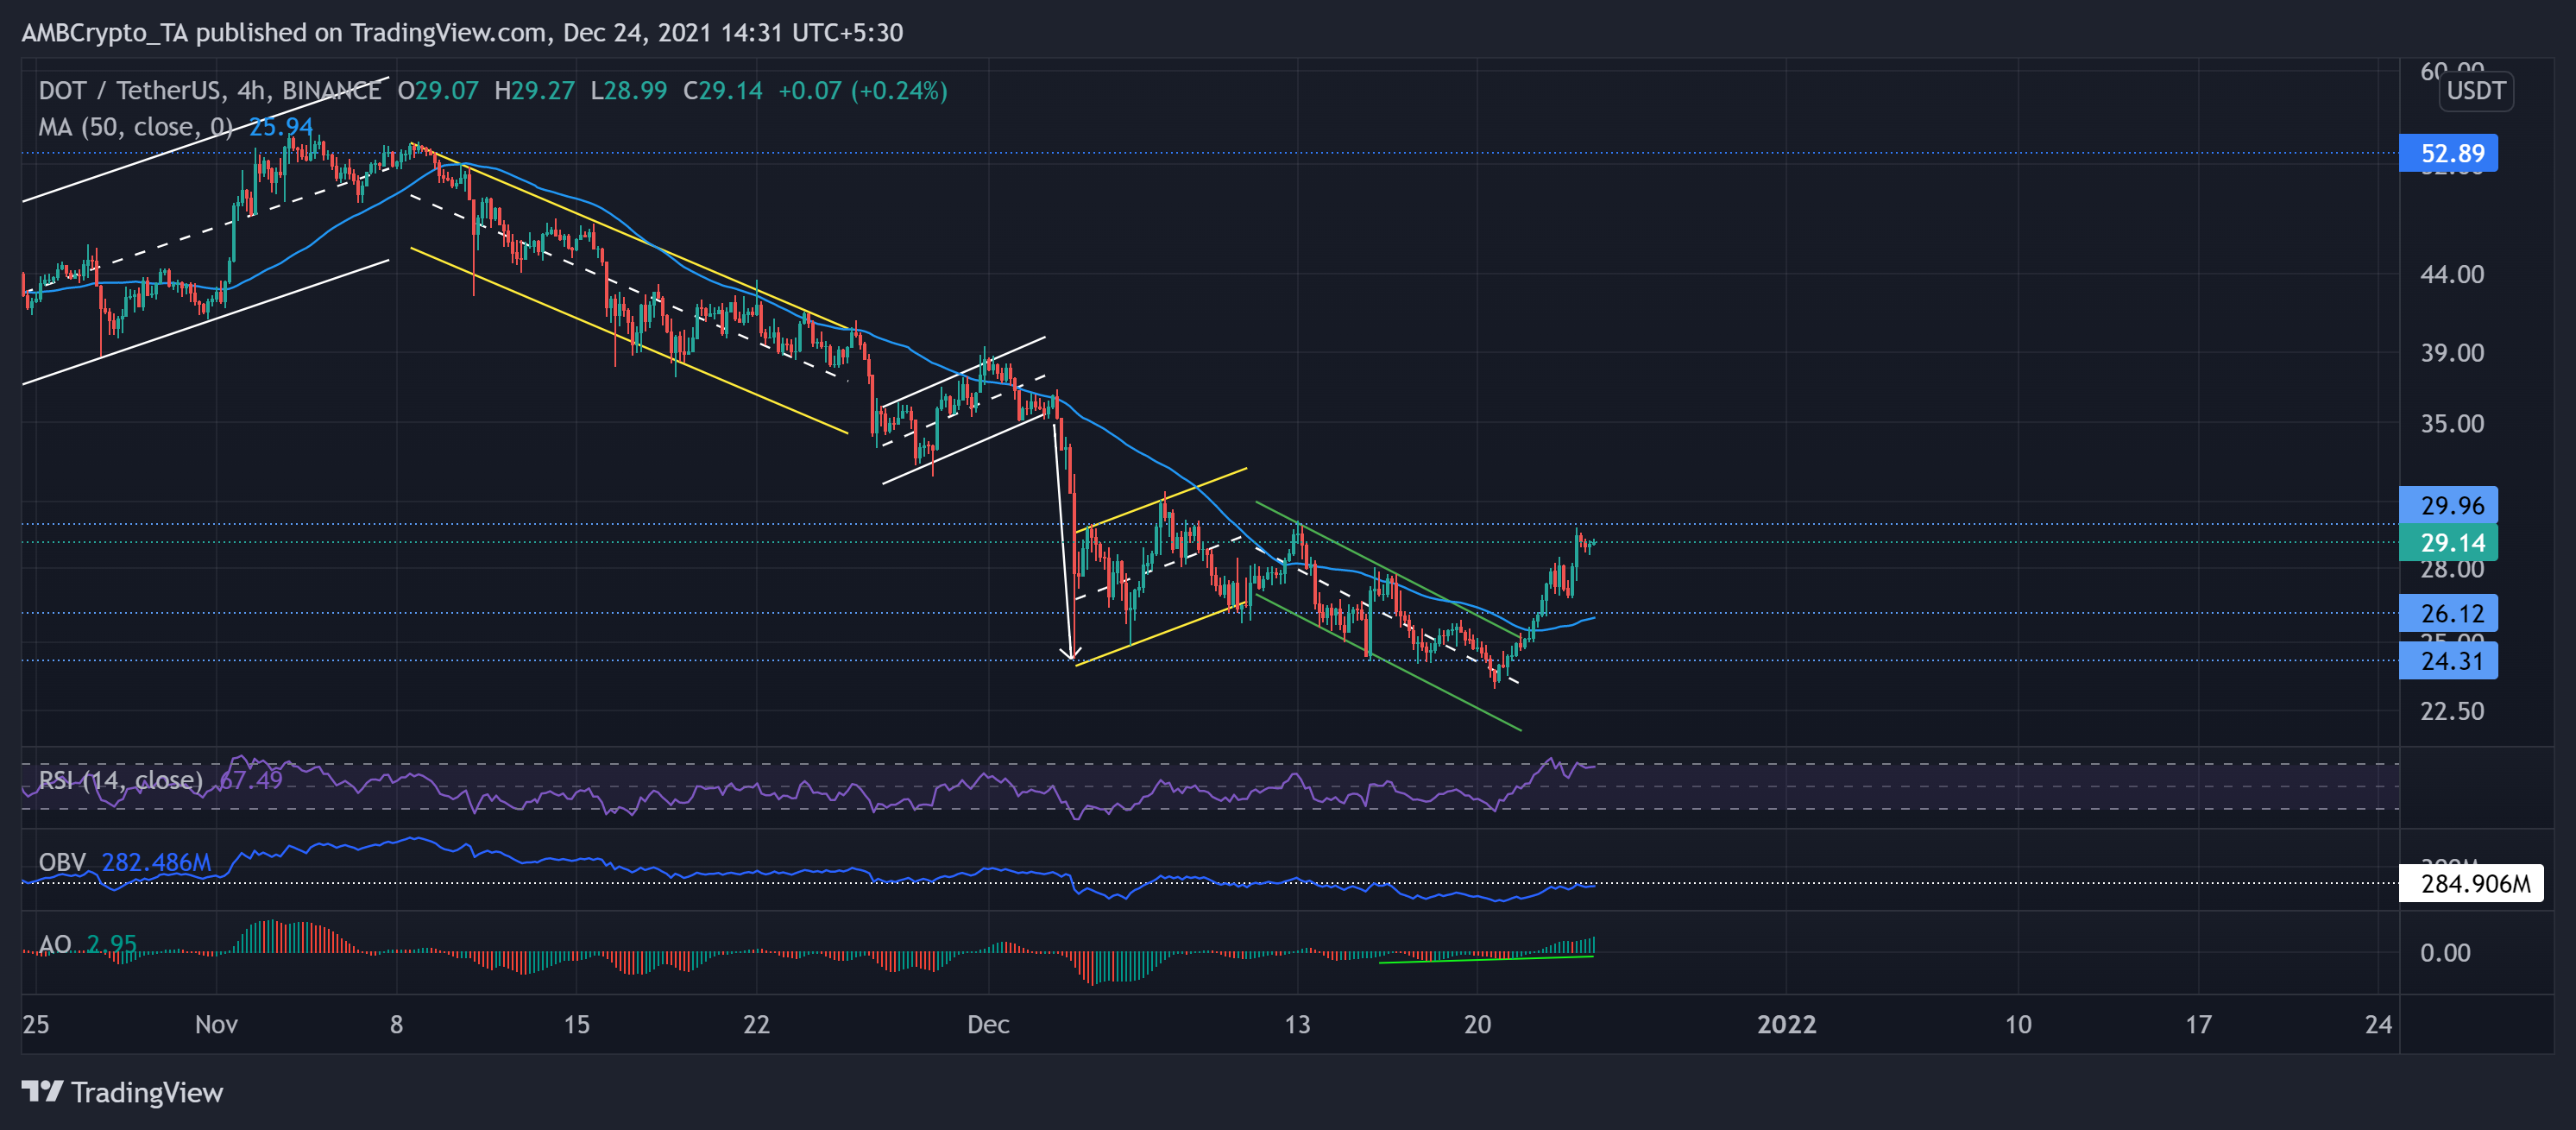
DOT bears over-retraced its previous bull run in an up-channel (white) as the token lost its 16-week previous support at the $26-mark. The alt poked its 15-week low on 20 December. Nevertheless, the bulls ensured the $24.31 longer time frame support.
Thus, they retested the upper channel (green) multiple times until DOT witnessed a down-channel breakout on 21 December. The digital currency noted a 26.07% incline in just four days (from 20 December low).
This push flipped the 50-SMA (blue) into its immediate support at the $26.12-mark. Bears ensured the 20-day resistance at the $29.9-level.
At press time, the alt traded at $29.14. The RSI was northbound after a sharp surge as it wavered near the 67-mark. Also, the AO formed bullish twin peaks below the equilibrium over the past week as the momentum swayed in bullish favor. Although the OBV was in an uptrend, it could not breach its immediate resistance.
Solana (SOL)
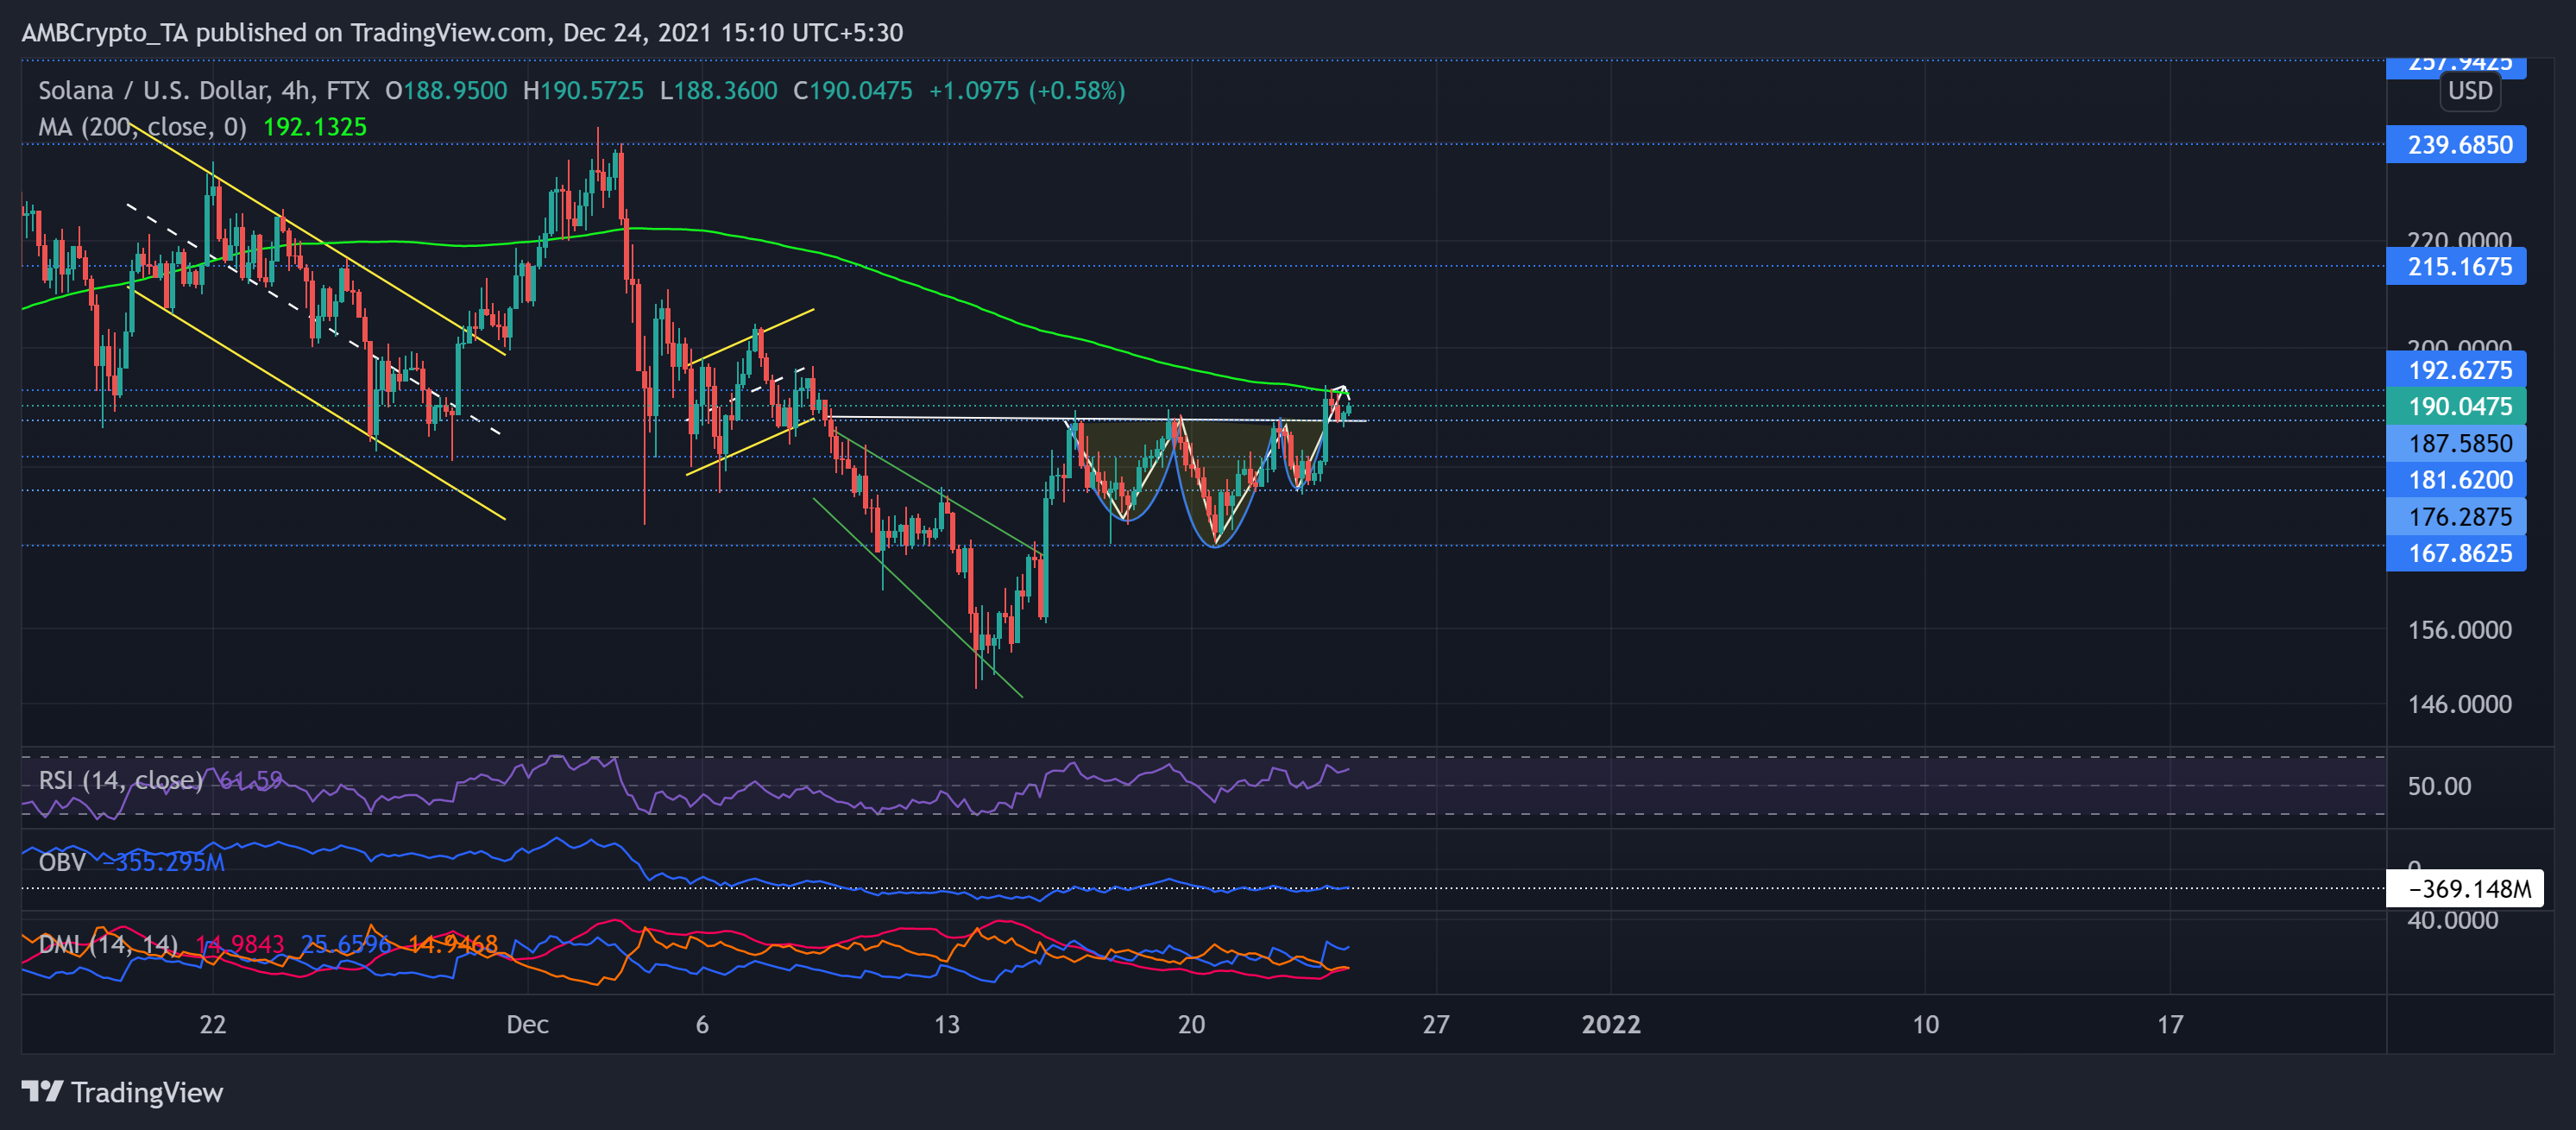
Over the past day, SOL saw an inverse head and shoulder pattern after the falling wedge (green) breakout as the price snapped the $187.5-level. The bulls tested this level for the past eight days while marking higher lows.
The ascent halted at the $192.6-mark resistance, which coincided with the 200-SMA, while the immediate testing support stood near the $187.5-level.
At press time, SOL traded at $190.0475 after noting a 6.92% 24-hour gain. The RSI flashed a bullish bias after marking higher lows over the past four days. Further, DMI affirmed the previous readings, but the ADX displayed a weak directional trend for SOL. Besides, the OBV still wavered close to its immediate support and did not see a major spike.
Near Protocol (NEAR)
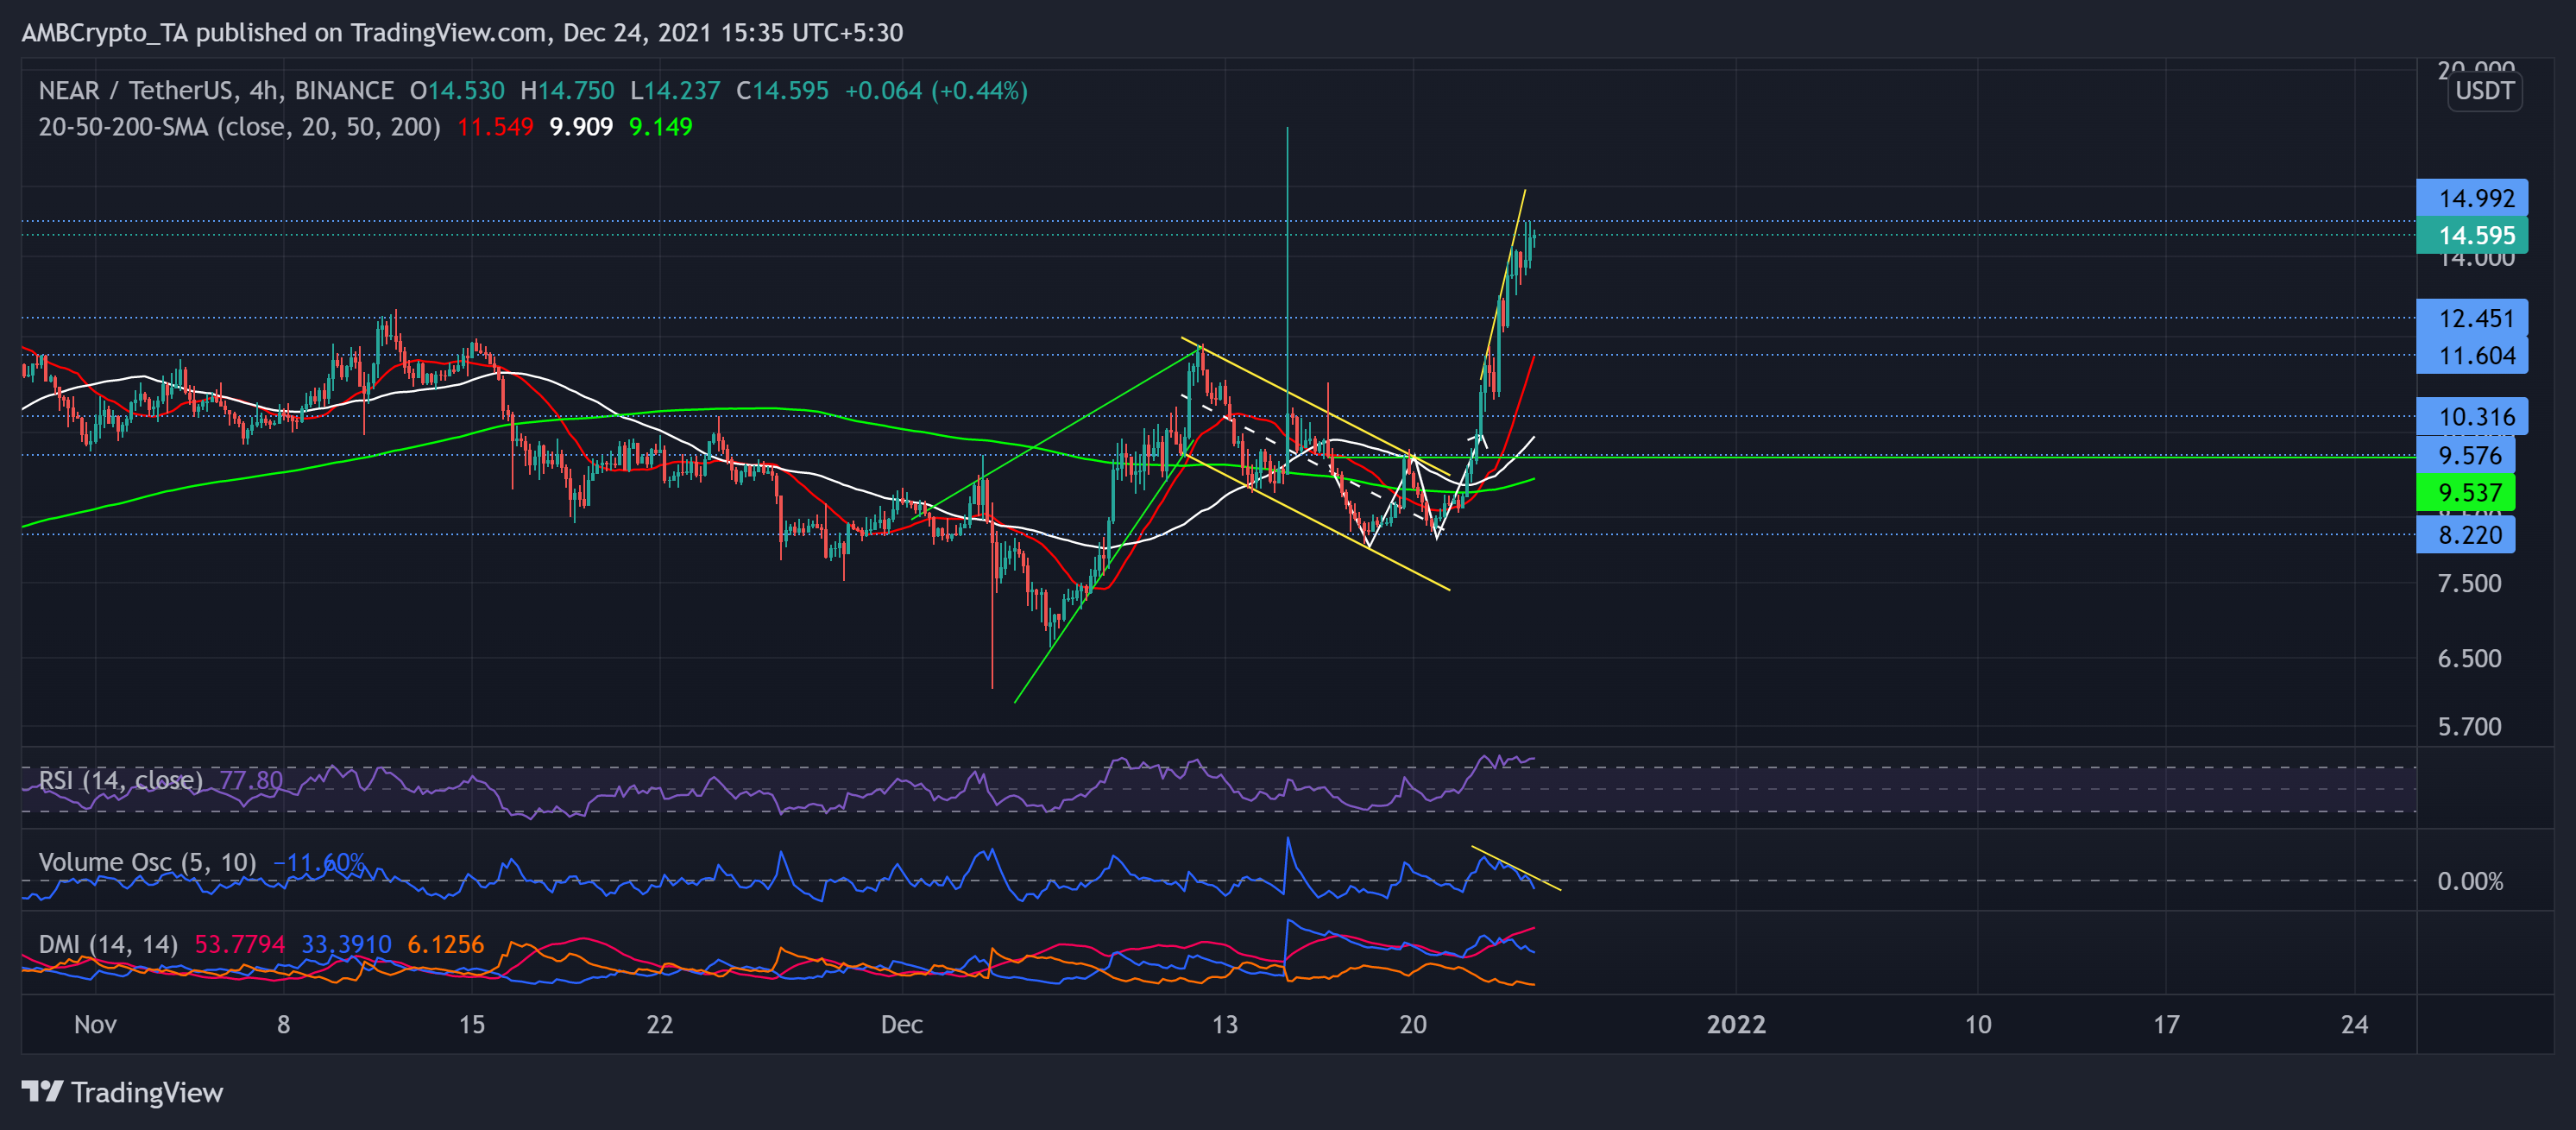
After oscillating in a down-channel, NEAR broke out of the double-bottom formed over the past eight days. The alt found a strong $8.2-level support as the price bounced back from it and entered into price discovery.
NEAR jumped by a staggering 82.76% from the 20 December low and poked its ATH on 24 December. At press time, the alt traded above its 20-50-200 SMA at $14.595.
The RSI was deep into the overbought region and displayed a one-sided bullish preference. Also, the DMI reaffirmed the previous analysis. However, the Volume Oscillator marked lower highs over the past two days.


