Polkadot, Stellar, NEAR Price Analysis: 24 February

After the recent political unrest between Russia and Ukraine, the crypto market witnessed a major sell-off. As a result, Polkadot, Stellar and NEAR touched their multi-month lows on 24 February after registering double-digit 24-hour losses.
Polkadot (DOT)

DOT bears were in the driving seat after they flipped the $23.11-mark from support to resistance. The recent decline phase entailed a 37.4% fall in just the last 16 days. Consequently, DOT gravitated toward its seven-month low on 24 February.
Over the past day, the alt lost the $16-mark that the bulls upheld for over 30 weeks. Any close below the down-channel (yellow) could propel a $13-level test.
At press time, the DOT traded at $14.42. The RSI stood in the oversold region and eyed to test the 24-28 range of support. The CMF followed the price for the most part as it continued its southbound oscillation and displayed a bearish edge.
Stellar (XLM)
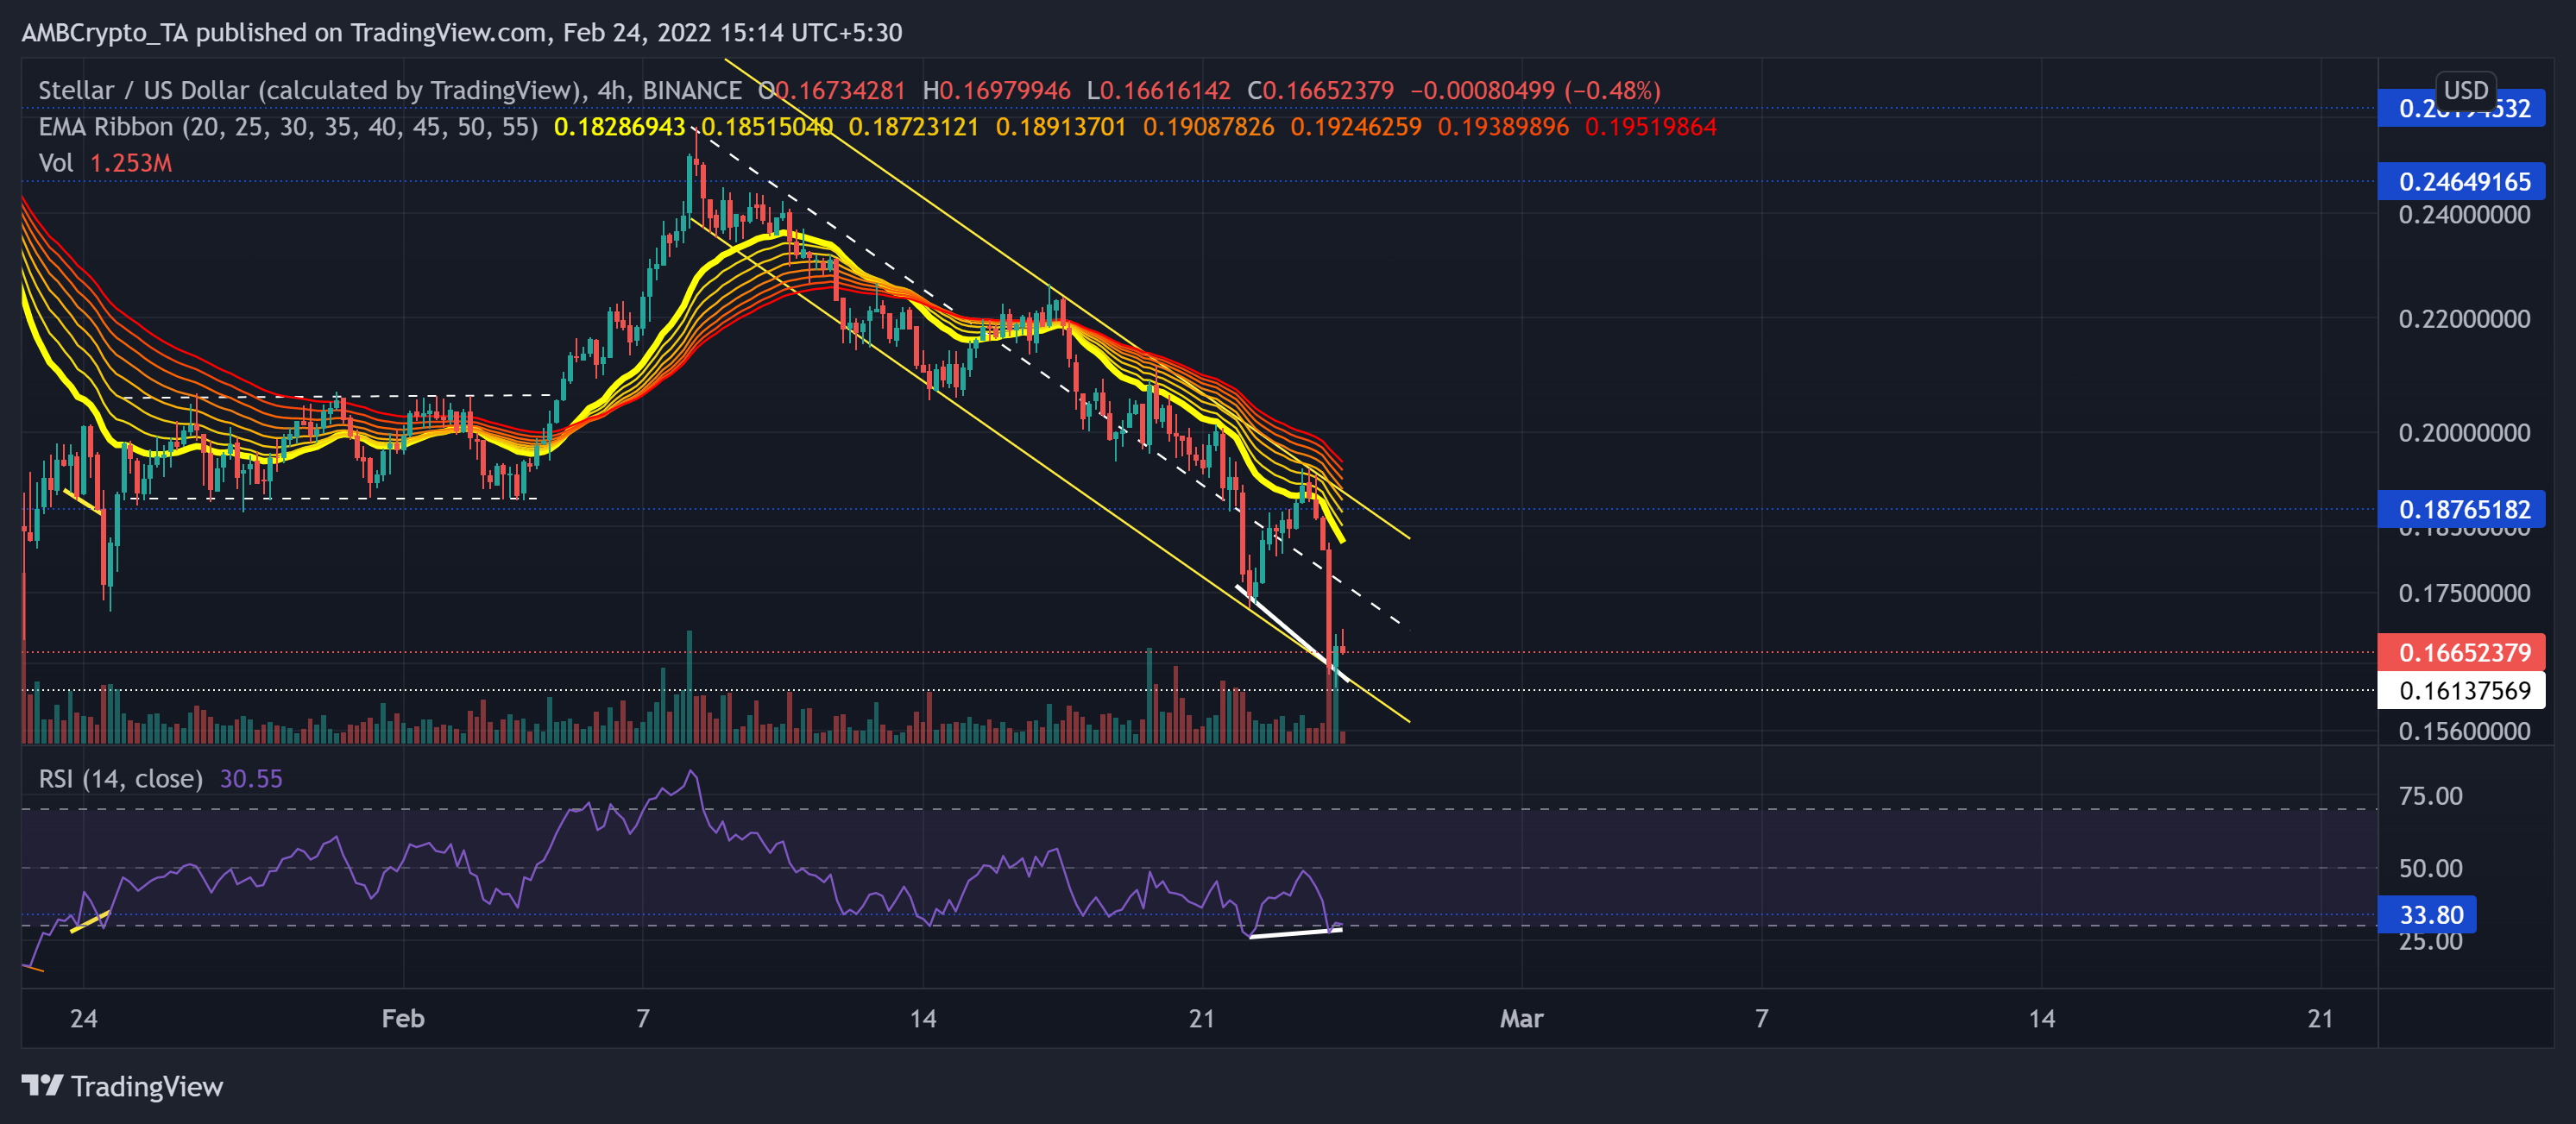
After recovering from its one-year low on 22 January, the alt saw impressive gains by rising above all its EMA Ribbons. However, since the sellers accelerated their force at the $0.2464-level, XLM descended in a down-channel (yellow).
After losing over 36% of its value in the last 16 days, XLM plunged towards its 13-month low on 24 February. During this phase, the 20 EMA continued to display a strong resistance. Now, as the buyers show a willingness to defend the $0.161-mark, XLM eyed to test the midline of the down channel.
At press time, XLM was trading at $0.1665. The RSI swayed in the oversold territory after testing the 33-mark. In the last few days, it formed a bullish divergence (white trendline) with price as the alt endeavored to initiate a recovery. Also, the recent pullback volumes have been higher than the recovery volumes, affirming the bearish intentions.
Near Protocol (NEAR)

Since its ATH on 15 January, NEAR lost 62.83% of its value and rushed toward its 11-week low on 24 February. Moreover, it also lost its crucial $9.5-level resistance (previous support).
NEAR witnessed an ascending channel (white) breakdown on its 4-hour chart. This fall pierced through vital price points to form bearish trendline support (yellow, dashed). The $7.6 horizontal support coincided with the trendline support. Thus, it is important for the buyers to defend this area to prevent a strong fallout.
At press time, the alt was trading at $7.698. After plunging to its record low, the RSI stood weak at the 27-mark. Interestingly, it has maintained this support over the last two days while the price took a sharp plunge. This reading would entail a bullish divergence if the $7.6-support stood sturdy.


![Artificial Superintelligence Alliance [FET]](https://ambcrypto.com/wp-content/uploads/2026/06/Erastus-4-e1781422659484.jpg)