Polkadot’s March blues mean this for DOT’s recovery
The March lows at $5.12 were also where an H12 bullish order block from 10 March sat, showing that the $5.1 area was a support zone for Polkadot

Disclaimer: The information presented does not constitute financial, investment, trading, or other types of advice and is solely the writer’s opinion.
- The formation of a range was possible, but the trend remained strongly bearish.
- Bitcoin’s weakness could drag DOT beneath support in May.
Tether’s [USDT] Dominance metric has been on an uptrend since 18 April, showing that investors fled to stablecoins over the past month. This resulted from increased selling pressure across the crypto market. Polkadot’s [DOT] prices nosedived similarly over the past month.
Read Polkadot’s [DOT] Price Prediction 2023-24
On 18 April, DOT reached local highs at $7. Since then, it shed 27% in 24 days to test the $5.12 level, which was close to the $5.15 lows from March. Can Polkadot bulls defend this support zone?
Will DOT form a range or face rejection after a minor bounce?
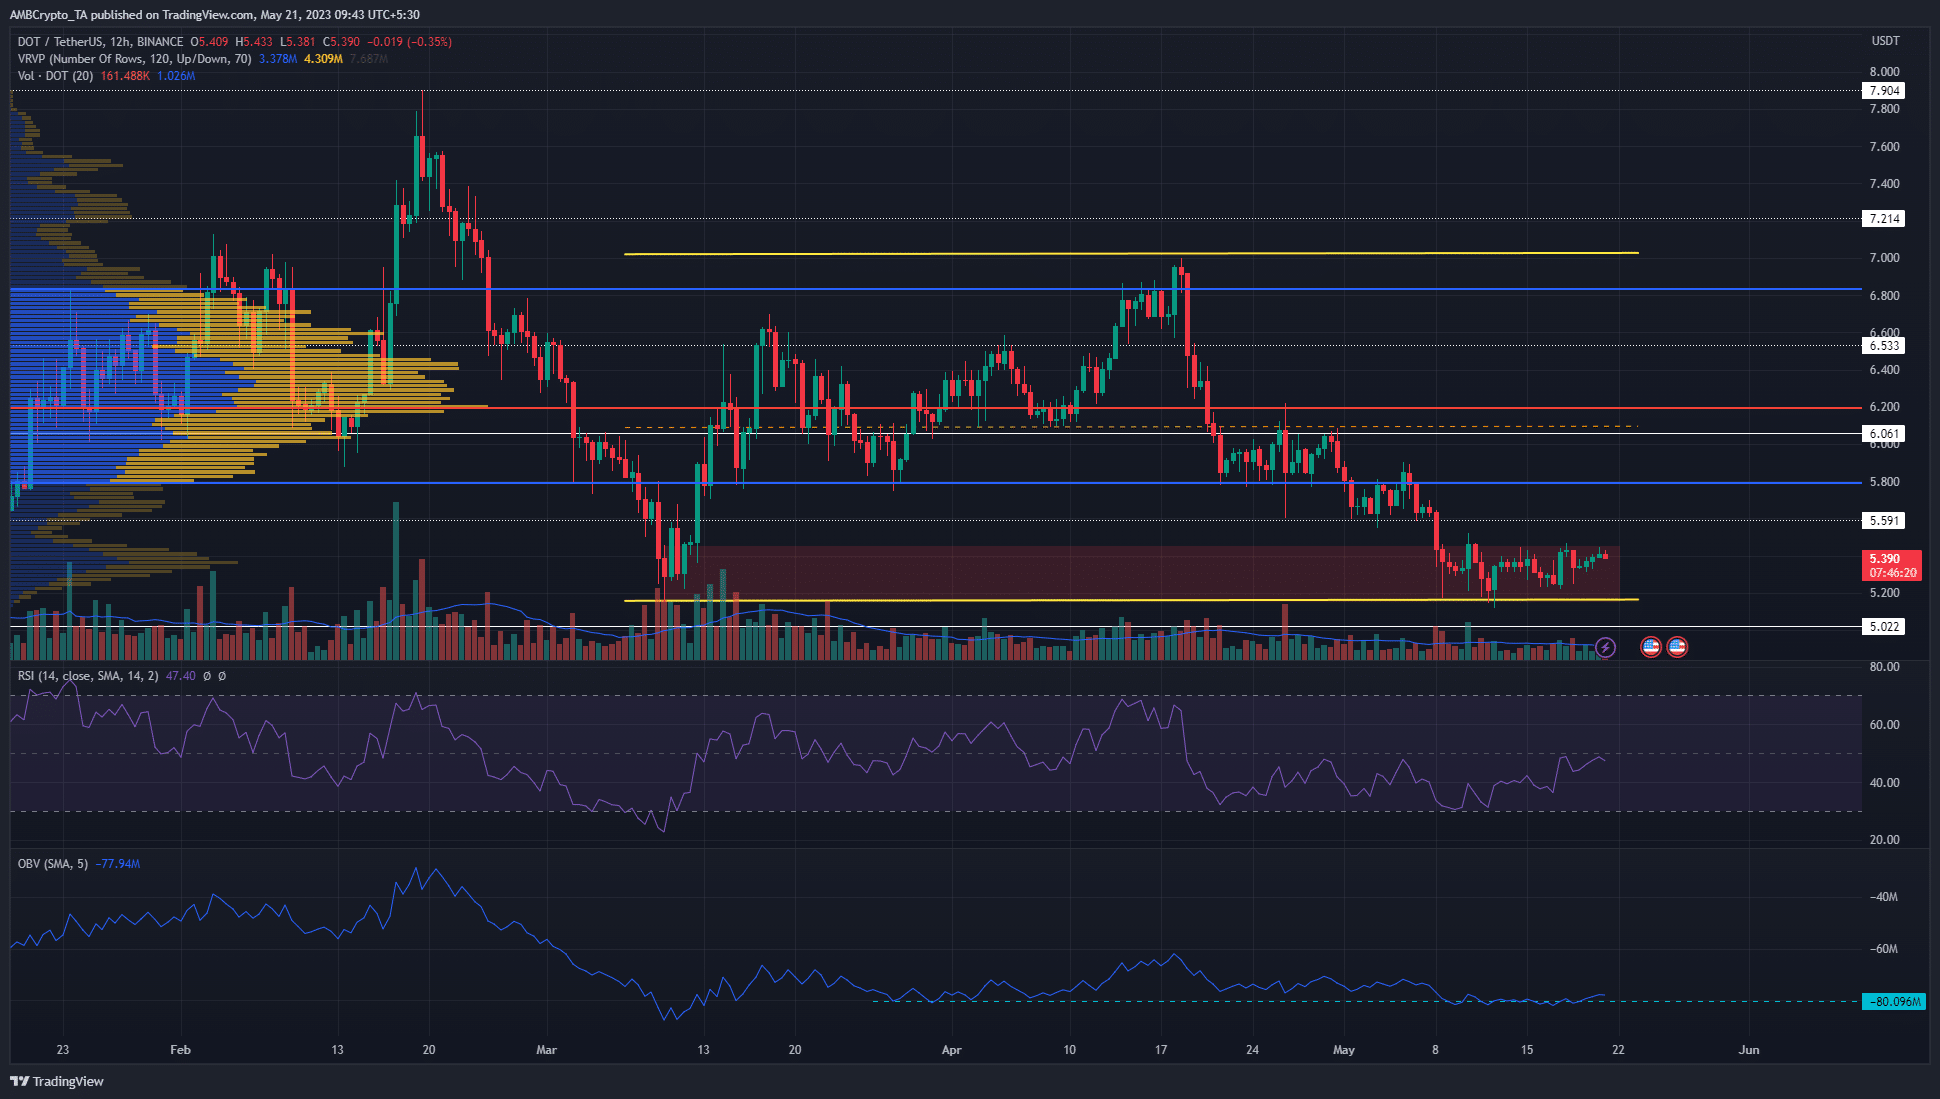
The March lows were also the place where an H12 bullish order block from 10 March sat. This showed the $5.1 area was a support zone for DOT. However, upon a retest of this area, the reaction from DOT bulls was lukewarm.
The Volume Profile Visible Range tool showed that the Value Area Lows were at $5.8, a good distance above current DOT market prices. This showed that DOT would face resistance from the $5.6 and $5.8 levels, even if it flipped the market structure to bullish. This would happen upon a 12-hour trading session close above $5.523.
The RSI was below neutral 50 and has been so for a month. The OBV had defended the support level marked but over the past week it threatened to fall lower. If it does, traders can expect prices to plunge alongside the OBV.
Is your portfolio green? Check the Polkadot Profit Calculator
Rising OI showed some bullish sentiment on the lower timeframes
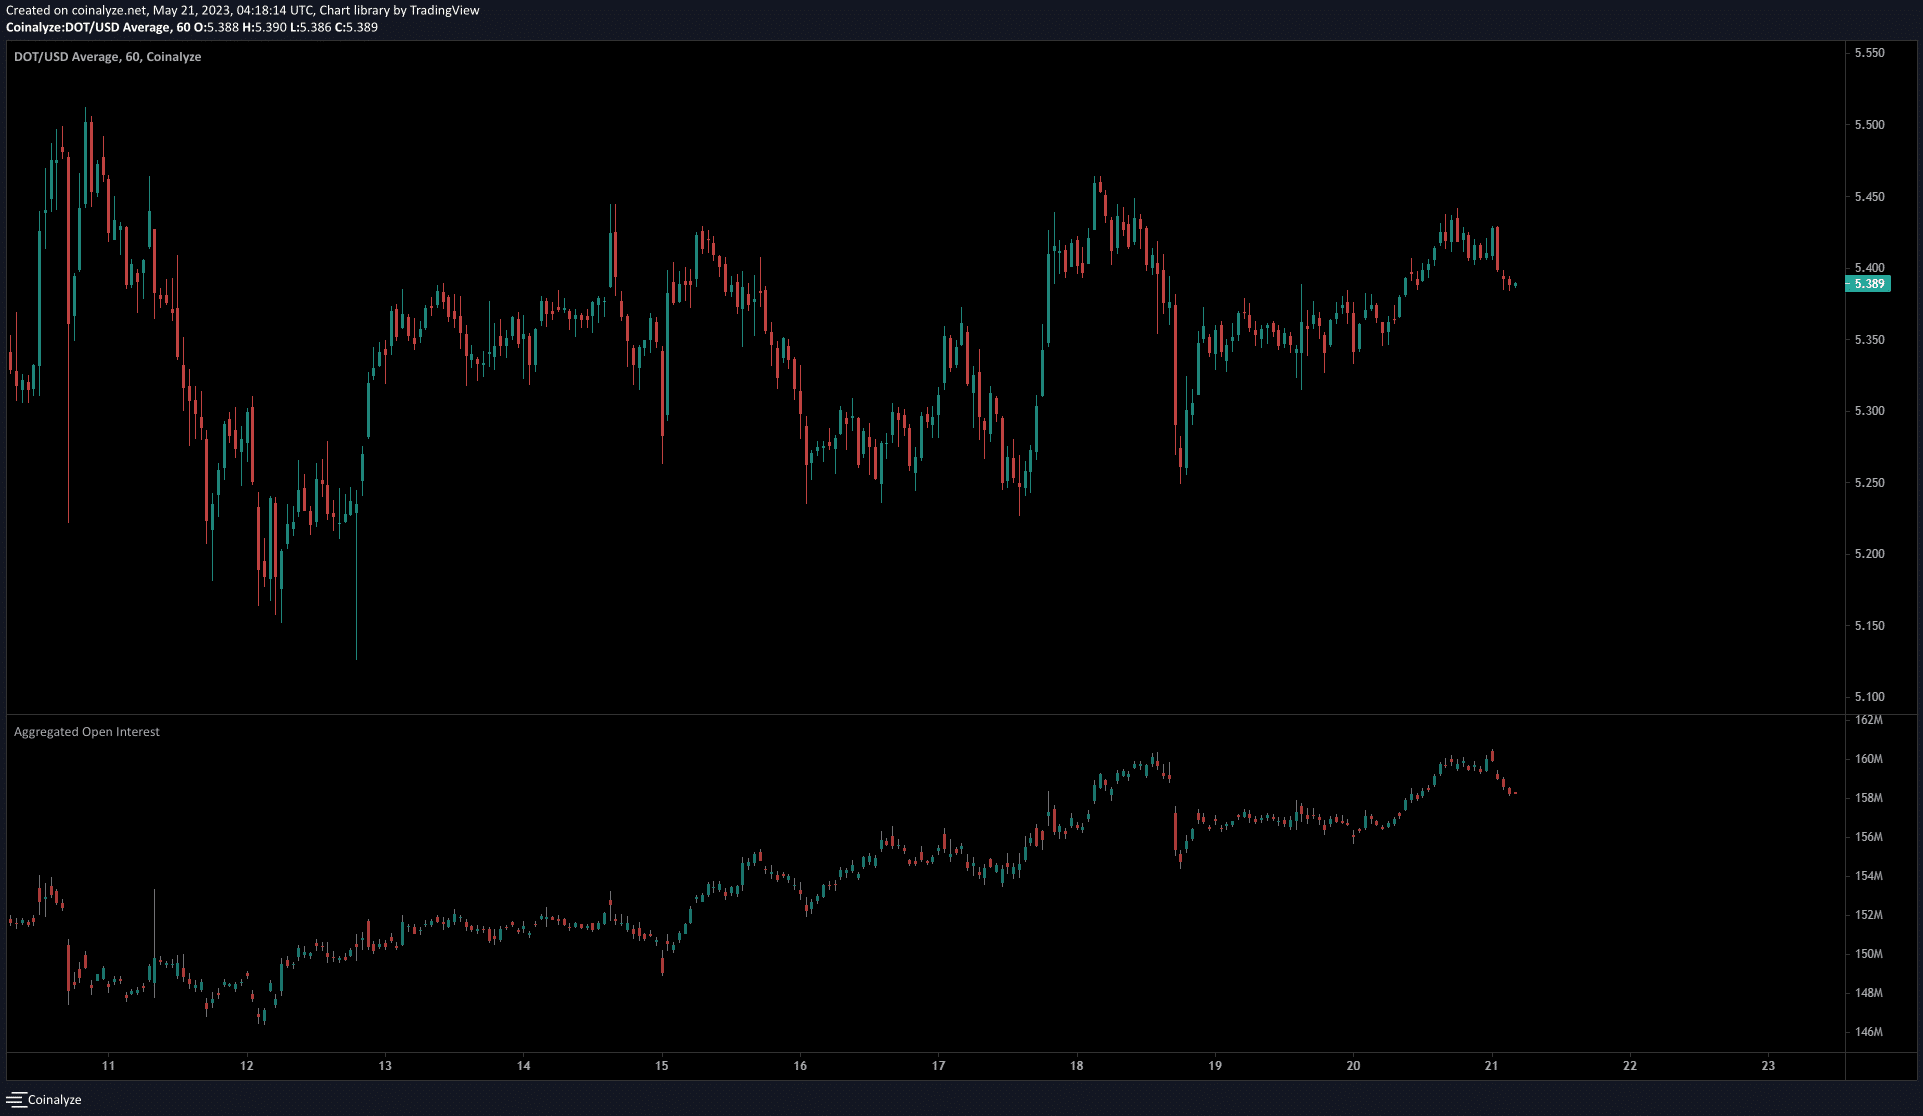
It was not all doom and gloom for Polkadot buyers. Since 12 May, Polkadot has climbed from $5.2 to $5.38, a 4.6% move northward. This was accompanied by an influx of $12 million in Open Interest in the past week.
This indicated that speculators were bullish during the small near-term bounces that DOT saw recently. Yet it was not enough to signal a reversal from $5.12 or that Polkadot would move toward the range highs. With Bitcoin unable to assail $27.8k resistance, DOT bulls must exercise caution.