Polkadot tests the $5 territory as support once again as…
Polkadot faced rejection at the lower timeframe resistance at $5.5, and neared the $5 support yet again.

Disclaimer: The information presented does not constitute financial, investment, trading, or other types of advice and is solely the writer’s opinion.
Polkadot [DOT] was trading at an important support level around the $5 area yet again. It was highlighted in a recent report that the $5.5 zone was densely populated by bears. These sellers were able to rebuff the bullish advance.
At the time of writing, Bitcoin [BTC] traded at $27k after the bulls managed to defend the $26.8k mark in an extended skirmish over the past 36 hours. Ethereum [ETH] was also able to hold on to a support area. Will this result in Polkadot climbing higher as well?
Strong short-term conviction saw DOT prices oscillate between range extremes
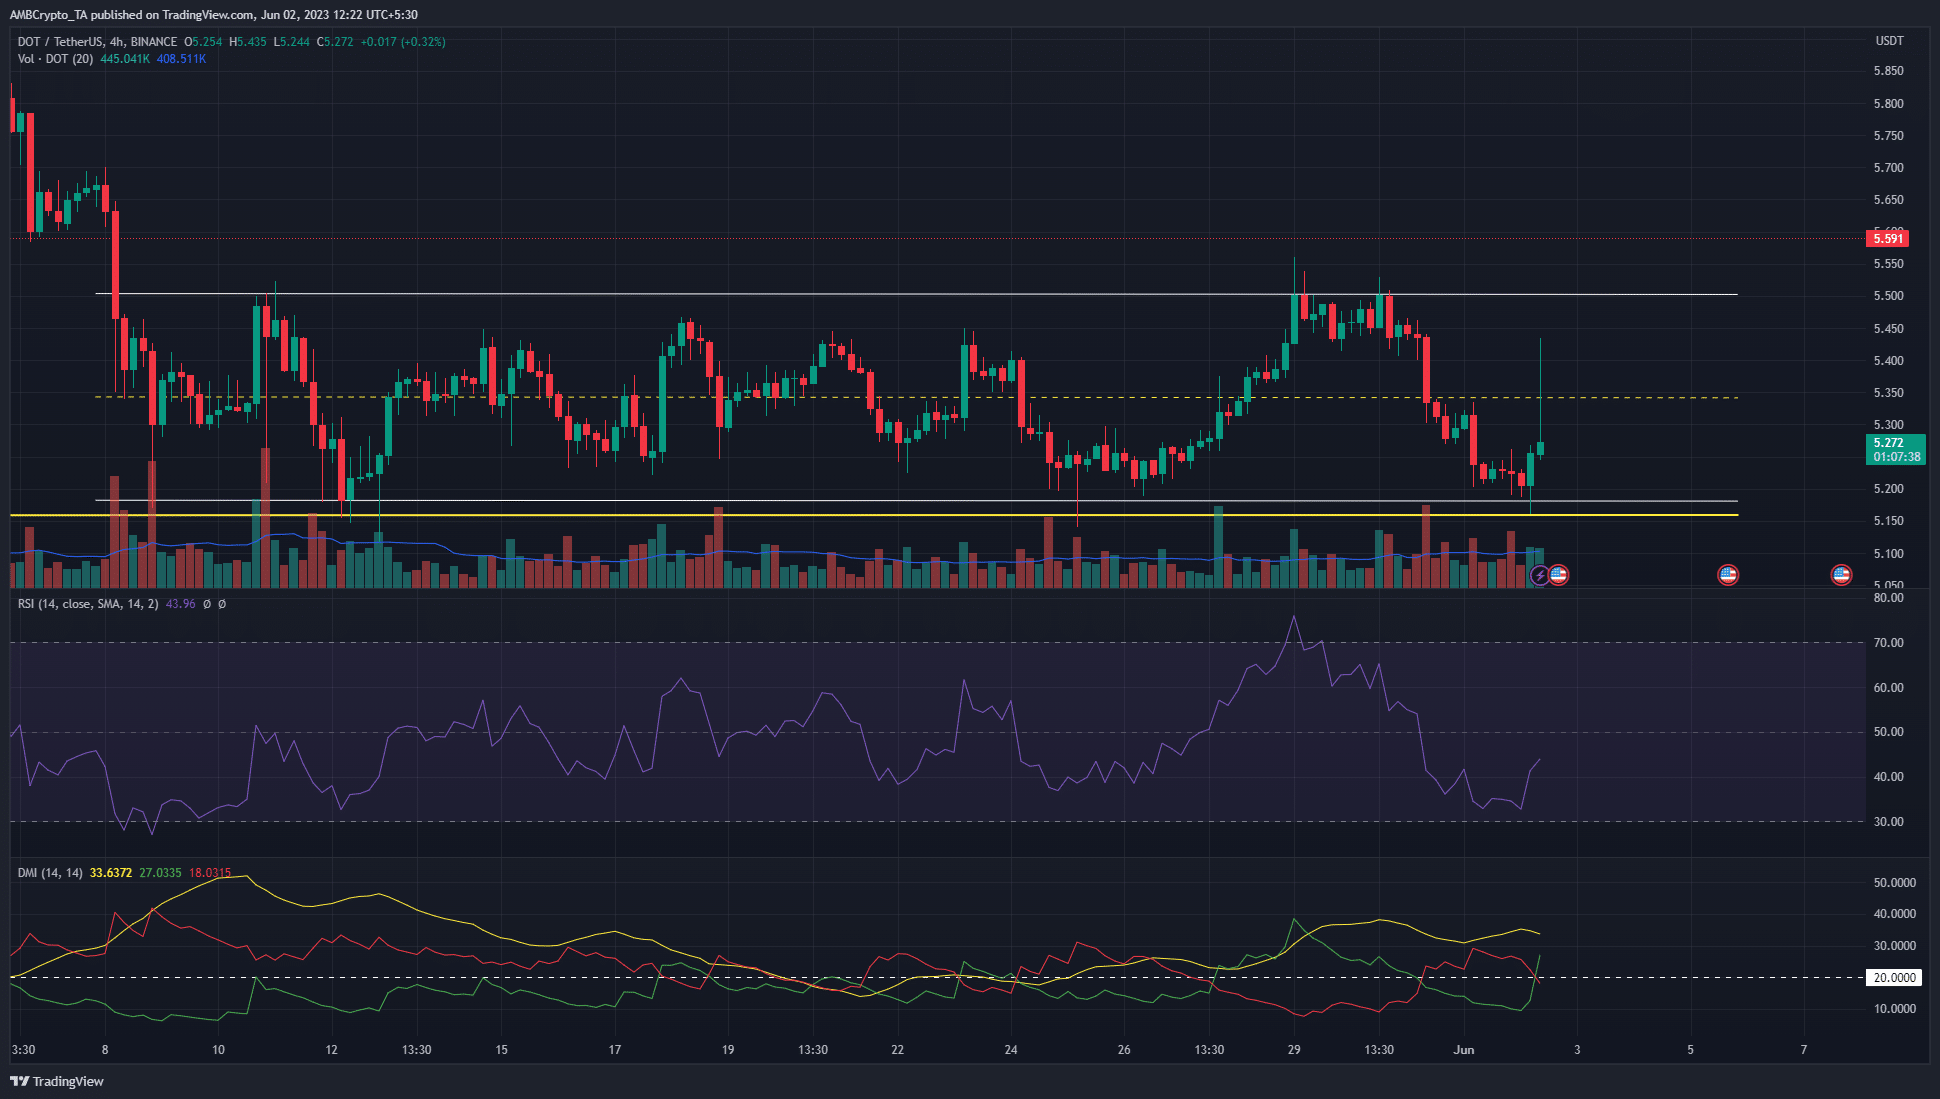
Since 8 May, Polkadot has traded within a range (white). This range extended from $5.18 to $5.5, with the mid-range mark at $5.34.
In the past three weeks of trading, the mid-range value has served as support and resistance. This added credibility to the range.
The range highlighted was a short-term one. On higher timeframe charts it was observed that DOT has traded between the $5.17 and $7 levels since March.
Therefore, the $5.15 area was not just short-term support but extended back to early March.
Since 25 May, the ADX (yellow) on the DMI indicator has been above the 20 mark. This showed a strong trend in progress, but the DOT price action showed a rangebound asset.
The resolution of this seeming disagreement comes with the +DI and -DI values and their crossovers.
Their crossovers in the past week showed bearishness up to 26 May, then bullish momentum took charge from 27 May to 31 May.
At the time of writing, the bounce from $5.16 to $5.3 saw the +DI cross above the -DI yet again, showing an uptrend. Yet, the RSI remained below neutral 50.
The market structure was also bearish, and a session close above $5.33 would be necessary to change this.
The prices were quick to rebound after a move into the range lows

The sentiment was strongly bearish on 1 June. When DOT prices continued to dip from $5.25 to $5.17, the Open Interest surged higher.
It went from $151 million to $157 million, which showed a small number of short sellers were eager to join the fray.
Read Polkadot’s [DOT] Price Prediction 2023-24
However, this was accompanied by a rise in the spot CVD, which indicated demand behind the asset. When Polkadot began to bounce in recent hours, the OI followed it upward.
This showed that although short sellers were seen near the $5.2 mark, they were likely overpowered by the short-term bulls upon the bounce.


