Polkadot, Tron, Ethereum Classic Price Analysis: 22 February

Polkadot showed signs of bearishness in the short-term and could dip beneath the $38 level once more. Tron showed that its previous bullish momentum had weakened, and Ethereum Classic was in a phase of consolidation over the past few days.
Polkadot [DOT]
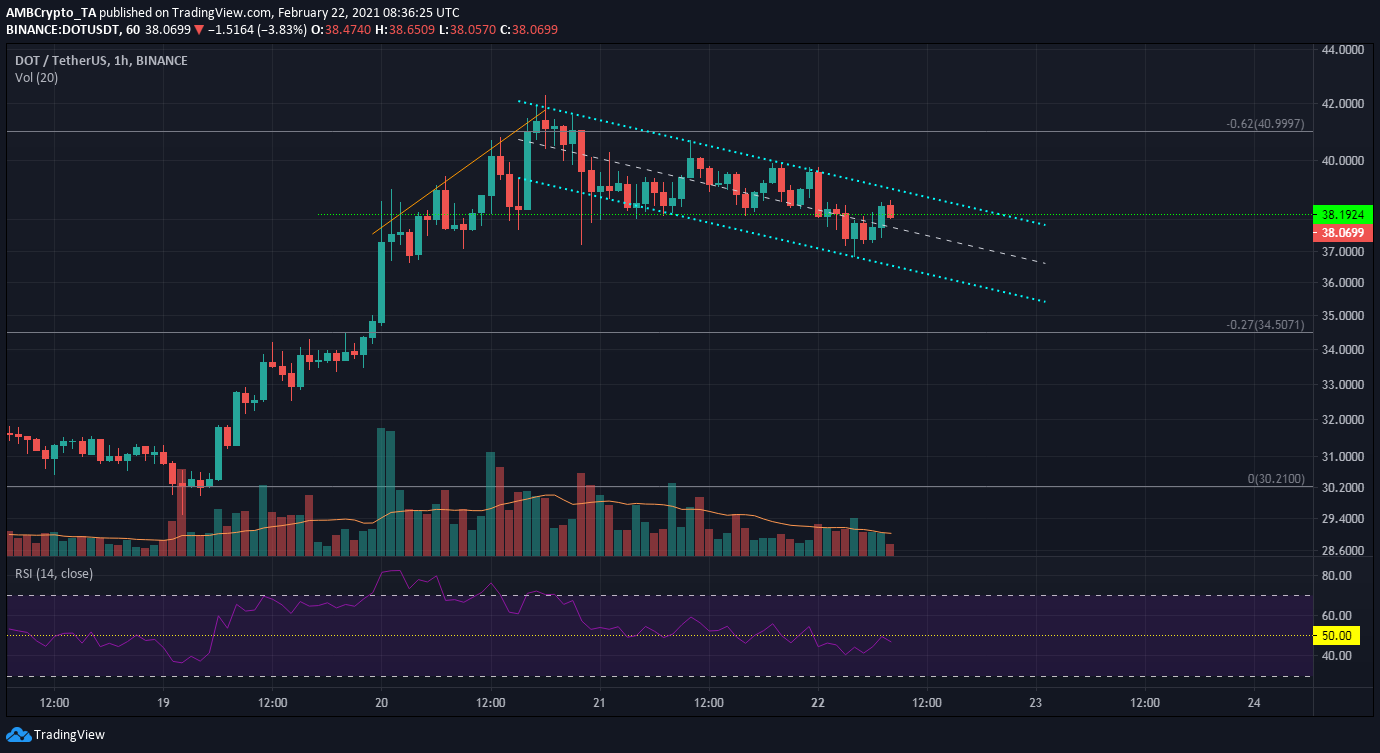
The trading volume was steadily trending lower on the charts over the past couple of days with the price moving within a descending channel. This channel signals short-term bearish pressure and the RSI slipped beneath neutral 50 and retested it as support to indicate a downtrend in progress.
The pattern is a bullish reversal pattern, and a breakout to the upside of this channel will see DOT climb back toward $42.
Over the next few hours, another dip below $38 can be expected.
Tron [TRX]
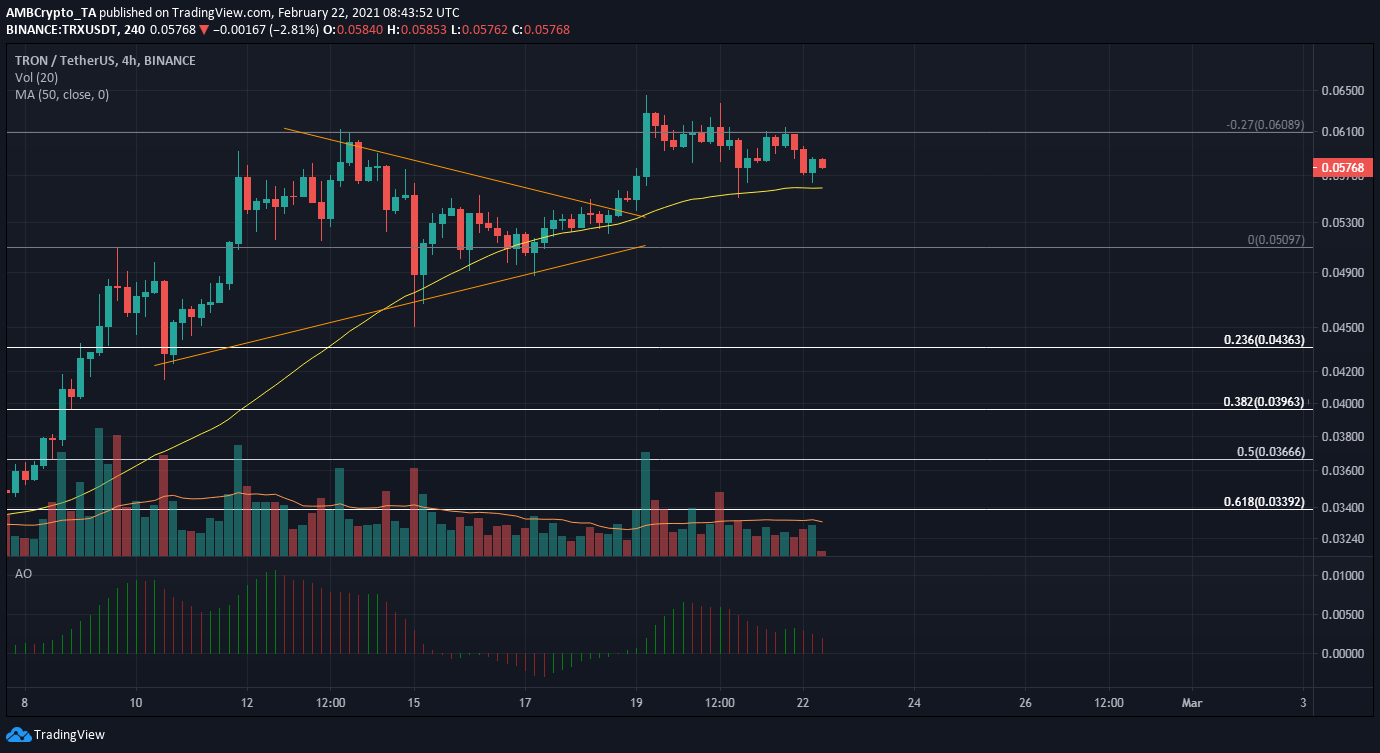
TRX formed a symmetrical triangle (orange) and broke out to the upside. It was halted at the 27% Fibonacci extension level, and has struggled to rise above $0.062 over the past few days.
The Awesome Oscillator formed a lower peak and registered red bars over the past few trading sessions, indicating dwindling bullish momentum. This sell signal could see TRX drop beneath its 50 SMA (yellow), which has acted as support since late January.
A move in either direction can occur- TRX has seen some strong rallies in the past month after brief intervals of sideways trading. Heavy trading volume, alongside the price reaction at moving averages, can be used to gauge the strength of the next move for TRX.
Ethereum Classic [ETC]
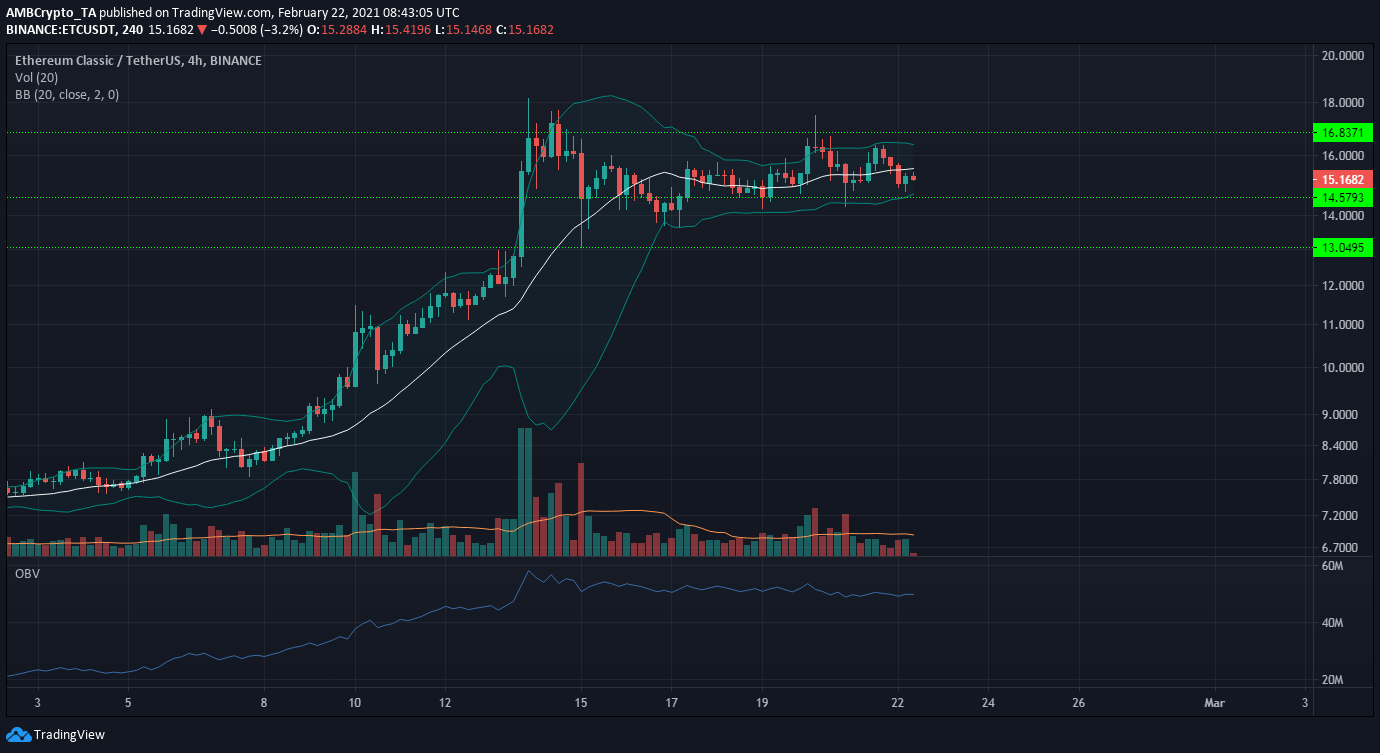
The Bollinger bands tightened around the price over the past few days. The OBV also showed an equilibrium between buyers and sellers, with the selling volume being slightly higher in the same time period.
Important levels to watch are $14.57, which ETC was trading above at the time of writing. Above, the $16.8 – $17.2 has acted as a region of supply, and below $14.6, another level of support at $13 is seen.