Polkadot, TRON, Loopring Price Analysis: 24 May

Bitcoin rose to $30.6k the previous day but slumped to the $29k mark, as the crypto market remained divided in its longer-term bias. The past few days have seen some of the altcoins, such as Polkadot and Loopring, rally. It remains to be seen if the demand and the short-term uptrend can continue.
Polkadot (DOT)
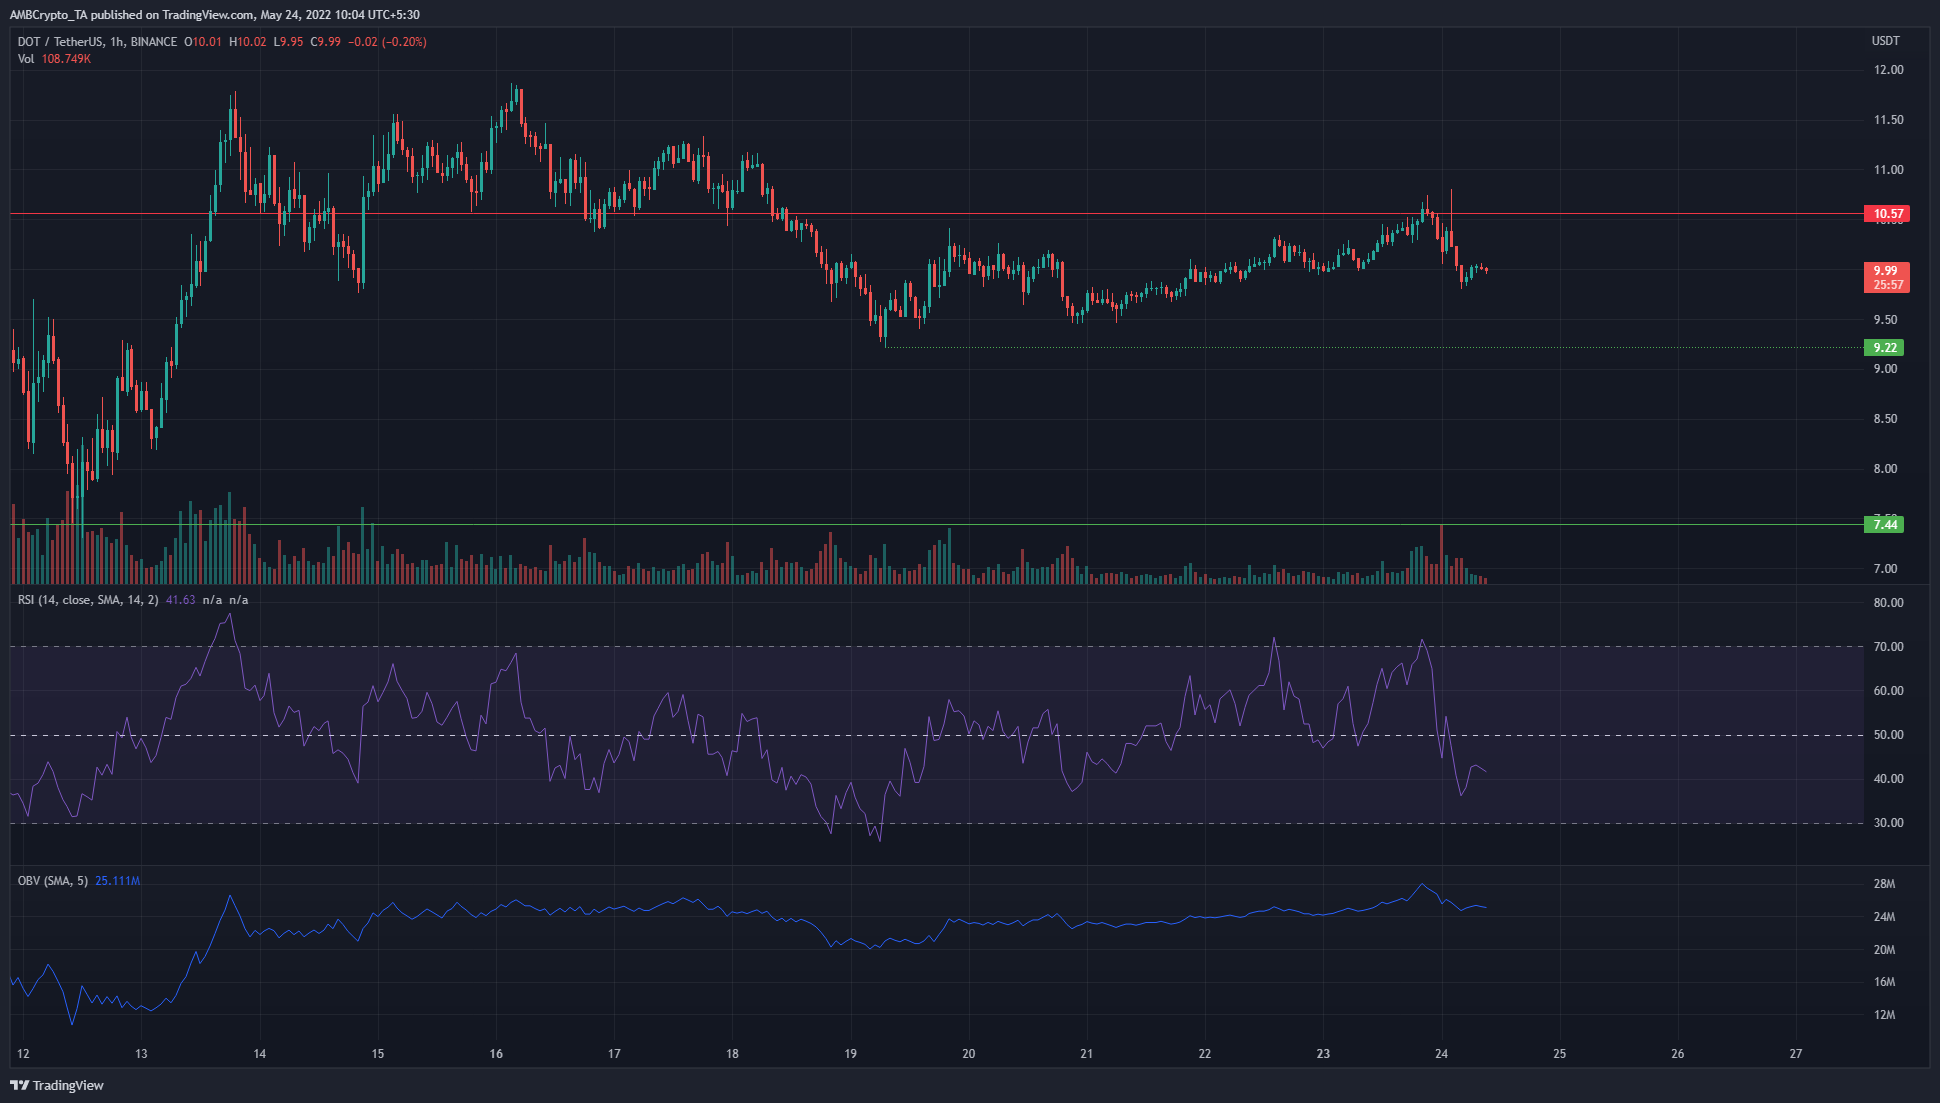
In the past ten days, DOT managed to climb past the $10.57 resistance level and even defended it as support for a few days before slipping back beneath it. The price registered a swing low at $9.22, marking a short-term support level for bulls to defend.
Over the past four days, DOT climbed slowly from the $9.22 mark to retest $10.57 as resistance once again. The buyers were rebuffed, and the RSI slipped back beneath the neutral 50 line to stand at 41.63 to show weak bearish momentum at press time.
The OBV has been climbing slowly in the past few days, which indicated a push toward the $10.57 level could occur soon, so long as $9.22 remains a support level.
TRON (TRX)
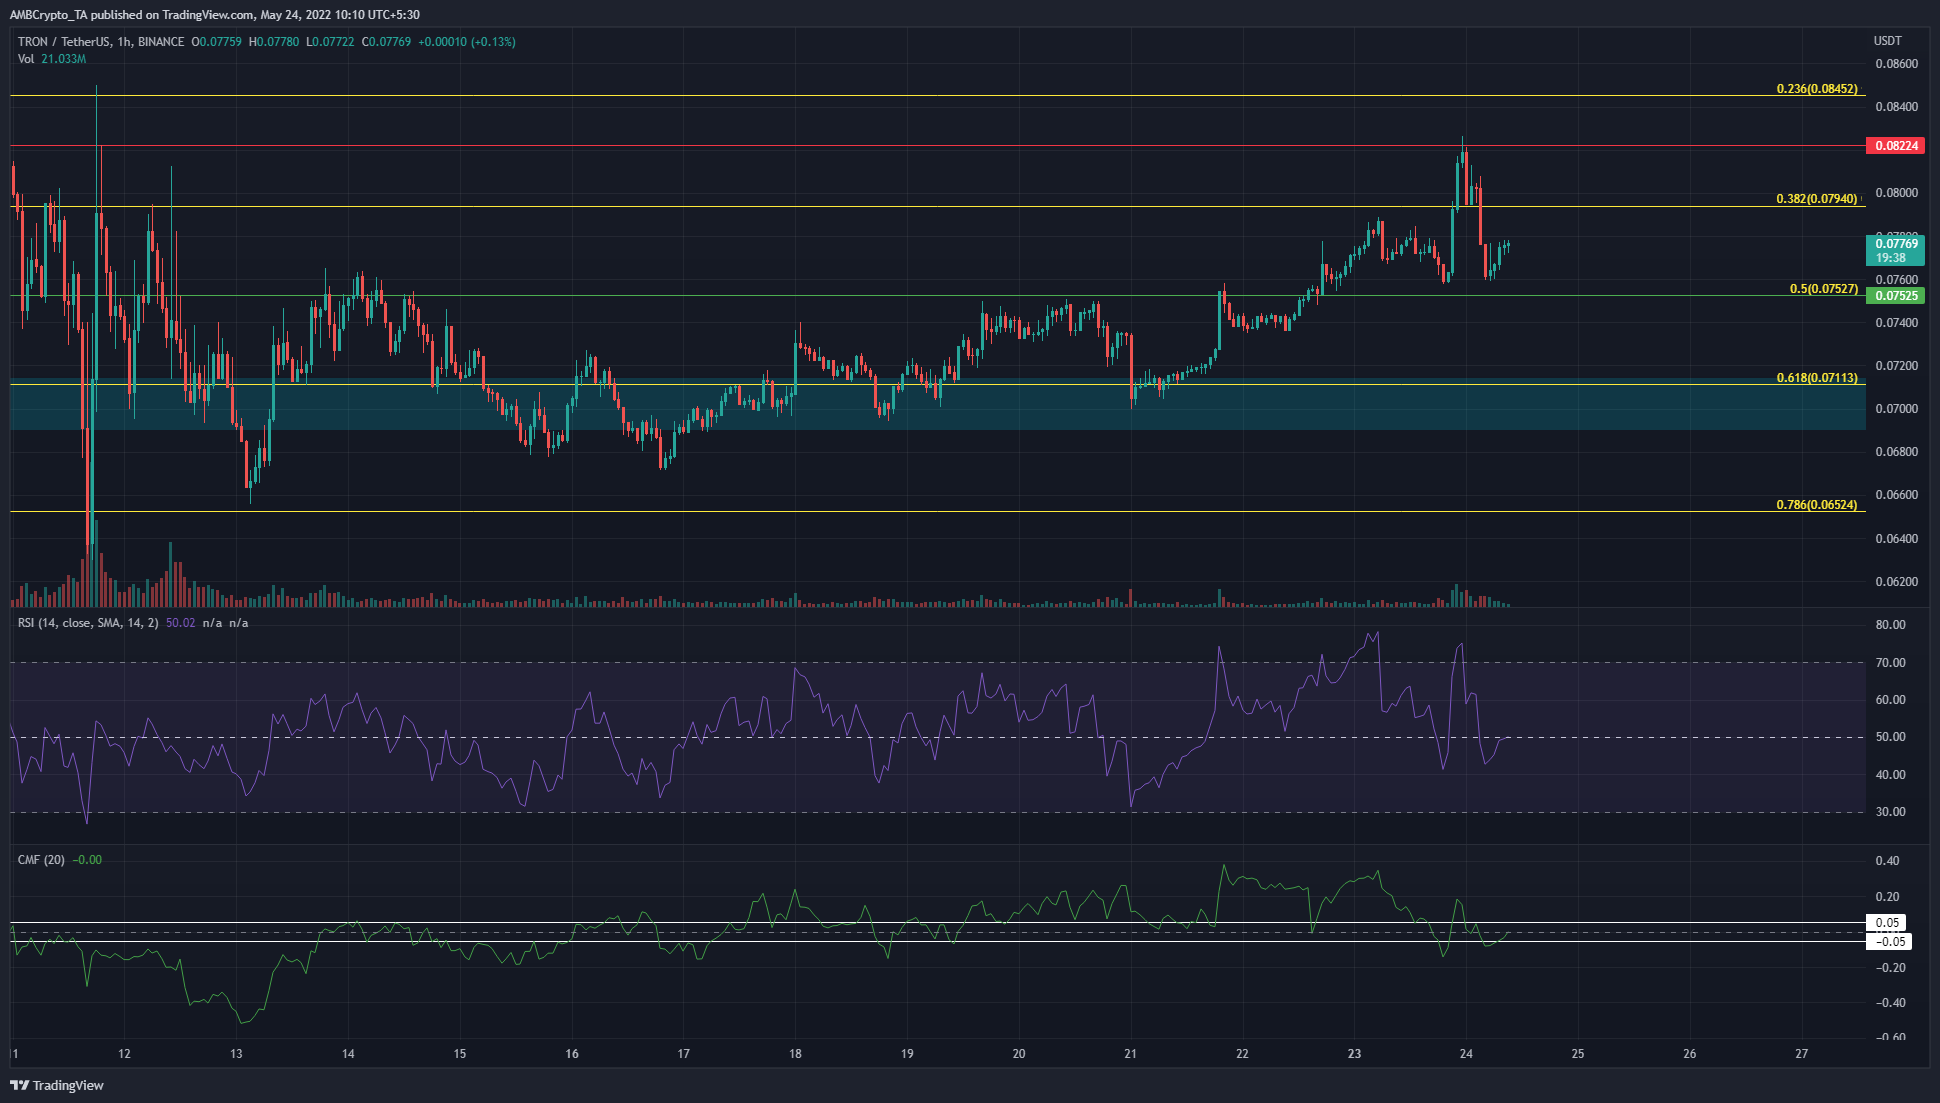
Earlier in May TRX was extremely volatile as it rallied from $0.062 to $0.092 and then retreated to $0.065, all within twelve days. In the past week, the price has been a little less volatile as it rallied from the $0.07 area of demand.
The $0.082 level of resistance remained unbroken as the price saw rejection the previous day, while the $0.076 area has held as a support zone. The RSI was at 50 at the time of writing, which meant momentum did not favor either bulls or the bears. However, the market structure on lower timeframes was bullish for TRX. In support of this, the CMF has been above the +0.05 mark to show that steady, significant capital flow was directed into the market by buyers.
Loopring (LRC)
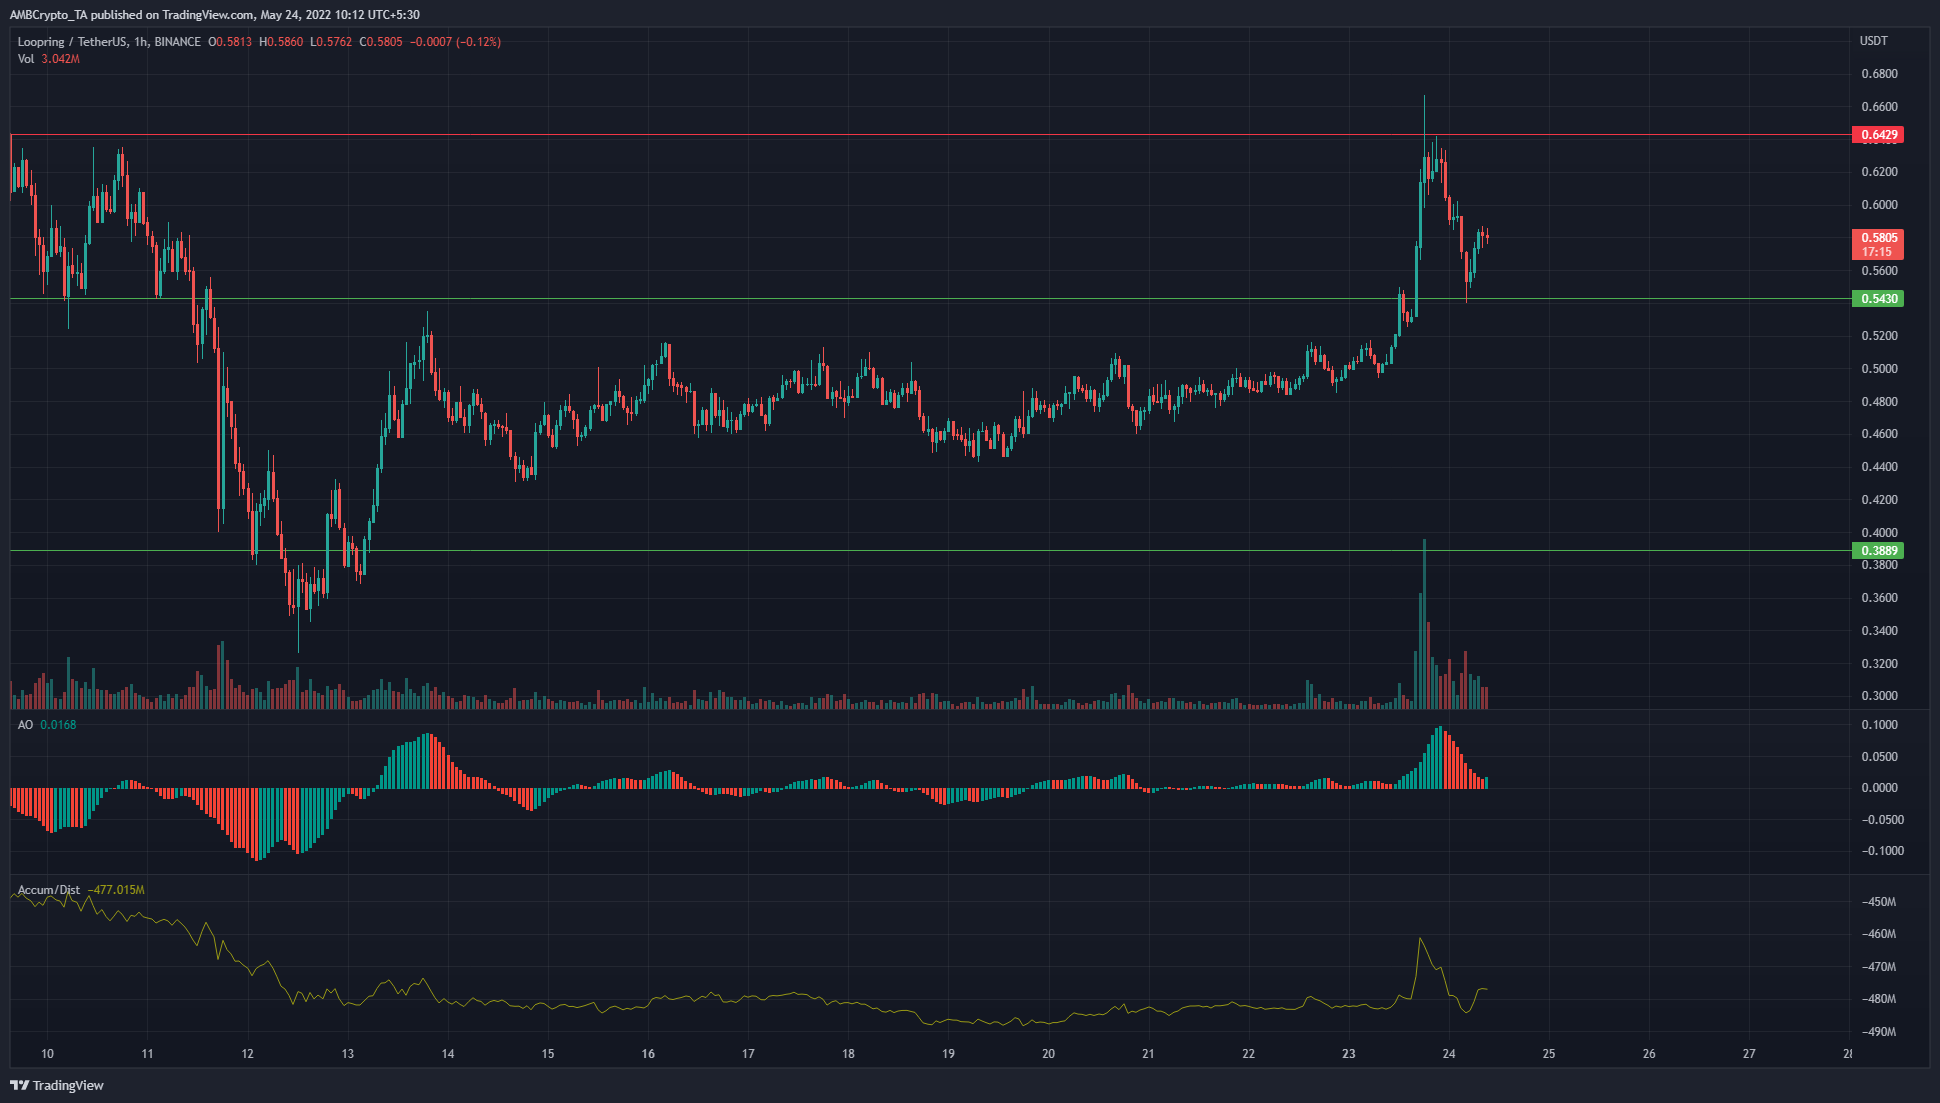
LRC is another coin with a bullish outlook on the shorter timeframes, as the price has made a series of higher lows and higher highs after its drop to $0.34 on 12 May. At press time, the price had broken past the $0.54 level to test the $0.64 as resistance before retesting $0.54 to confirm it as a support level.
The Awesome Oscillator saw a large spike upwards to reflect the bullish momentum and continued to stay above the zero line despite the pullback. This showed that the bulls still had momentum on their side. However, the A/D was less conclusive, as it did not show strong evidence of accumulation in the past week.


![Binance coin [BNB]](https://ambcrypto.com/wp-content/uploads/2025/05/Lennox-4-1-400x240.png)


