
- Though dev activity dropped, Polkadot’s network activity hiked on the charts
- A trend reversal could be on the cards for DOT’s price action
Polkadot [DOT] has been renowned for having robust development activity consistently over the years. However, as per recent data, other blockchains like Ethereum [ETH] and BNB Chain have emerged to overtake its levels over the last few days. While this shift happened, DOT’s price action turned bearish on the charts.
Polkadot’s development activity drops
Coin98 Analytics recently shared a tweet mentioning a list of blockchains ranked in terms of their development activity. As per the tweet, Polkadot registered 827 developers last week, with the blockchain witnessing over 5000 weekly code commits.
Though the number by itself wasn’t low, it was lower than other blockchains. For instance, ETH had more than 2000 weekly developers who executed over 19,000 commits. Polkadot was also behind BNB Chain, whose weekly commits exceeded 6,000.
Other blockchains that outshined DOT were Polygon [MATIC] and Optimism [OP], whose weekly commits stood at 6,300 and 5,200, respectively.
AMBCrypto’s analysis of Santiment’s data also revealed a similar story. We found that DOT’s development activity dropped sharply over the last seven days. However, despite the drop in dev activity, the blockchain’s dev activity contributor count spiked multiple times last week.
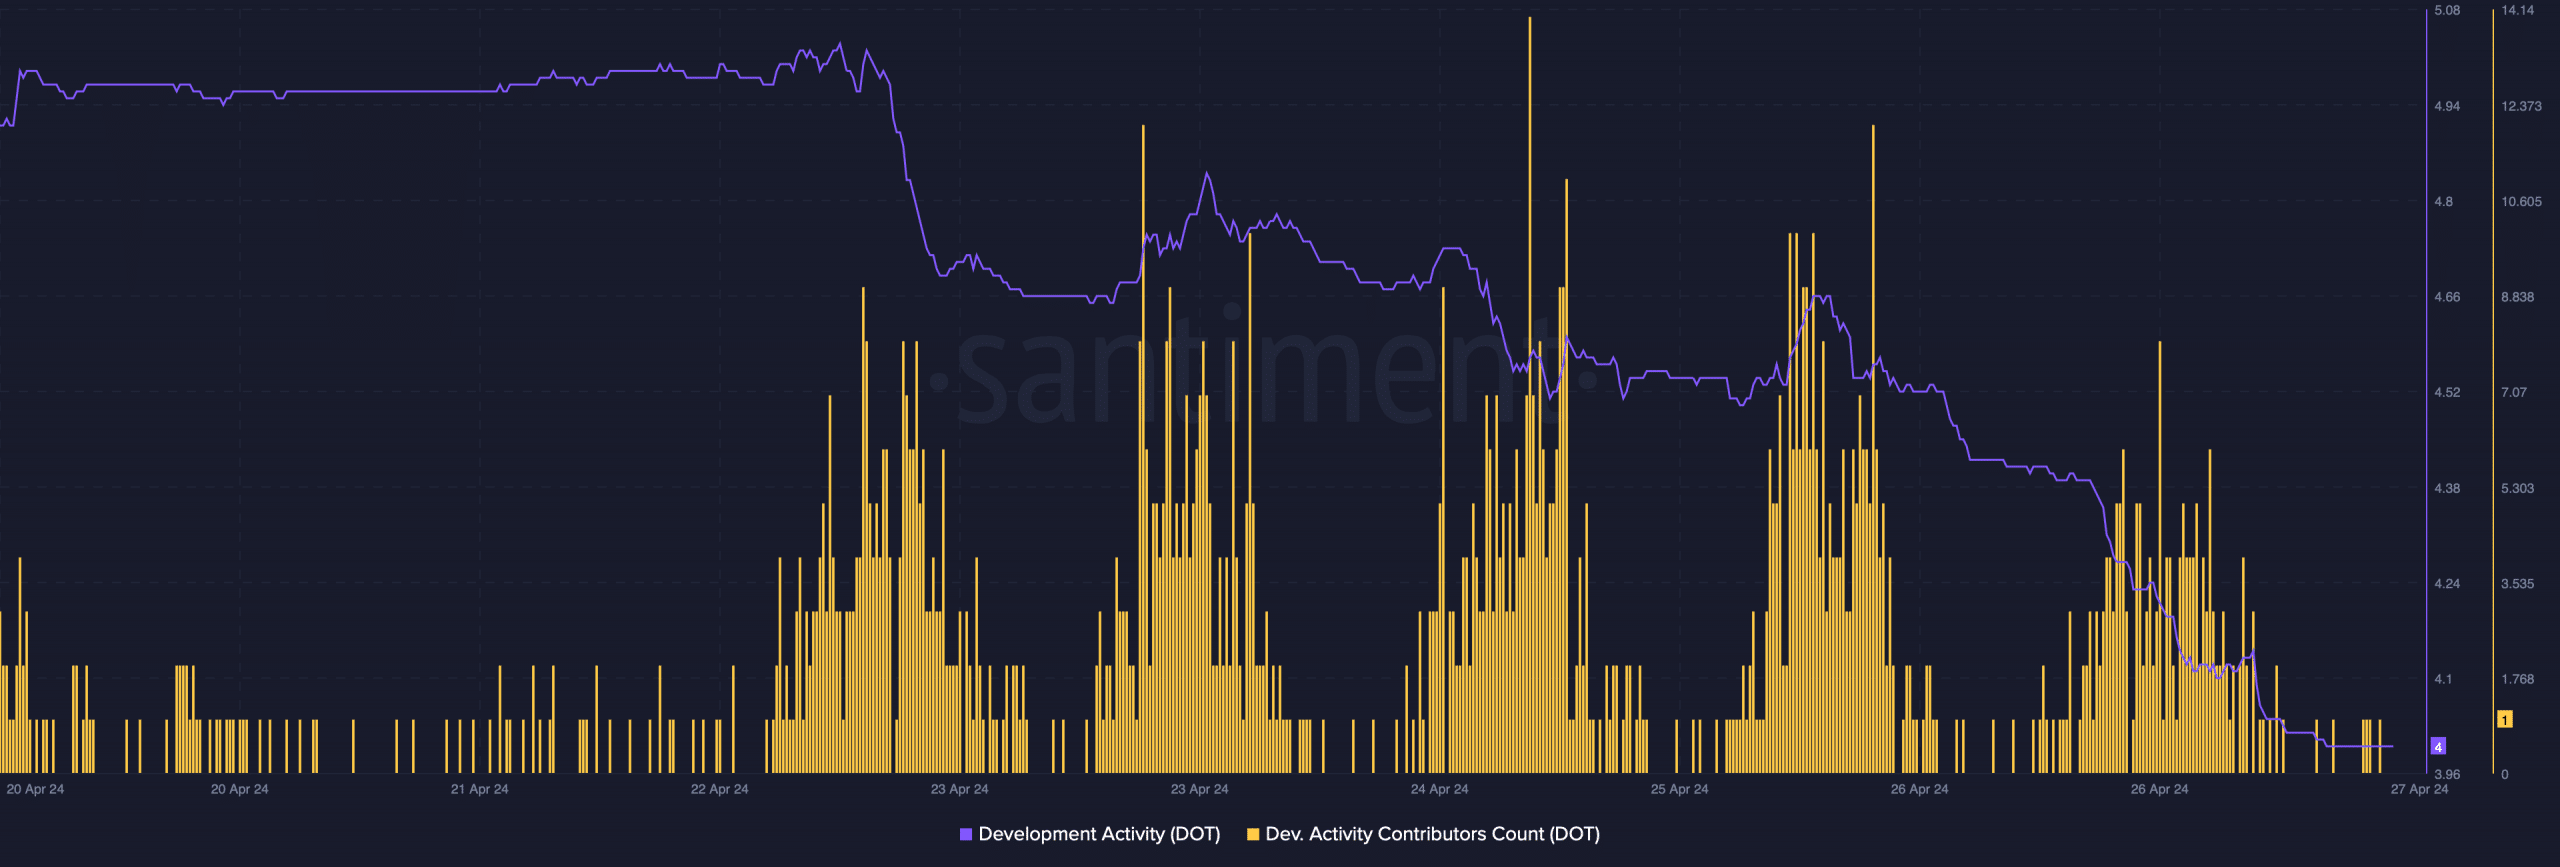
Source: Santiment
Here, it is interesting to note that while the blockchain’s dev activity fell, its network activity registered a massive spike last week.
AMBCrypto’s look at Artemis’ data revealed that after several days of dormancy, DOT’s daily active addresses shot up considerably on 24 April. Thanks to the rise in active addresses, its daily transaction count also followed a similar trend.

Source: Artemis
Bears are attacking DOT
In the meantime, Polkadot bears buckled up as the token’s price dipped on the charts. According to CoinMarketCap, DOT lost more than 1.5% of its value in the last seven days. In fact, in the last 24 hours alone, the token’s value dipped by 2%. At press time, DOT was trading at $6.70 with a market capitalization of over $9.6 billion.
DOT’s funding rate has risen over the last few days too. This is a bearish development as prices tend to move in the opposite direction from the funding rate.
Nonetheless, Polkadot’s open interest also went down. A decline in the metric is a sign that chances of the ongoing market trend changing are high.
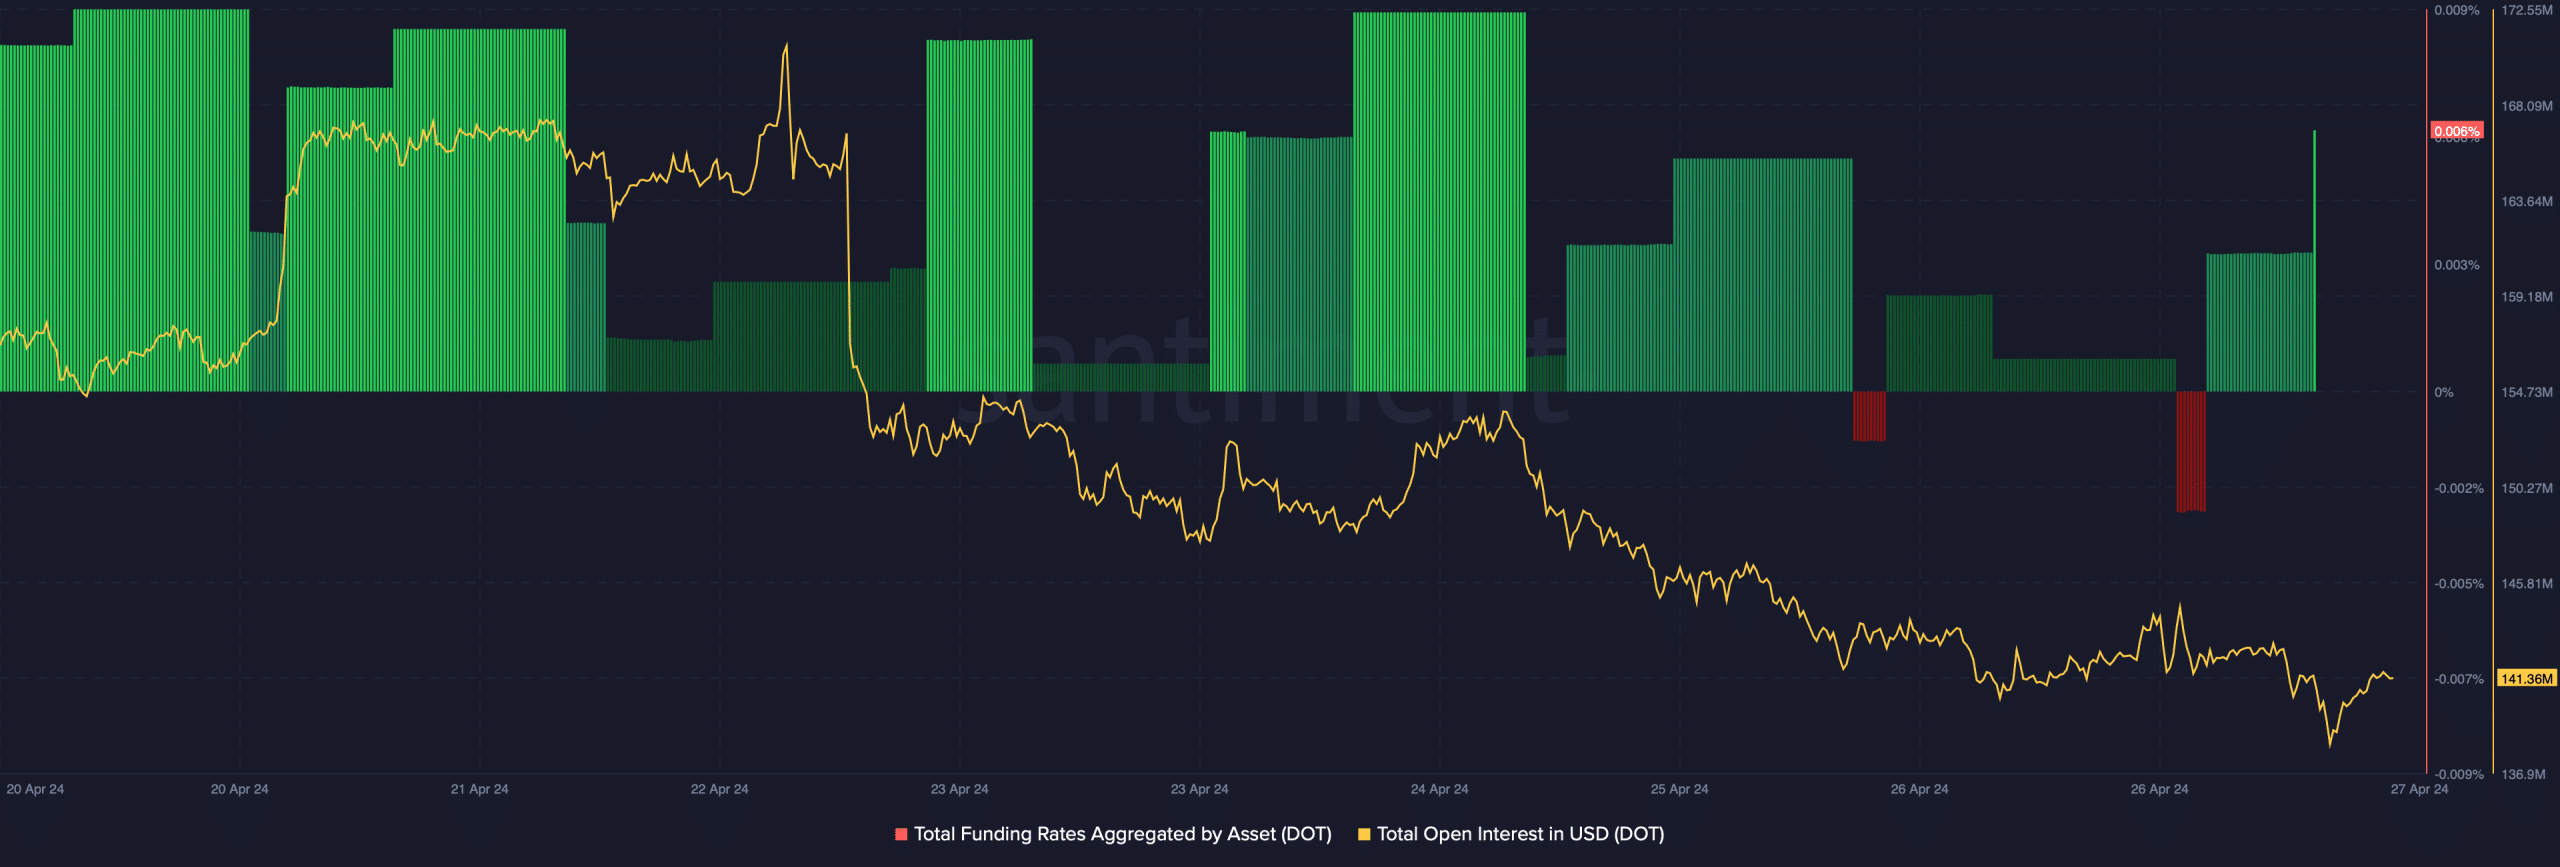
Source: Santiment
Read Polkadot’s [DOT] Price Prediction 2024-25
DOT’s Money Flow Index (MFI) also registered a sharp uptick and was heading further above the neutral level, suggesting a possible price hike.
Finally, as per the Bollinger Bands, DOT’s price was resting under its 20-day Simple Moving Average (SMA). A successful breakout above that level could result in a fresh bull run for the altcoin on the charts.
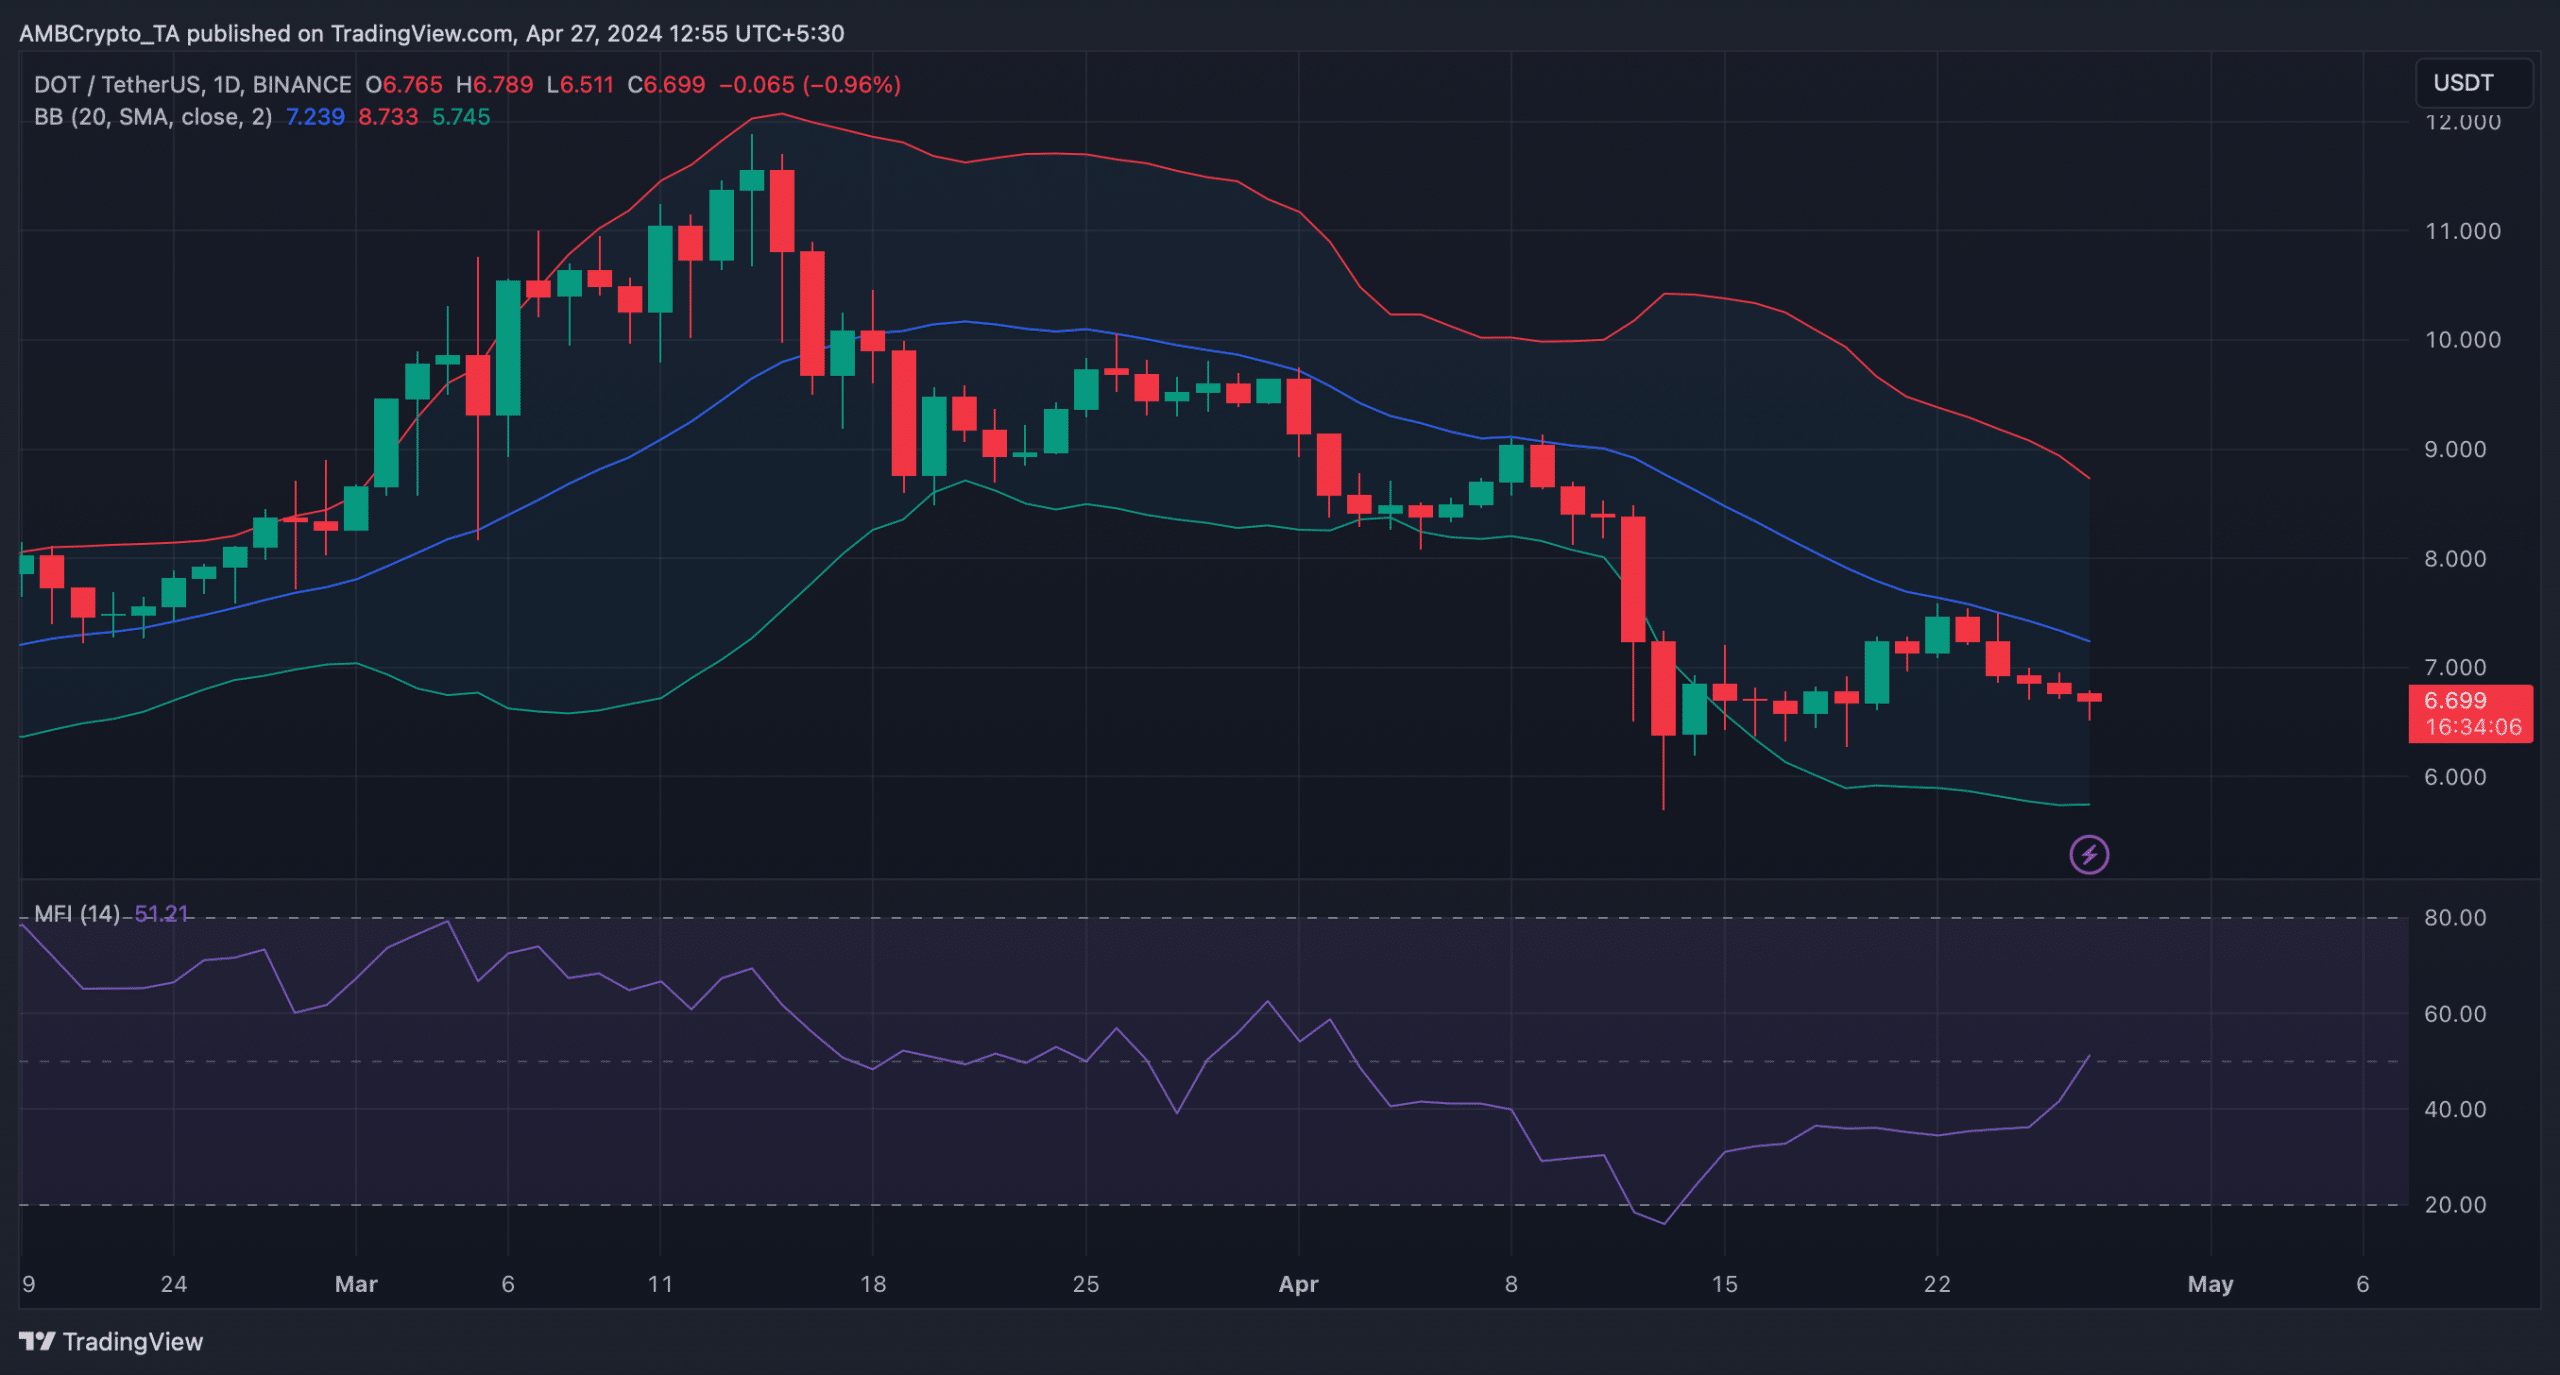
Source: TradingView