Polkadot: Watch out for DOT’s 12% bounce if THIS level is breached
Polkadot has a short-term bullish bias provided it can move beyond the $4.62 resistance.

- Polkadot has some potential for a rally toward $5.25.
- Any further gains were unclear, but the lack of overwhelming selling volume was a notable factor.
Polkadot’s [DOT] 1-day price chart showed that the bears remained dominant.
Like many other altcoins, DOT has also erased almost all the gains it made since November. The volume indicator gave some hope to new buyers, but holders experiencing losses have little reason to cheer.
The importance of $4.62 for Polkadot bulls
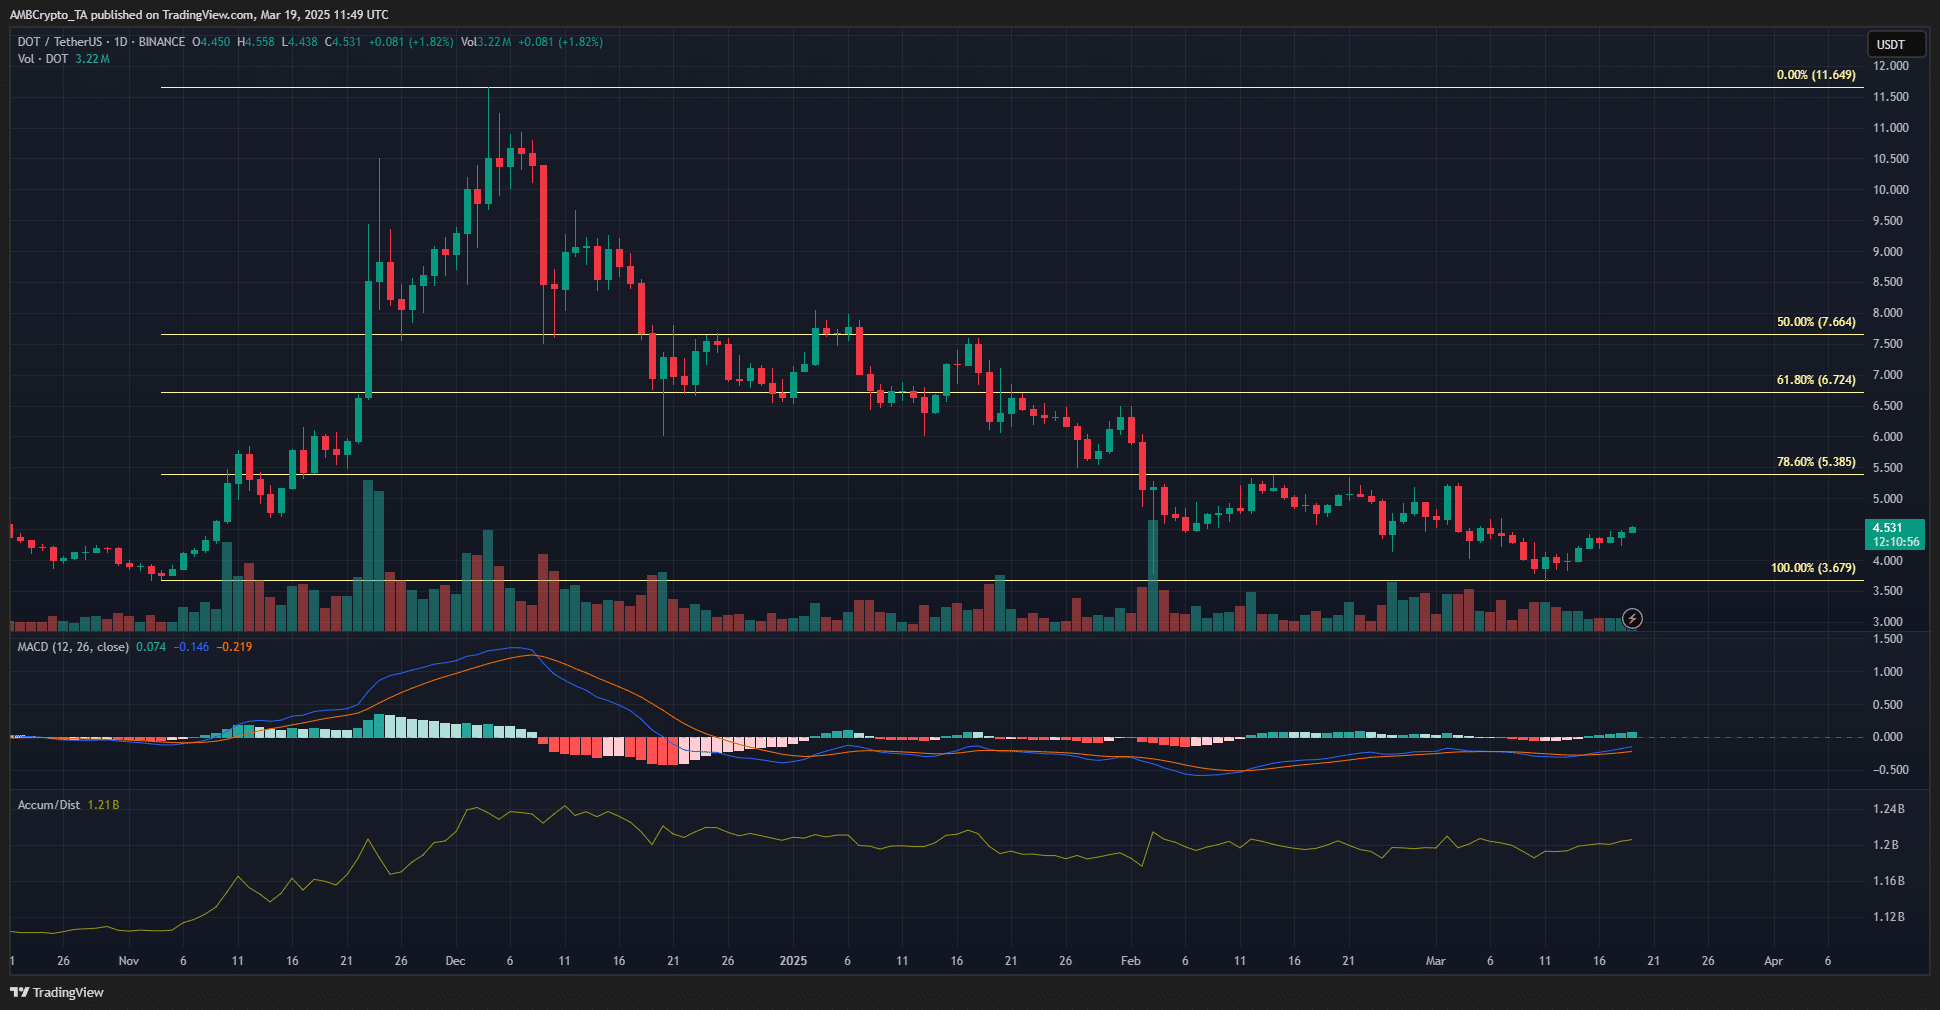
The DOT market structure on the daily was bearish. The swing high at $5.25 was the level for the price to beat before it could make a market structure break.
There was some local resistance at the $4.5 region that could oppose the buyers.
The MACD formed a bullish crossover, but it was still below the zero line, showing the momentum was predominantly bearish. On the other hand, the A/D indicator has made higher lows since February.
Unlike the price action of Polkadot, the A/D indicator was slowly trending higher, although it hasn’t breached the December highs.
This was a slight encouragement. It showed that the trading volume during the heavy retracement was lesser than it had been during the volume surge on the way up.
The flip side was that many of the DOT buyers from that rally were facing losses, and could be eager to get out at breakeven.
Therefore, breaching the resistances to the north such as $5.38 and $6.72 could be a difficult battle.
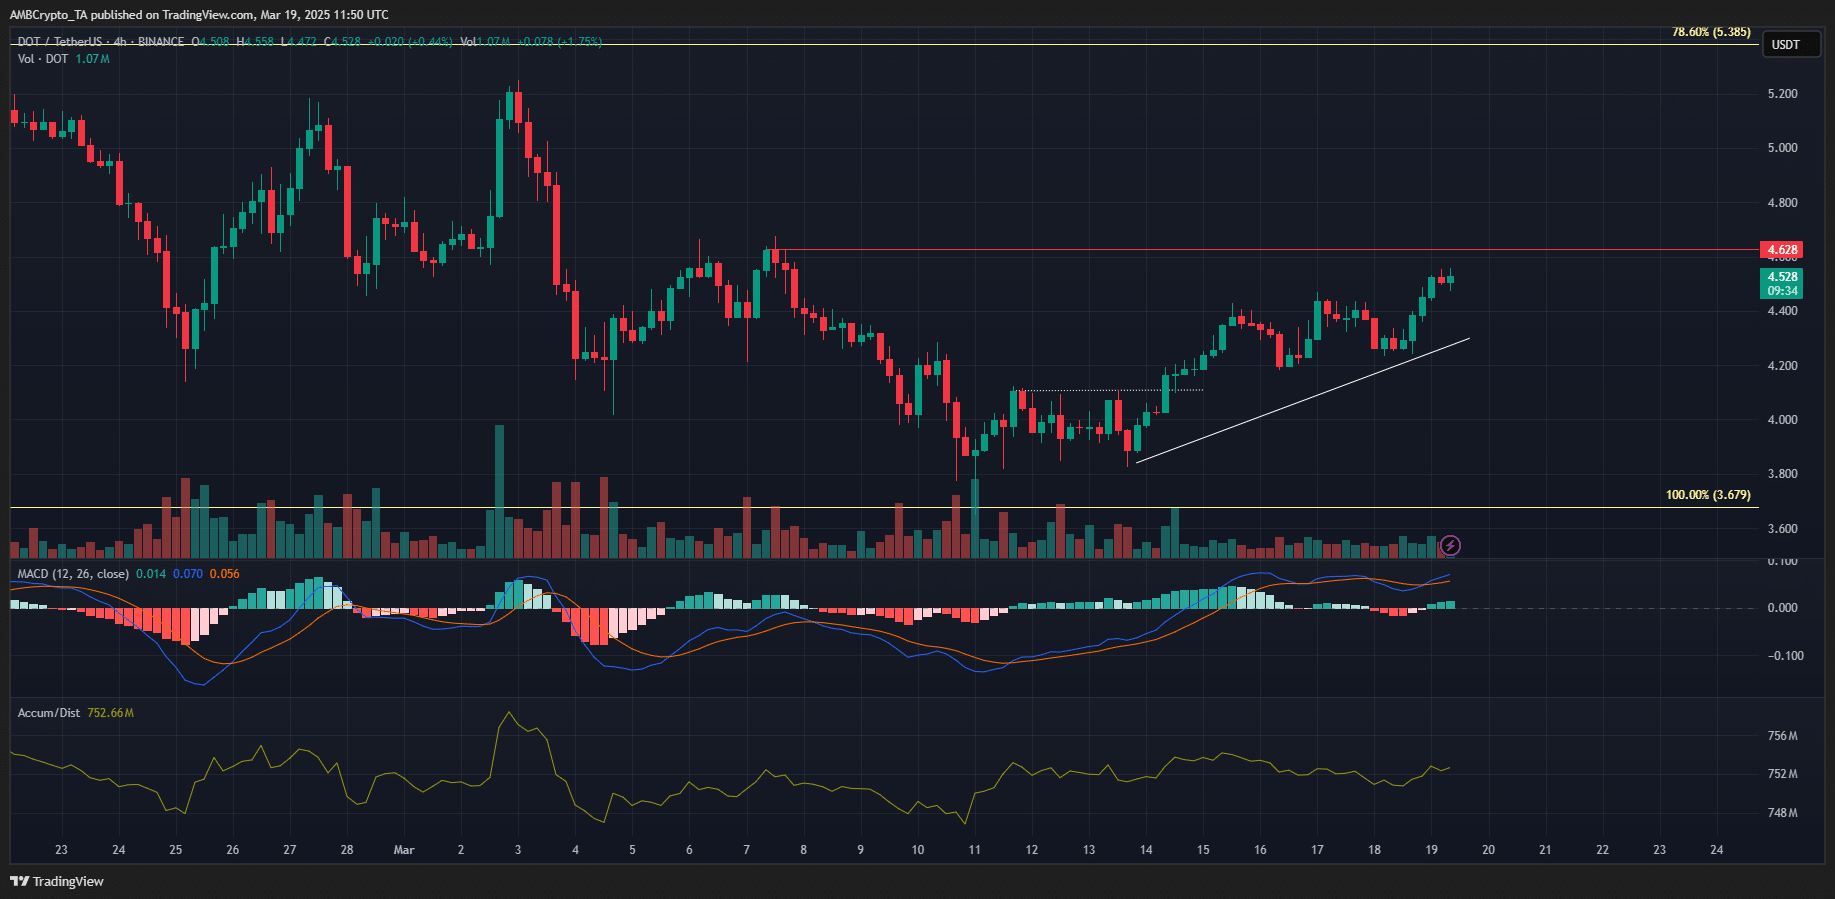
On the 4-hour chart, things looked slightly more encouraging for the bulls. The sub-structure was bullish and Polkadot has made higher lows over the past five days. The key level to breach on this timeframe was at $4.62.
A move beyond this level would shift the 4-hour swing structure bullishly. However, traders must remember that the daily structure was bearish.
A move beyond $4.62 might not initiate a sizeable rally, but it could still be profitable if it continued to climb 13% to reach the $5.25 level.
Disclaimer: The information presented does not constitute financial, investment, trading, or other types of advice and is solely the writer’s opinion