Polkadot: Watch out for these levels before placing long bets

Disclaimer: The findings of the following analysis are the sole opinions of the writer and should not be considered investment advice.
Polkadot’s [DOT] efforts to alter the long-term bearish trend took a toll after an expected rising wedge breakdown. The $9.4-$9.6 resistance range rekindled the selling inclinations.
Also, this bearish pull has invoked a bearish crossover on the 20/50/200 EMA. Any rebound from the $7 zone could help the alt ease the selling pressure. At press time, DOT was trading at $7.46, down by 11.96% in the last 24 hours.
DOT 4-hour Chart

Since dropping toward its 18-month low on 13 July, DOT buyers stepped in to propel a bull run. This recovery entailed a rising wedge that slammed into the $9.6-resistance.
The resultant breakdown pulled the coin below its 20/50/200 EMA while registering an over 24% decline over the last week. Also, with the recent uptick in selling volumes, the bears have only reiterated their intentions of undermining the near-term buying edge.
Given the possibility of a bounce-back from the $7-mark support zone, DOT could recuperate its buying pressure in the coming sessions. In such a case, traders/investors need to look for a close above the $7.5 mark.
Potential targets would lie near the $8-$8.3 range. An inability to break above the $7.5 level could provoke a dull phase on the chart.
Rationale
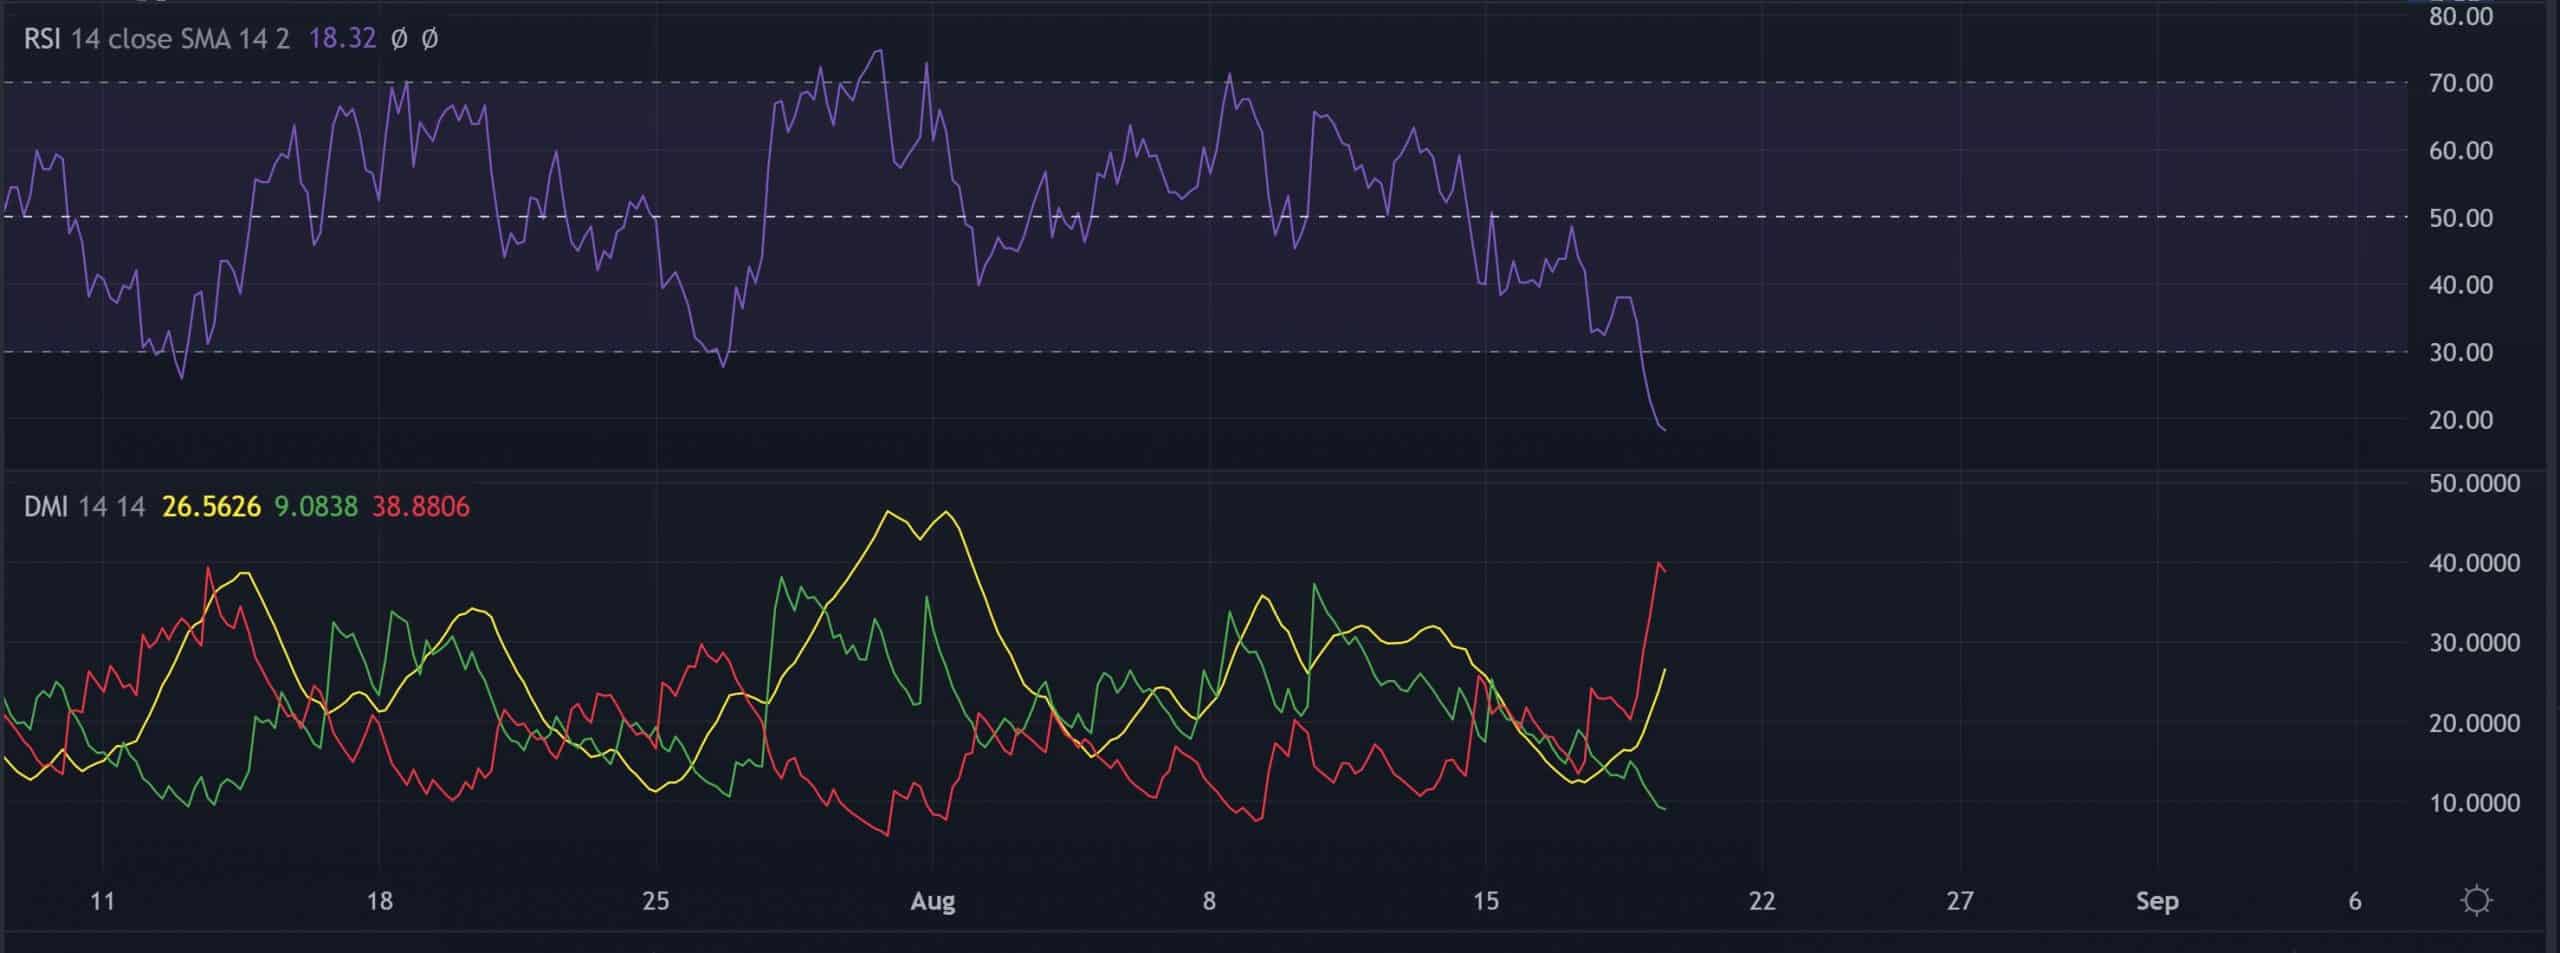
The Relative Strength Index (RSI) plunged deep into the oversold region after declining below the 30-mark threshold. A potential revival in the coming days could give the buyers a much-needed push to test the $8 zone.
The -DI saw an exponential jump as it exhibited a visible bearish edge. The current overstretched readings hint at a plausible near-term reversal. Also, the ADX displayed an increasing strength of the directional trend.
Conclusion
In view of the oversold readings on the indicators, the bulls would aim to recoup their forces. But the death cross on the EMAs would continue posing recovery hurdles in the coming days. The targets would remain the same as discussed.
However, an overall market sentiment analysis becomes vital to complement the technical factors to make a profitable move.