Polkadot: A move above $8 is critical, here’s why
The RSI and OBV of DOT reinforced the bullish bias but this wasn't the whole picture.

- DOT is expected to rise toward the $8.05-$8.2 resistance region.
- Whether the price forms a range or continues to trend upward has not yet been resolved.
Polkadot [DOT] showed a bullish flip in its bias on the one-day price chart over the past week of trading. The technical indicators also supported the idea of a rally. Yet, other data points suggested otherwise.
For a start, the $8 level represented a stern resistance level. Beyond it, the $8.5 region rebuffed DOT bulls a month ago. With Bitcoin [BTC] above $50k, capital rotation and an altcoin rally could commence in the coming weeks.
Range formation or an uptrend?
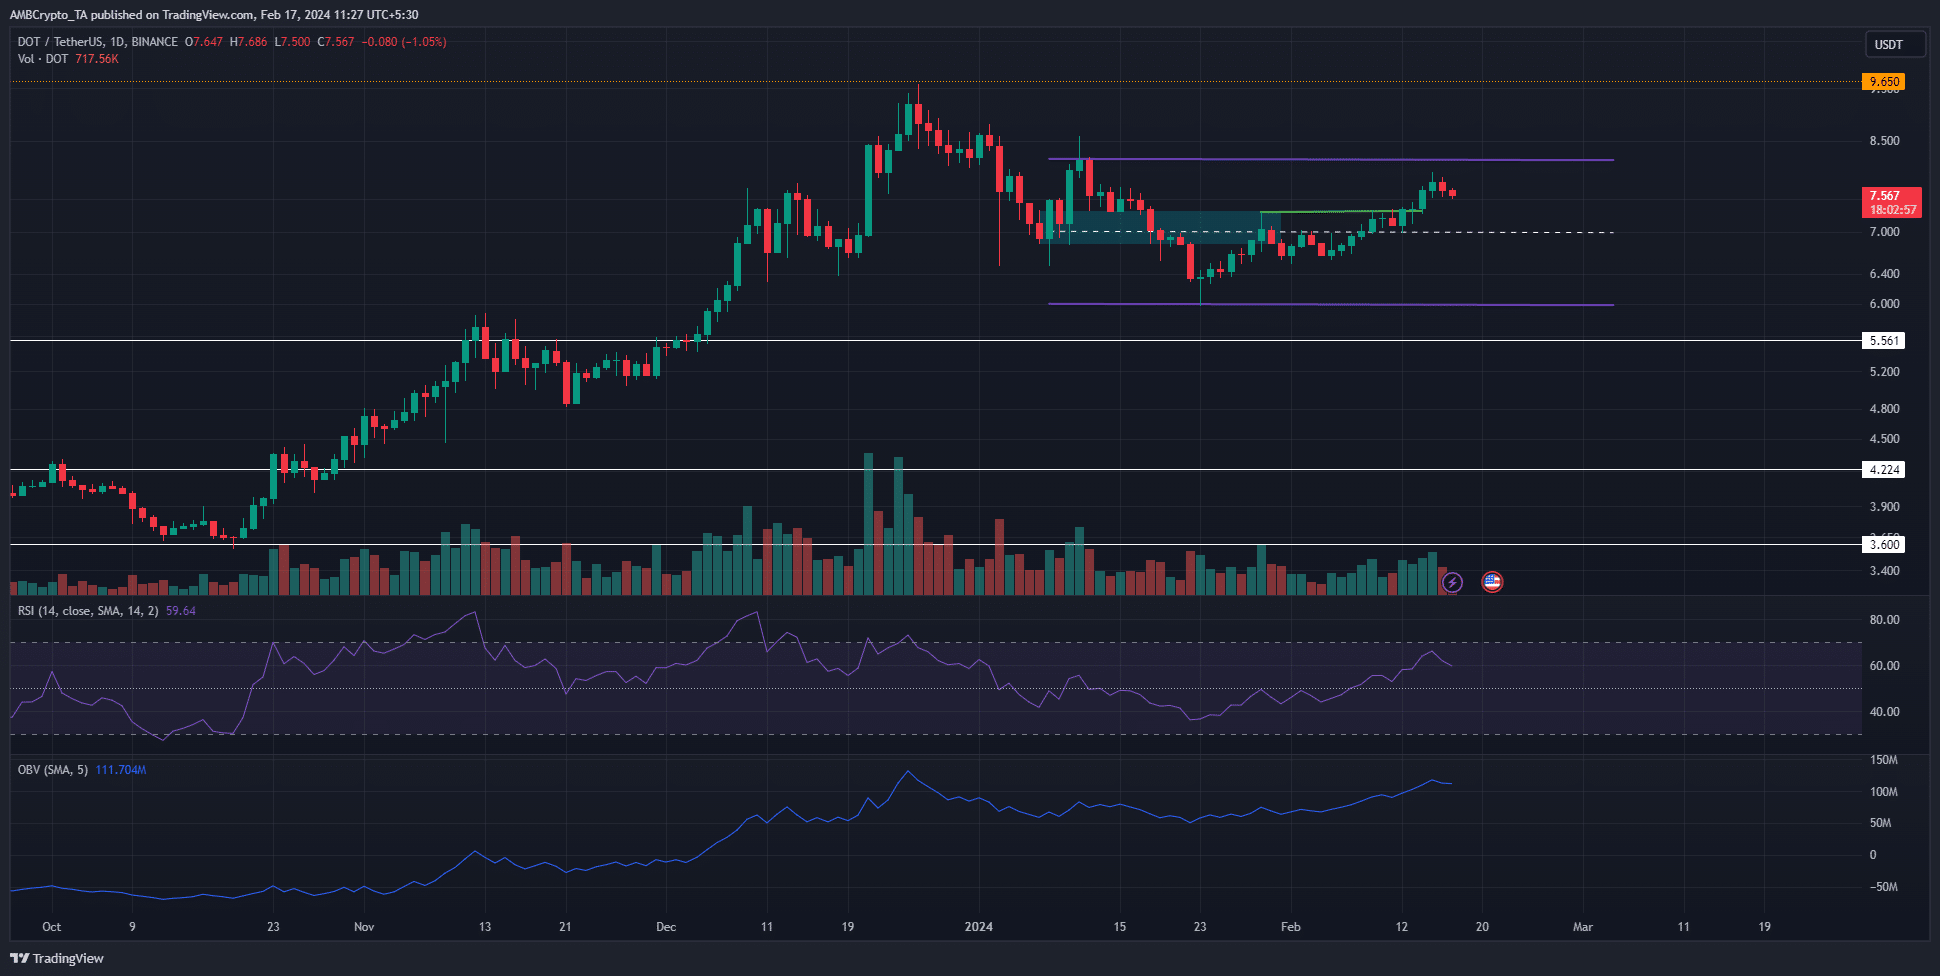
In green, the one-day bullish market structure break that occurred on the 13th of February was highlighted. The RSI also climbed above neutral 50 to reinforce the idea of bullish momentum. The OBV trended higher over the past three weeks.
This was evidence of steady buying pressure. Together with the price action, it suggested that DOT has room for the prices to push past the $8 and $8.5 obstacles.
Yet, there was also evidence to support the idea of a range (purple) that extended from $8.15 to $5.98, with the mid-point at $7.06. The mid-point has served as support and resistance in the past six weeks.
The liquidation levels showed why a range made sense
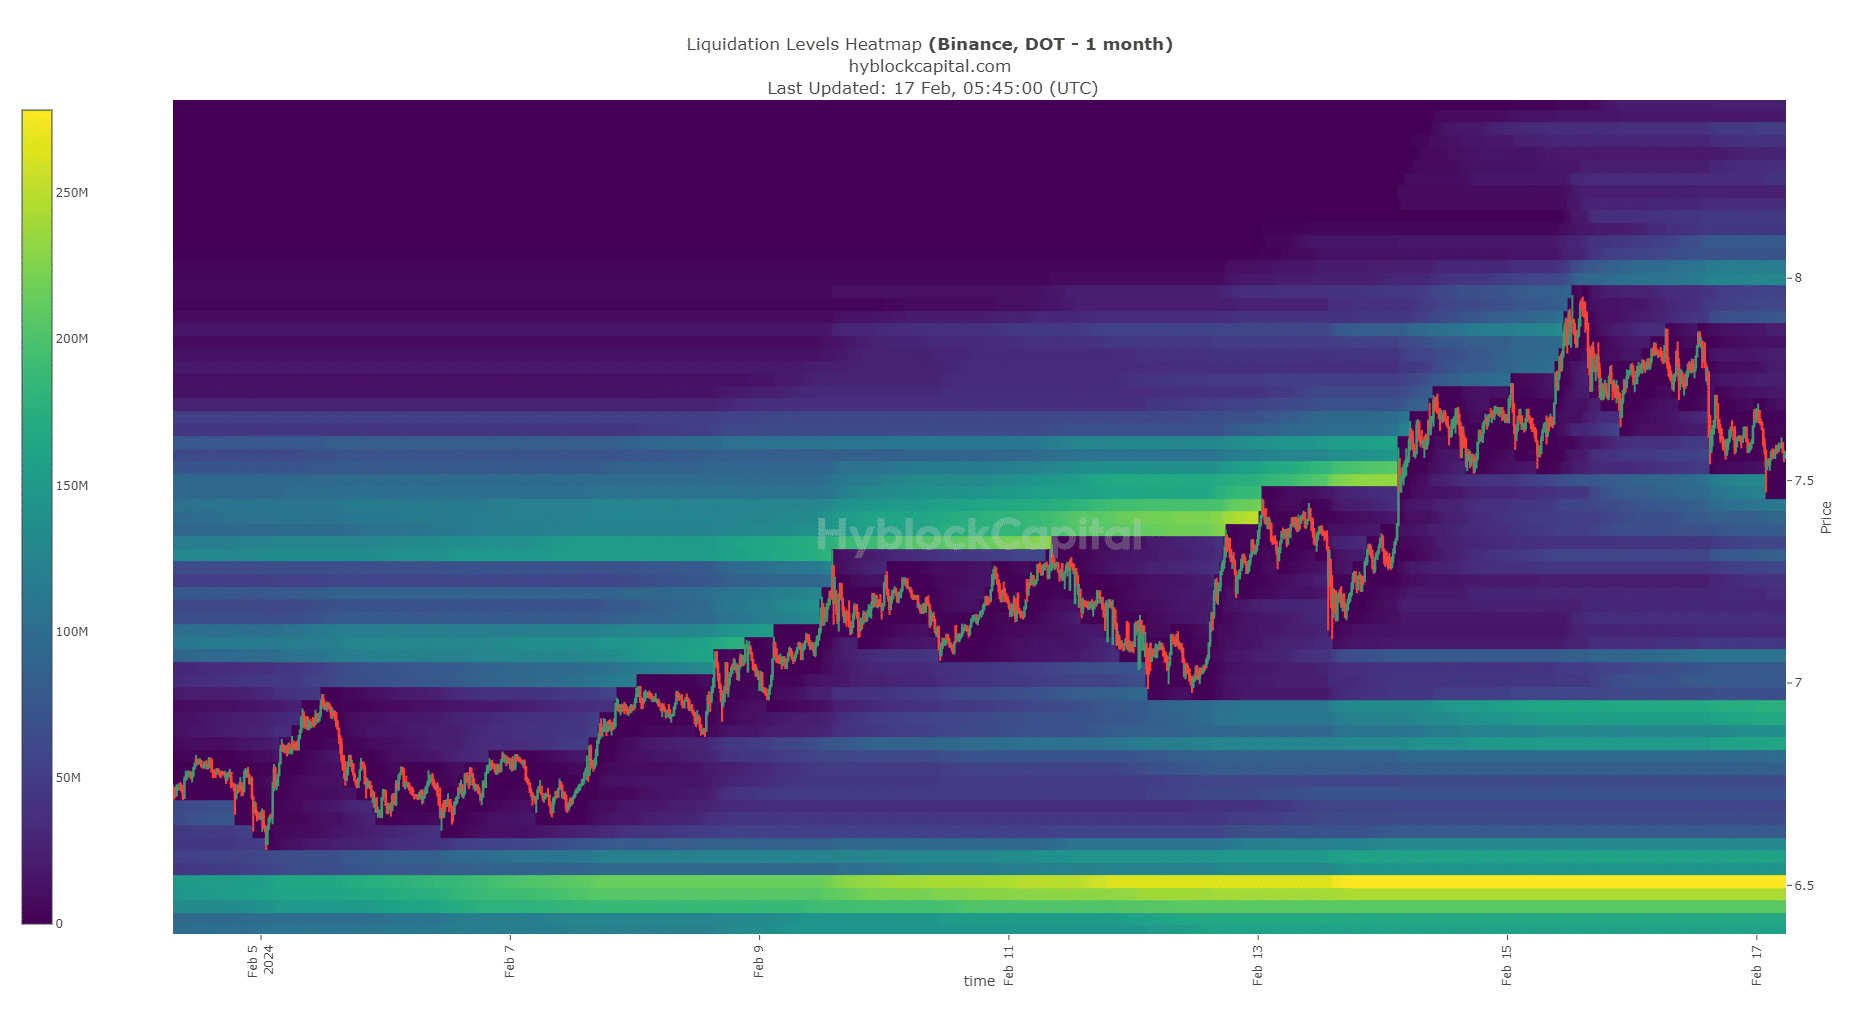
AMBCrypto analyzed the liquidation levels heatmap data from Hyblock. It showed that the $7.37-$7.53 region was estimated to have multiple liquidation levels measuring close to $100 million.
Similarly the $8-$8.05 region also presented a pocket of liquidity of similar size.
How much are 1, 10, or 100 DOT worth today?
A dip to the $7.4 region was possible to hunt these liquidation levels. A push to the $8.05 level appeared likely to follow. However, liquidity above it was sparse.
Therefore, DOT prices might reverse their uptrend in the $8.2-$8.4 region and fulfill the range expectations. This meant that while traders could entertain optimism for Polkadot, they must temper their expectations with caution.
Disclaimer: The information presented does not constitute financial, investment, trading, or other types of advice and is solely the writer’s opinion.


