Polkadot: Why this could be a profitable entry for DOT buyers

Disclaimer: The findings of the following analysis are the sole opinions of the writer and should not be considered investment advice
Post a brief compression phase in the $18-zone, Polkadot (DOT) did quite well to recover on its charts over the last day. The recent jump led the alt to find a comfortable close above the 20/50 EMA.
The bears continued to negate the buying pressure at the current level. Any fall below the $18.8-mark would put DOT in a position to test the $18.6-$18.4 range before a likely bullish comeback. At press time, DOT was trading at $18.78, up by 1.29% in the last 24 hours.
DOT 4-hour Chart

The previous bearish phase from its early April highs led the alt to lose more than 28% of its value and tumble toward its one-month low on 12 April.
Since hitting the $17-base, DOT registered multiple sharp rallies in its endeavor to reclaim vital support levels. The 200 EMA (green) disregarded all the recovery attempts while offering a strong selling point. To top it up, the three-week trendline resistance and the mid-line of the up-channel (white) coincided to pose hurdles in the current revival rally.
After a strong rebound from this level, if the price finds its ground below the near-term up-channel (yellow), DOT could see a short-term setback before the bulls would aim to re-enter near the 20/50 EMA zone.
With the 20 EMA maintaining its mark above the 50 EMA, the bulls could create possible obstructions as the alt finds its way down. An eventual close above its immediate trendline resistance would be critical to steer the motion in favor of buyers.
Rationale
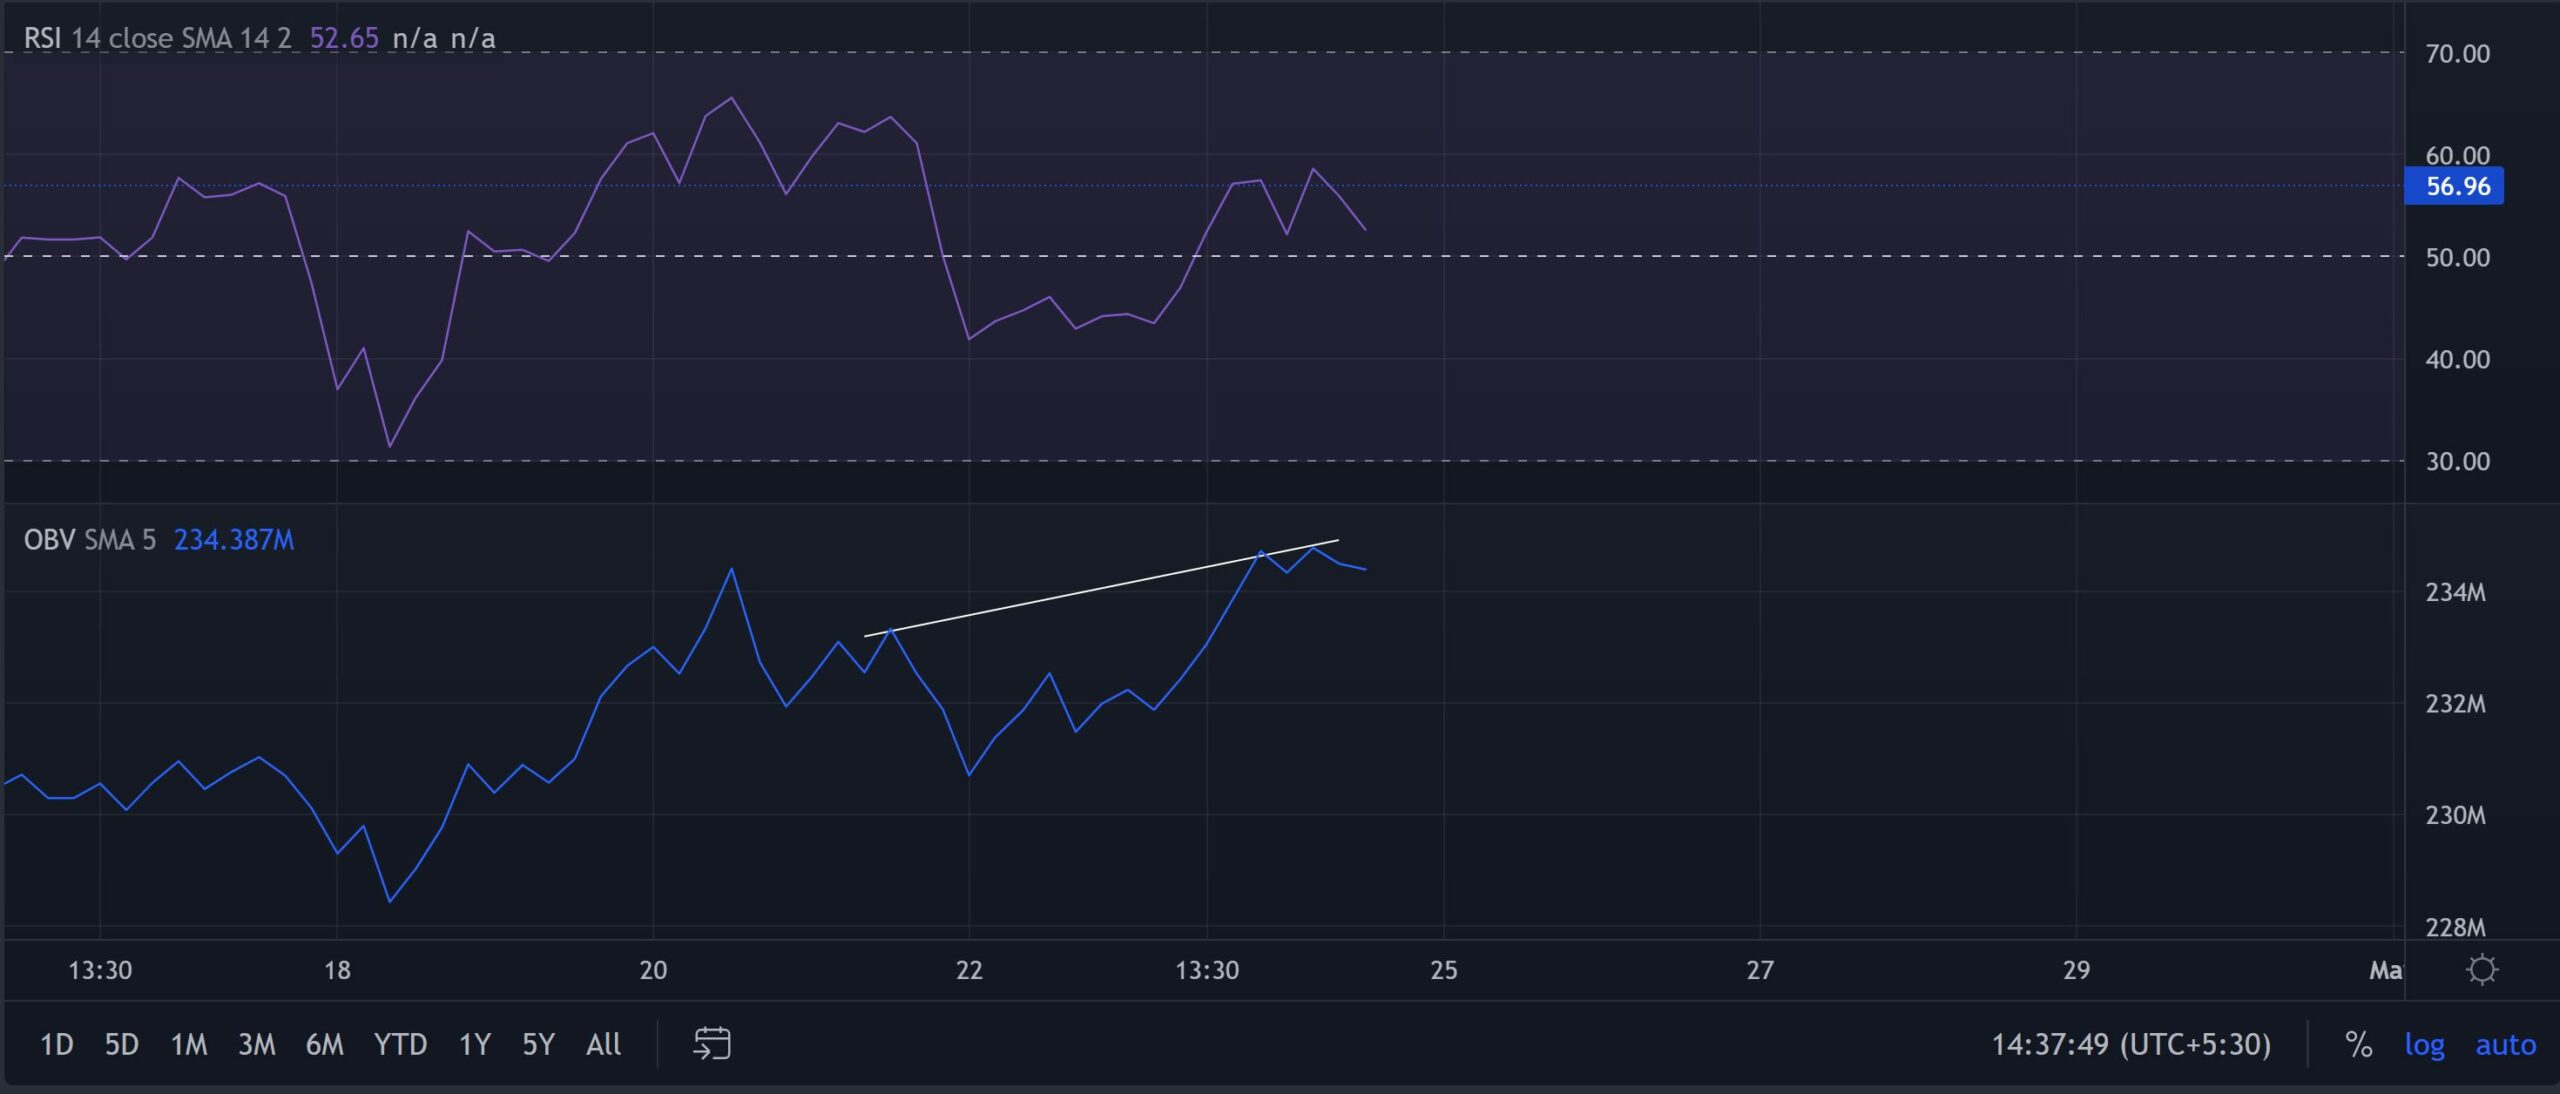
The 4-hourly RSI found some stability in the 50-56 range whilst giving a slight buying edge. Nevertheless, any close below the equilibrium will result in an extended decline phase in the $18-zone.
Although the OBV corresponded with the amplified growth over the last day, it undertook a hidden bearish divergence with price. Thus, a near-term pullback on the price shouldn’t surprise the investors/traders.
Conclusion
In view of the hidden bearish divergence with the OBV and the confluence of multiple resistances, DOT could see a short-term pullback towards the $18.6-$18.4 range. With the improving position on its EMA’s, the bulls could then propel a rally to break the bonds of the $18.8-mark.
Finally, an overall market sentiment analysis becomes vital to complement the technical factors to make a profitable move.


