
- DOT’s price dropped by 20% in the last 30 days.
- A few technical indicators looked bullish on the token.
Polkadot [DOT] bears have been controlling the token’s price for a few days as its value moved sideways. However, this might just be the tip of the iceberg, as the larger picture looked different.
If the latest data is to be considered, the possibility of DOT initiating a bull rally is high.
Polkadot is getting ready for a pump
According to CoinMarketCap, DOT’s price only moved marginally in the last seven days. But things got worse in the last 24 hours as the token’s value dropped by over 1.8%.
At the time of writing, DOT was trading at $8.42 with a market capitalization of over $12 billion. However, investors must not get disheartened, as a bull pattern appeared on the token’s price chart.
As per a tweet from FLASH, a popular crypto analyst, Polkadot’s price was about to break out of a bull pattern that earlier had resulted in bull rallies.
To be precise, DOT’s price gained bullish momentum back in February and November 2023 after it broke above a similar pattern. If history repeats itself, then investors might soon witness DOT’s price touch its March highs once again.
Apart from this, DOT also reached a milestone in terms of its network activity. AMBCrypto reported a few days ago that DOT’s total number of active accounts in the ecosystem surpassed 605,000, reflecting high network usage and adoption.
Is a bull rally inevitable?
To check the possibility of DOT actually bearing above the pattern, AMBCrypto took a look at its on-chain metrics. Our analysis of Santiment’s data revealed that DOT’s open interest remained relatively high.
Whenever the metric rises, it indicates that the on-going price trend might continue, which in this instance was bearish.
The token’s funding rate also looked bearish. Generally, the price tends to move the other way than the funding rate. Since DOT’s funding rate was high, the chances of DOT’s value declining further seem high.
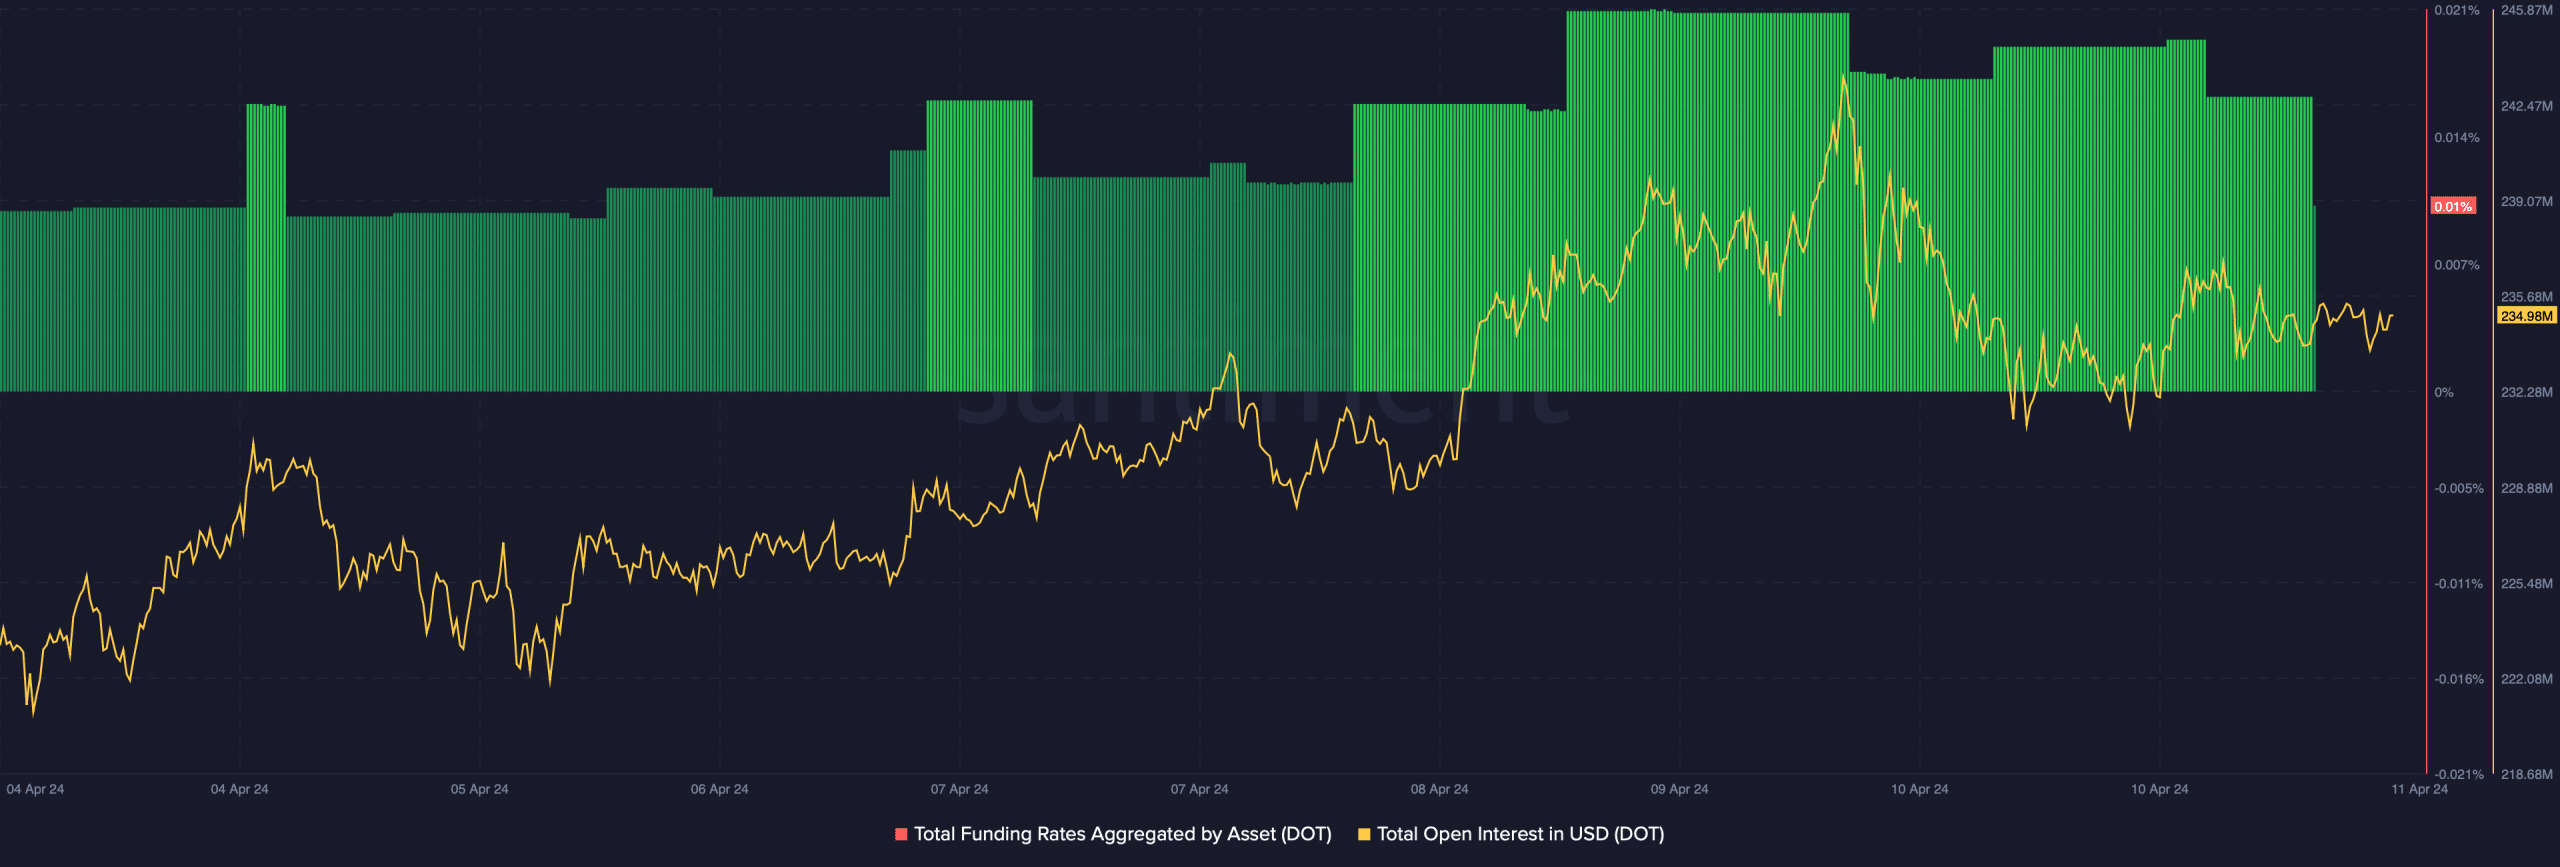
Source: Santiment
Realistic or not, here’s DOT market cap in BTC’s terms
We then planned to check Polkadot’s daily chart to better understand the chances of DOT’s price gaining bullish momentum. As per the analysis, DOT’s Relative Strength Index (RSI) was bearish as it was resting below the neutral mark.
However, the Chaikin Money Flow (CMF) and Money Flow Index (MFI) supported the possibility of DOT breaking above the bullish pattern. This was the case as both of these technical indicators registered upticks in the last few days.
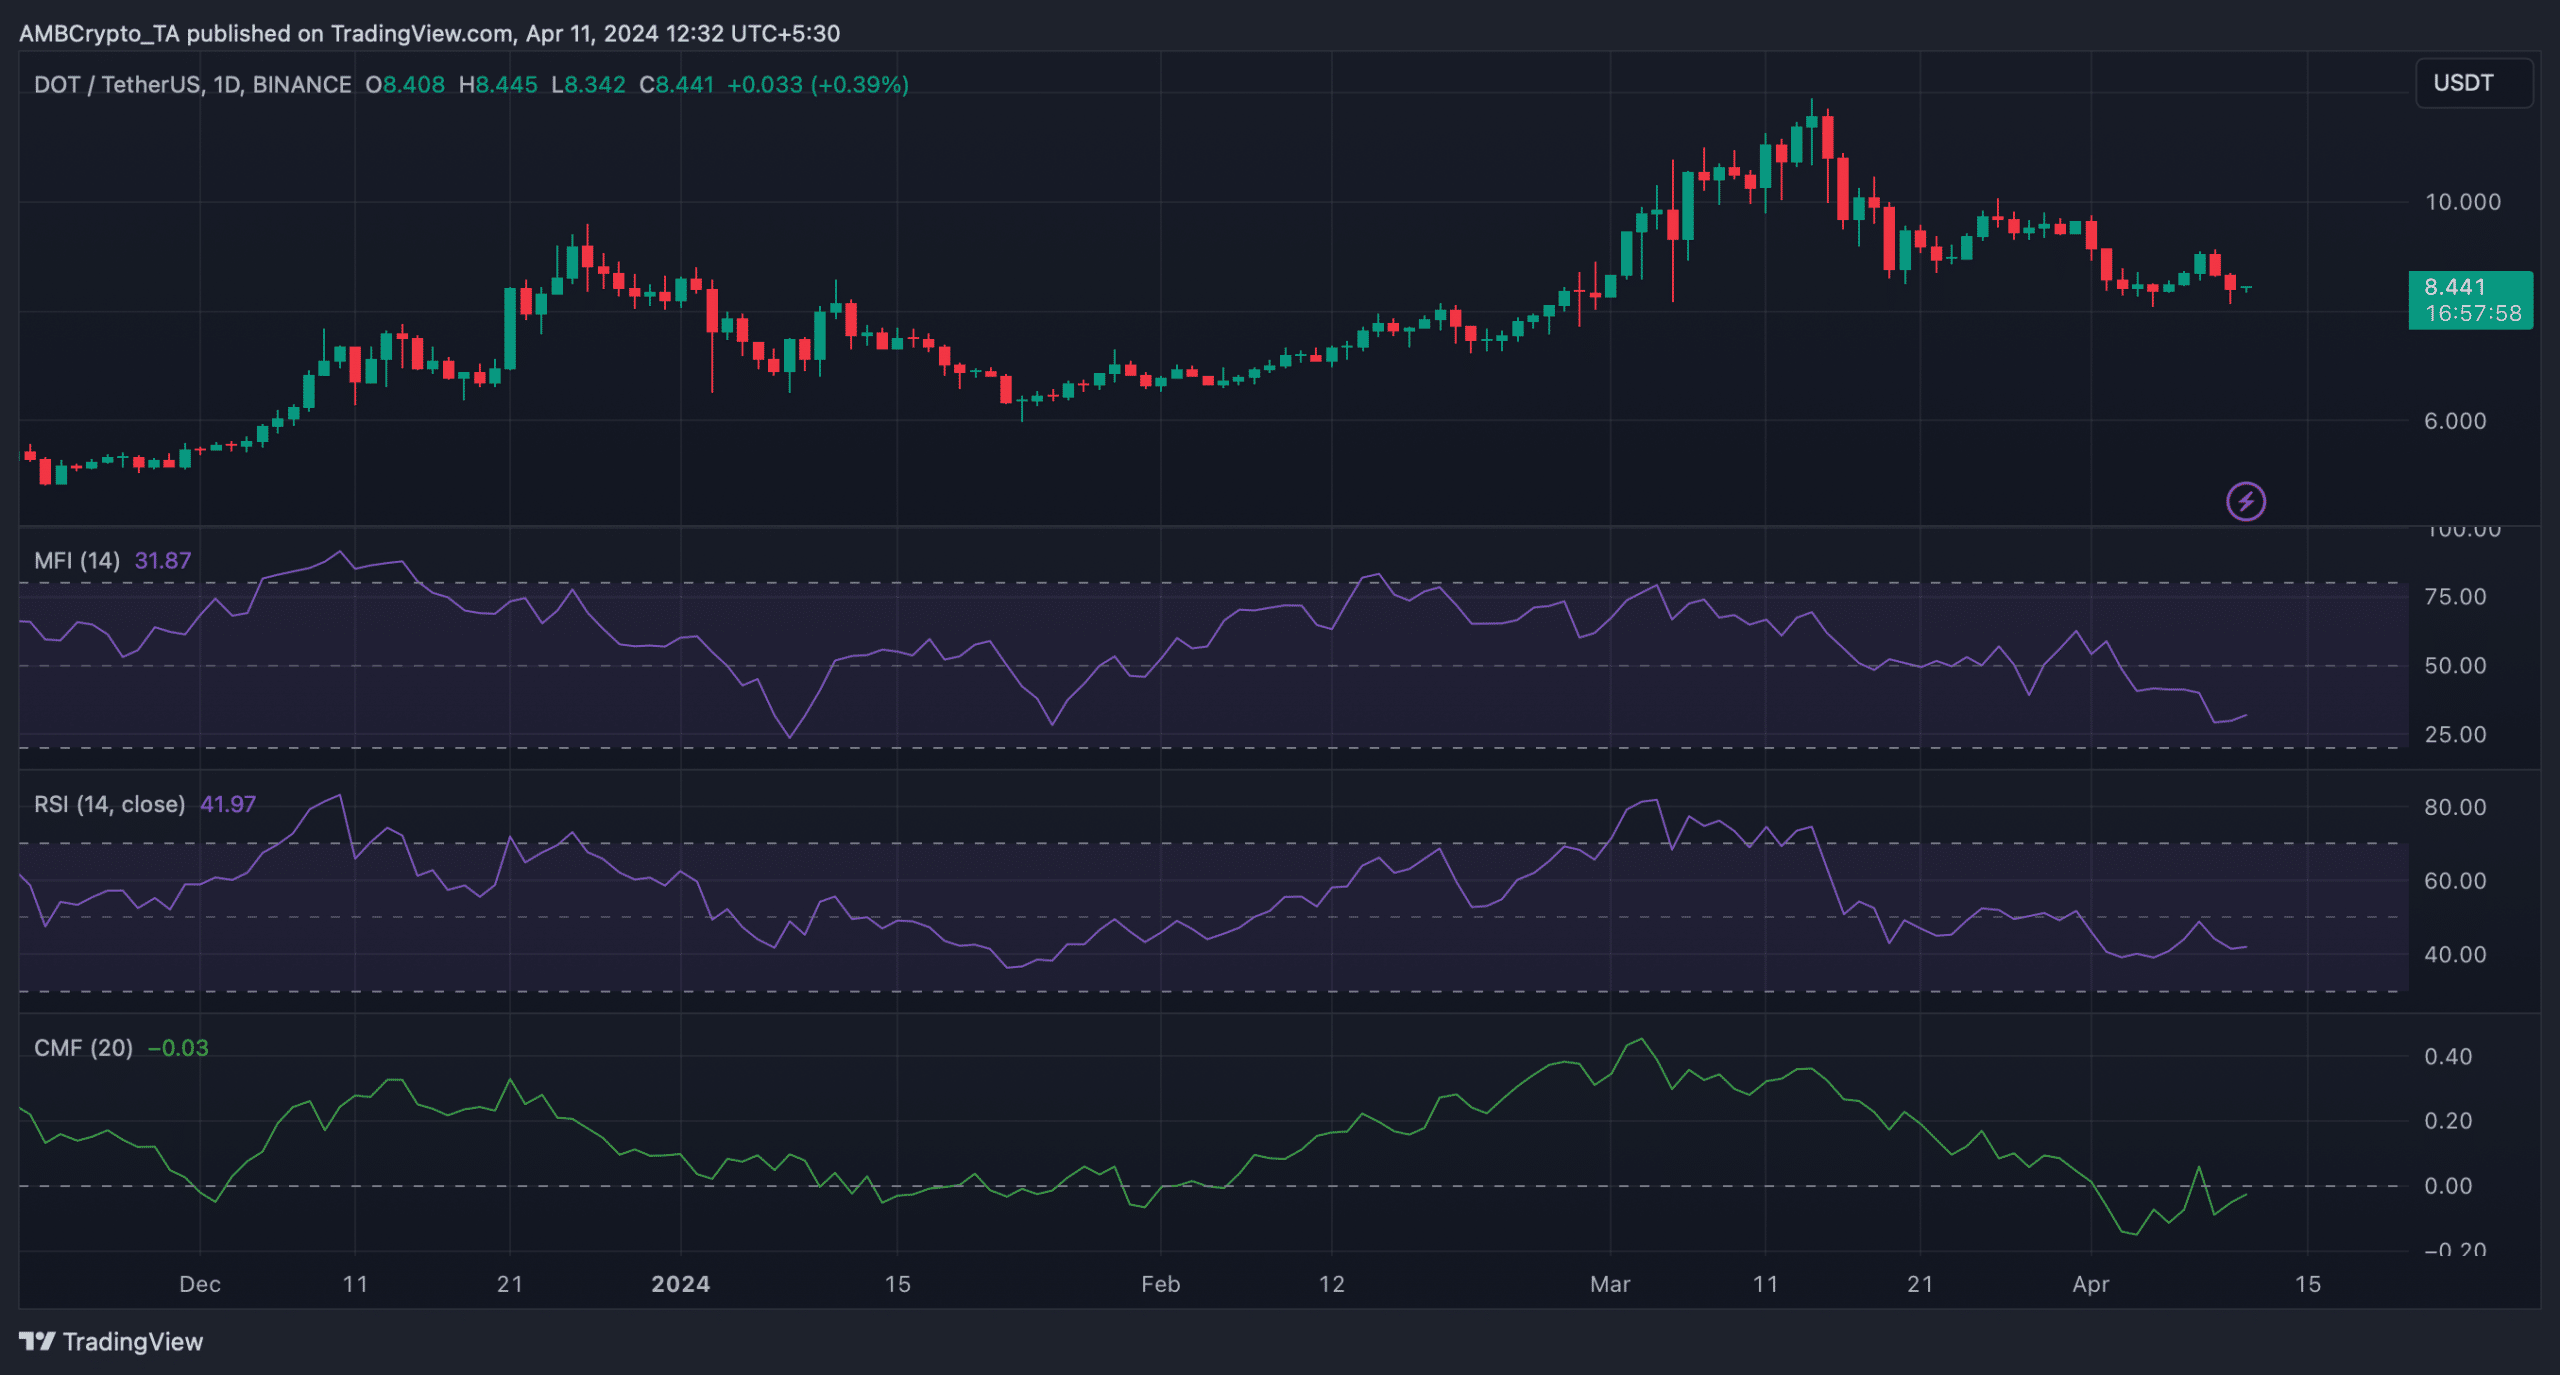
Source: TradingView