
- DOT seemed unable to break through the key $7 resistance
- Ichimoku Cloud and its alignment with the double-top pattern signaled further declines
Polkadot (DOT) is grappling with intense pressure from the market’s bears after failing to breach the key resistance level of $7. In fact, over the last 14 days, DOT’s price has fluctuated between a high of $7.25 and a low of $6.16 on the charts.
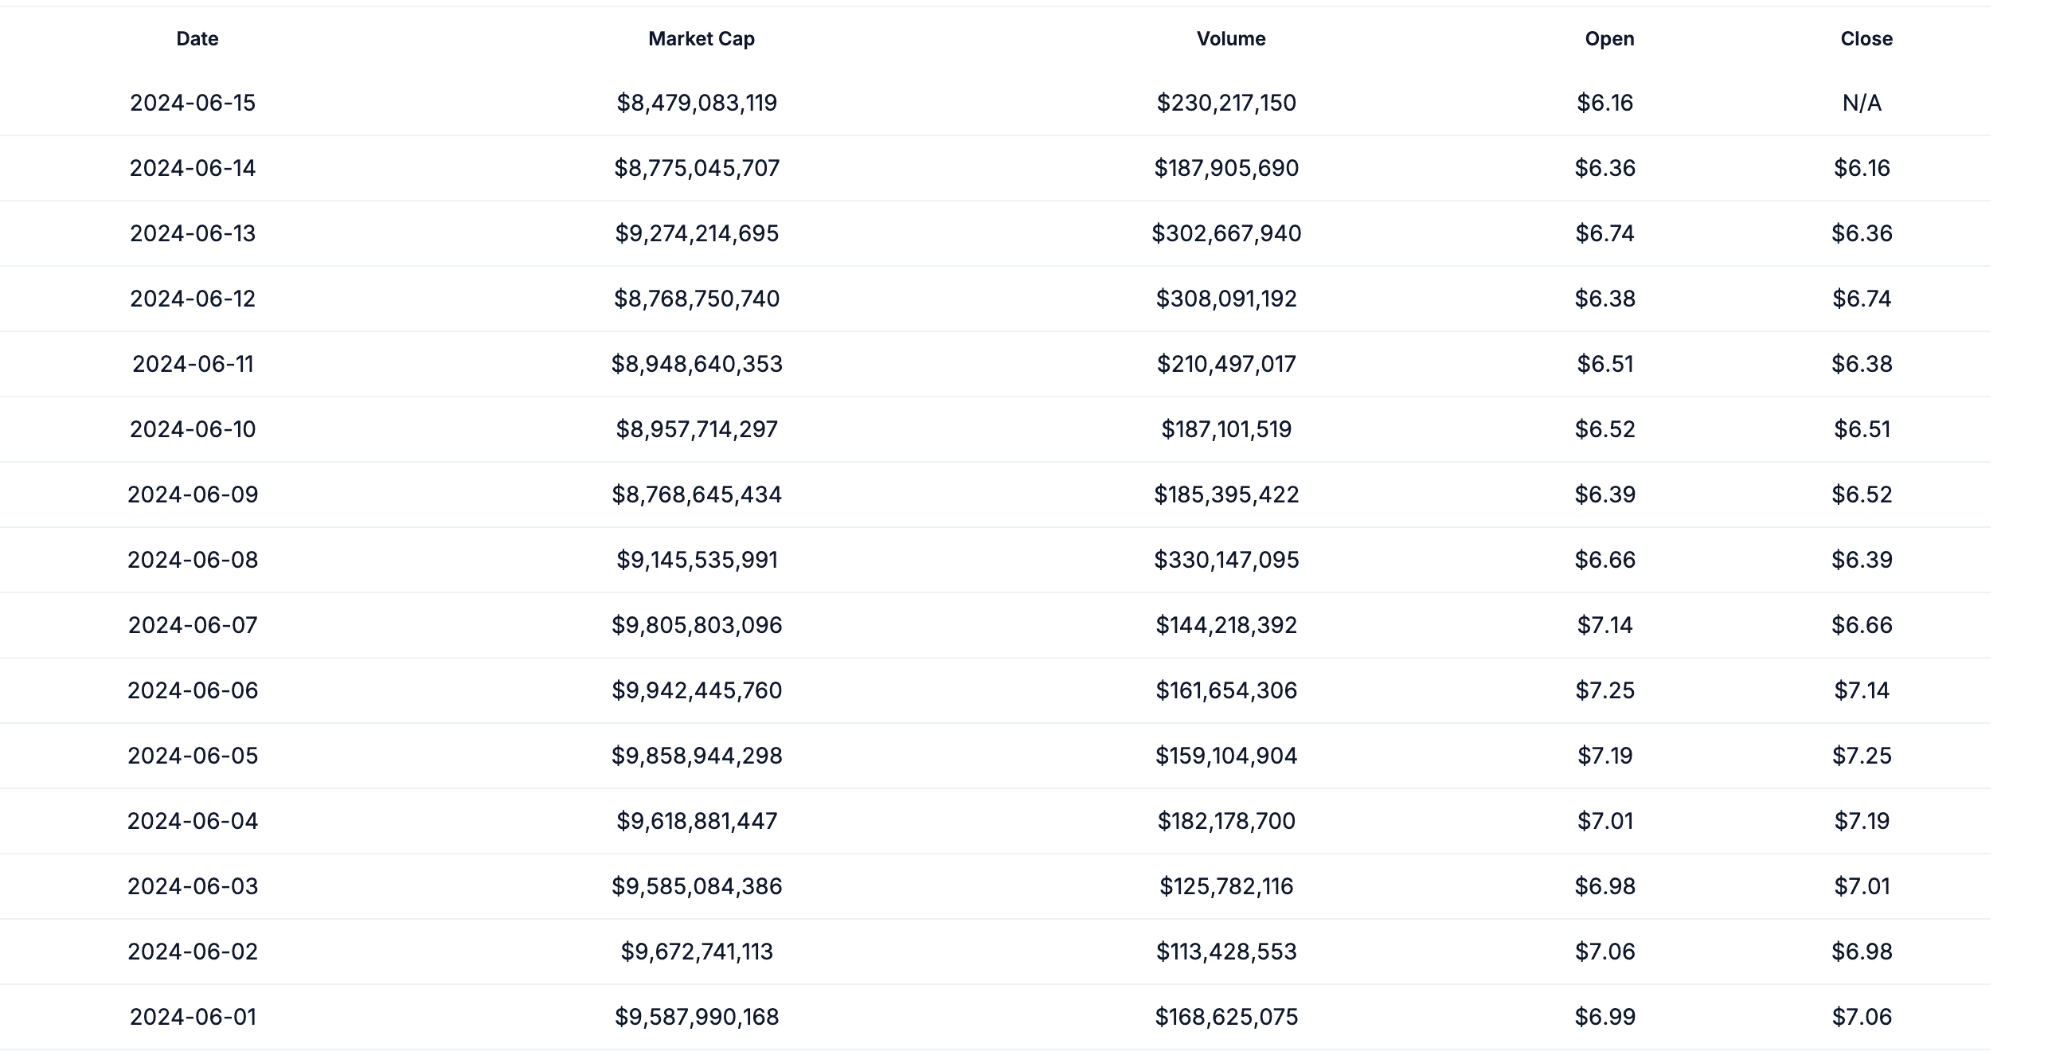
Source: CoinGecko
Despite repeated attempts to breach its immediate resistance level, DOT seemed to retreat to its press time level of $6.2, raising investors’ concerns about further declines.
Here, it’s worth pointing out that DOT’s price was below the Ichimoku Cloud too – A sign of a bearish trend. The conversion line (blue) and the baseline (red) seemed to be above the price too, reinforcing the bears’ position.
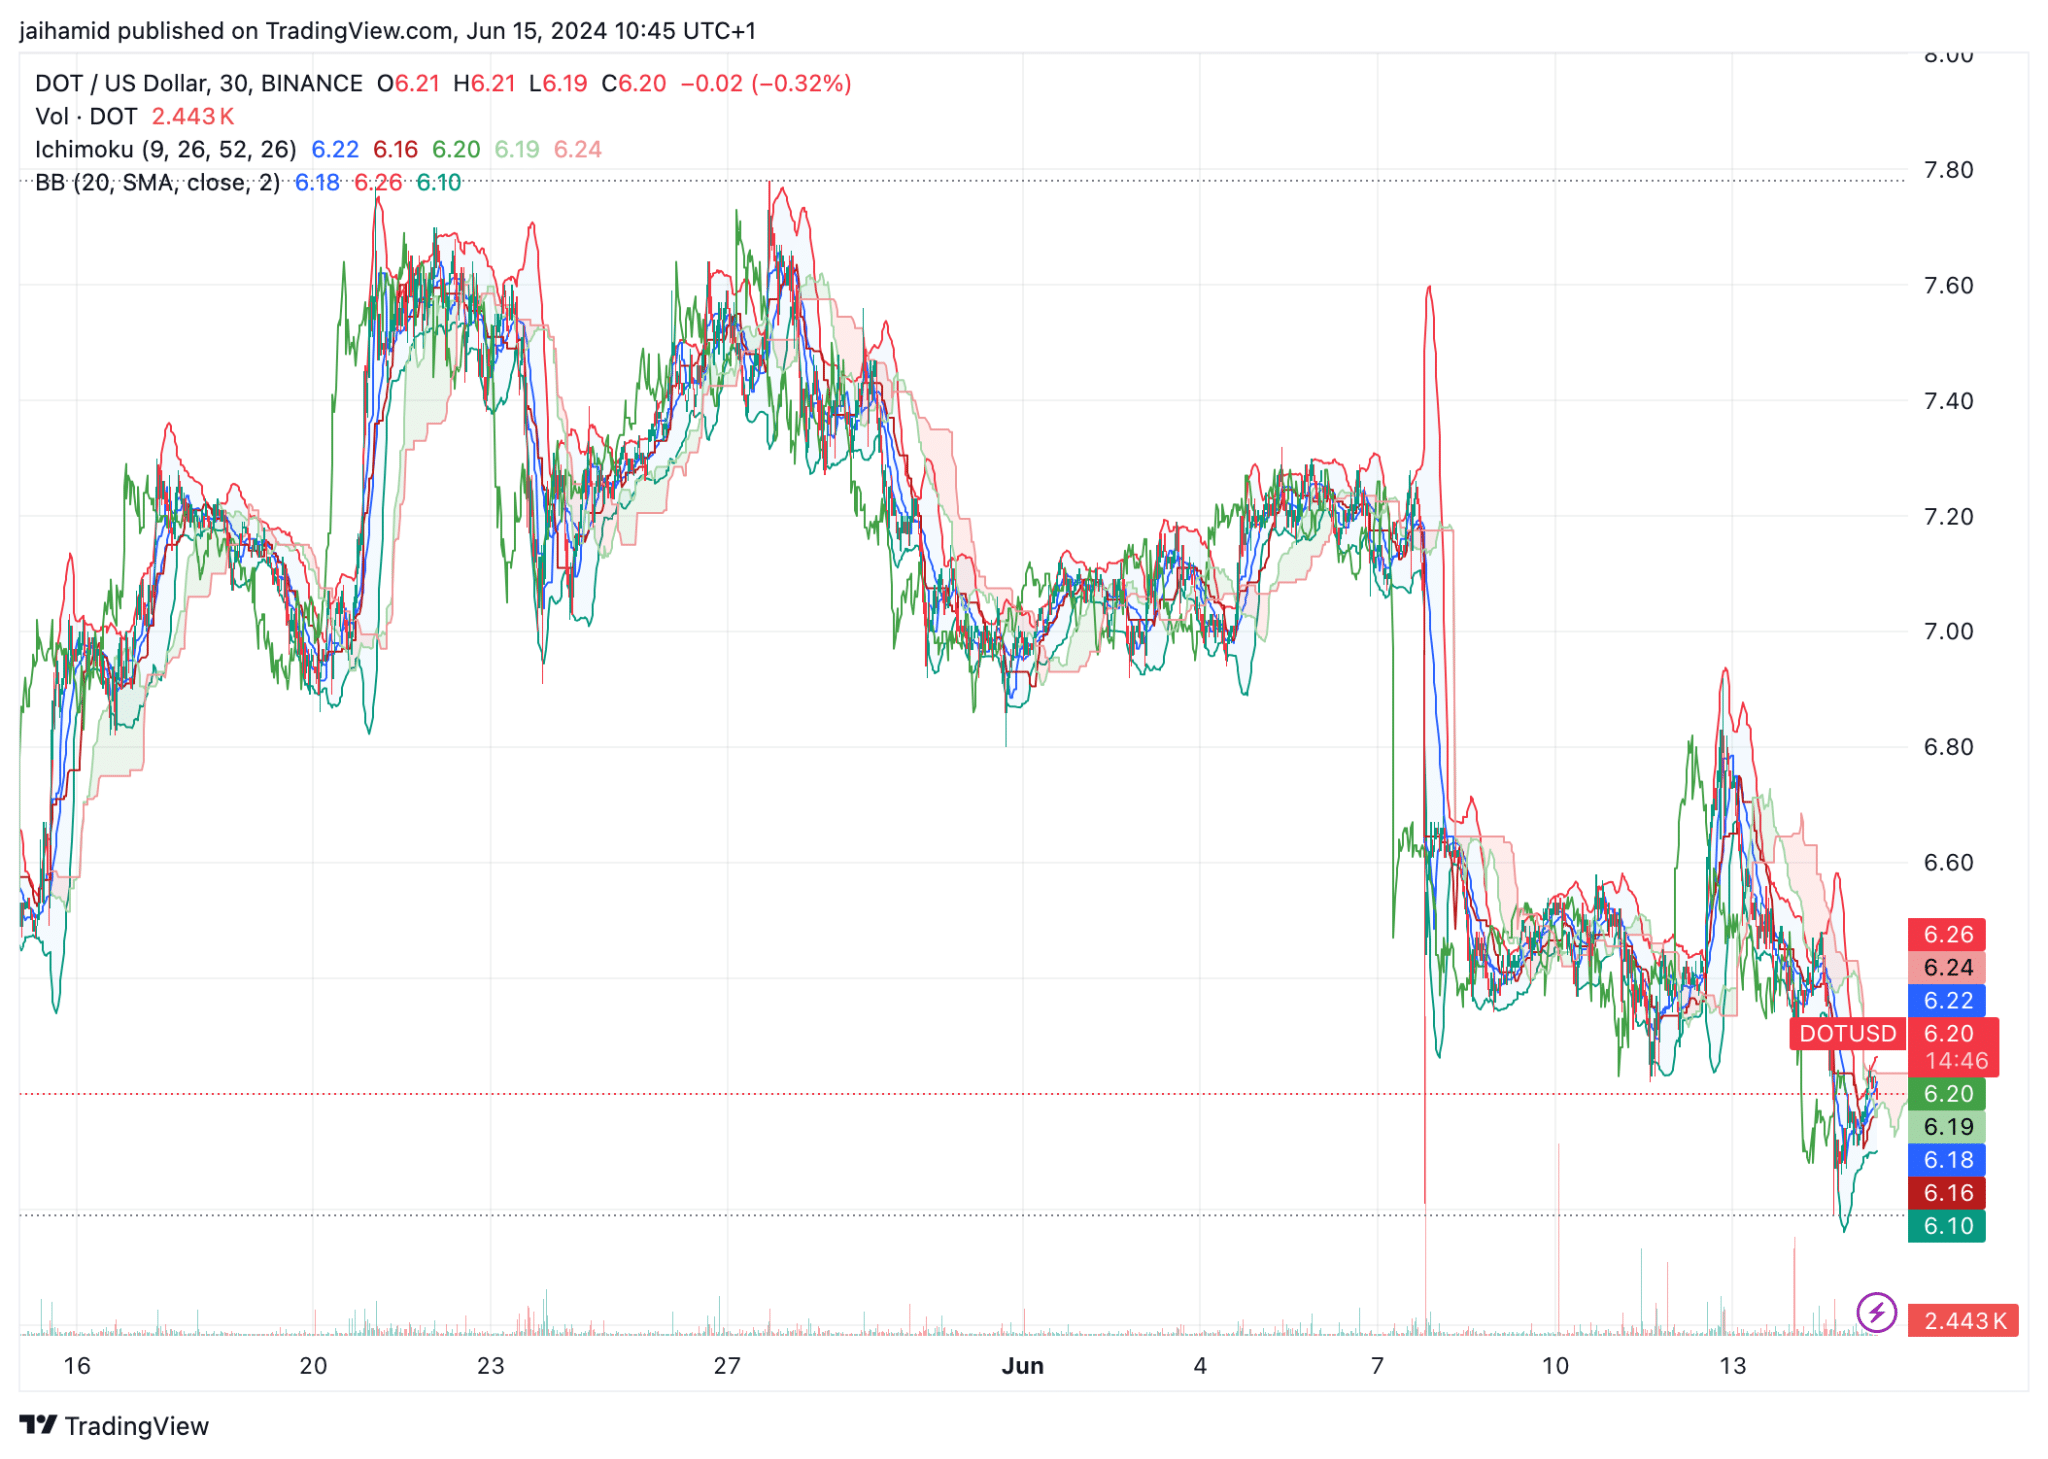
Source: DOT/USD, TradingView
At the time of writing, the price was also near the lower band of the Bollinger Bands, indicating that DOT may be potentially oversold in the short term. If buying pressure returns, this could lead to a temporary rebound or consolidation on the charts.
The moving averages were trending south too, and the price was below these lines – Indicating further declines.
The consolidation zone around $6.20 is critical. The short-term forecast is if DOT holds this level, it may form a base for northbound movement, particularly if it can push above $6.30, which might act as a minor resistance.
Conversely, failing to maintain the $6.20-level could see DOT testing lower supports, possibly around $6.16 or extending to $6.00, if the bearish pressure intensifies.
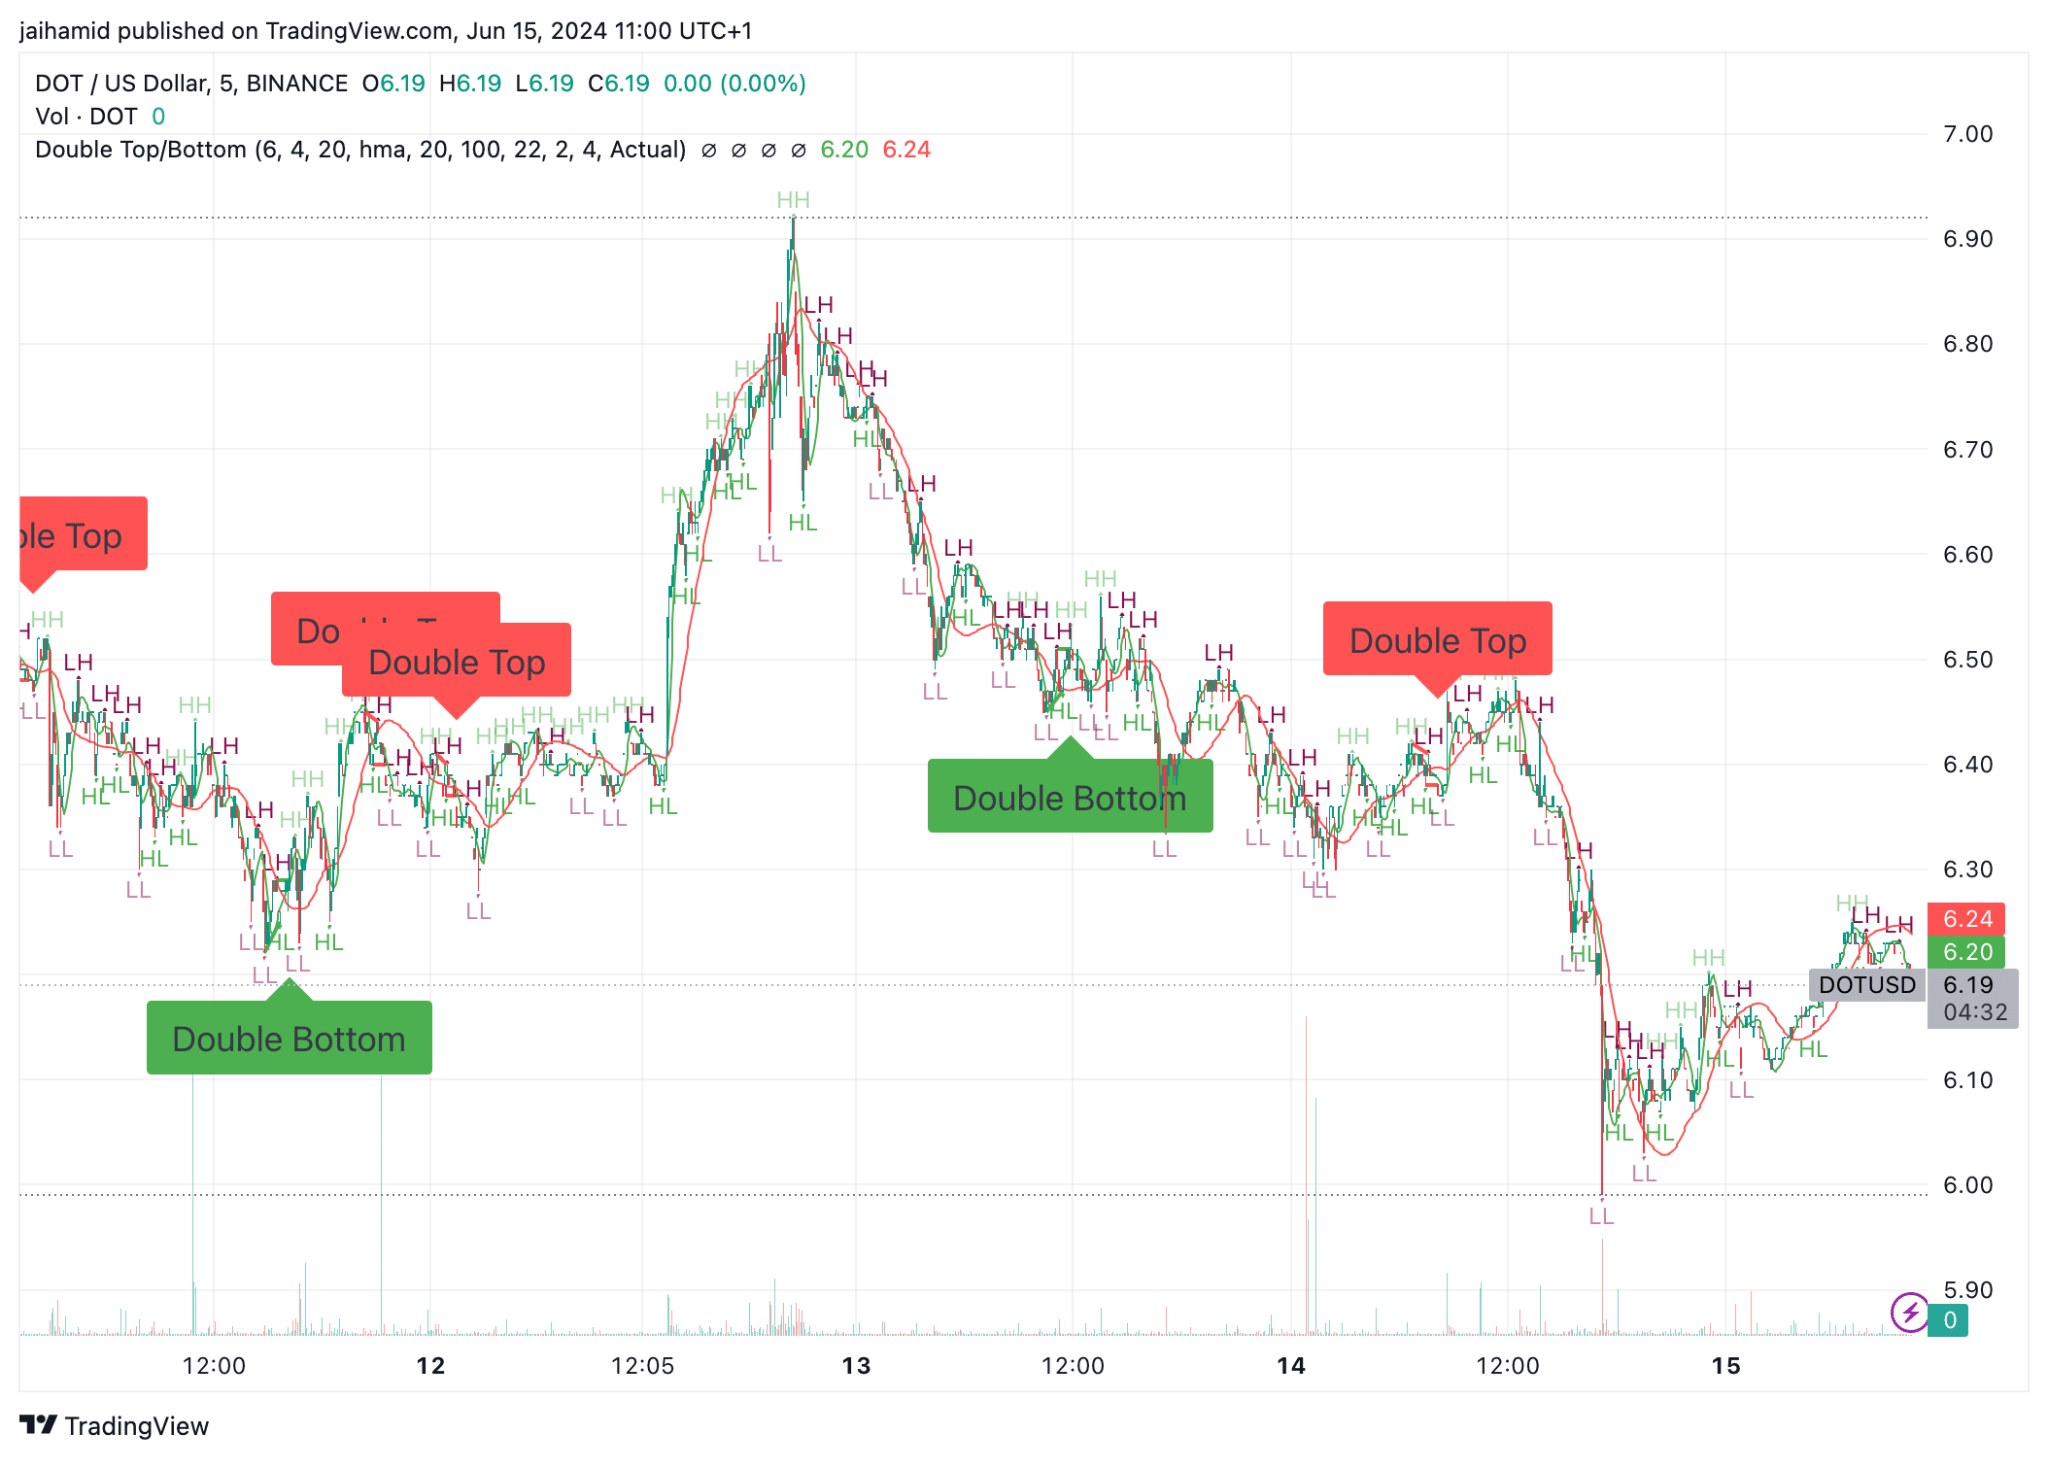
Source: TradingView
In the aforementioned chart, the double-top pattern is visible around the $6.60-level, where the price tested this point twice before declining each time. Here, double tops are typically considered bearish reversal patterns, indicating that the price would continue to fall after failing to break through the resistance.
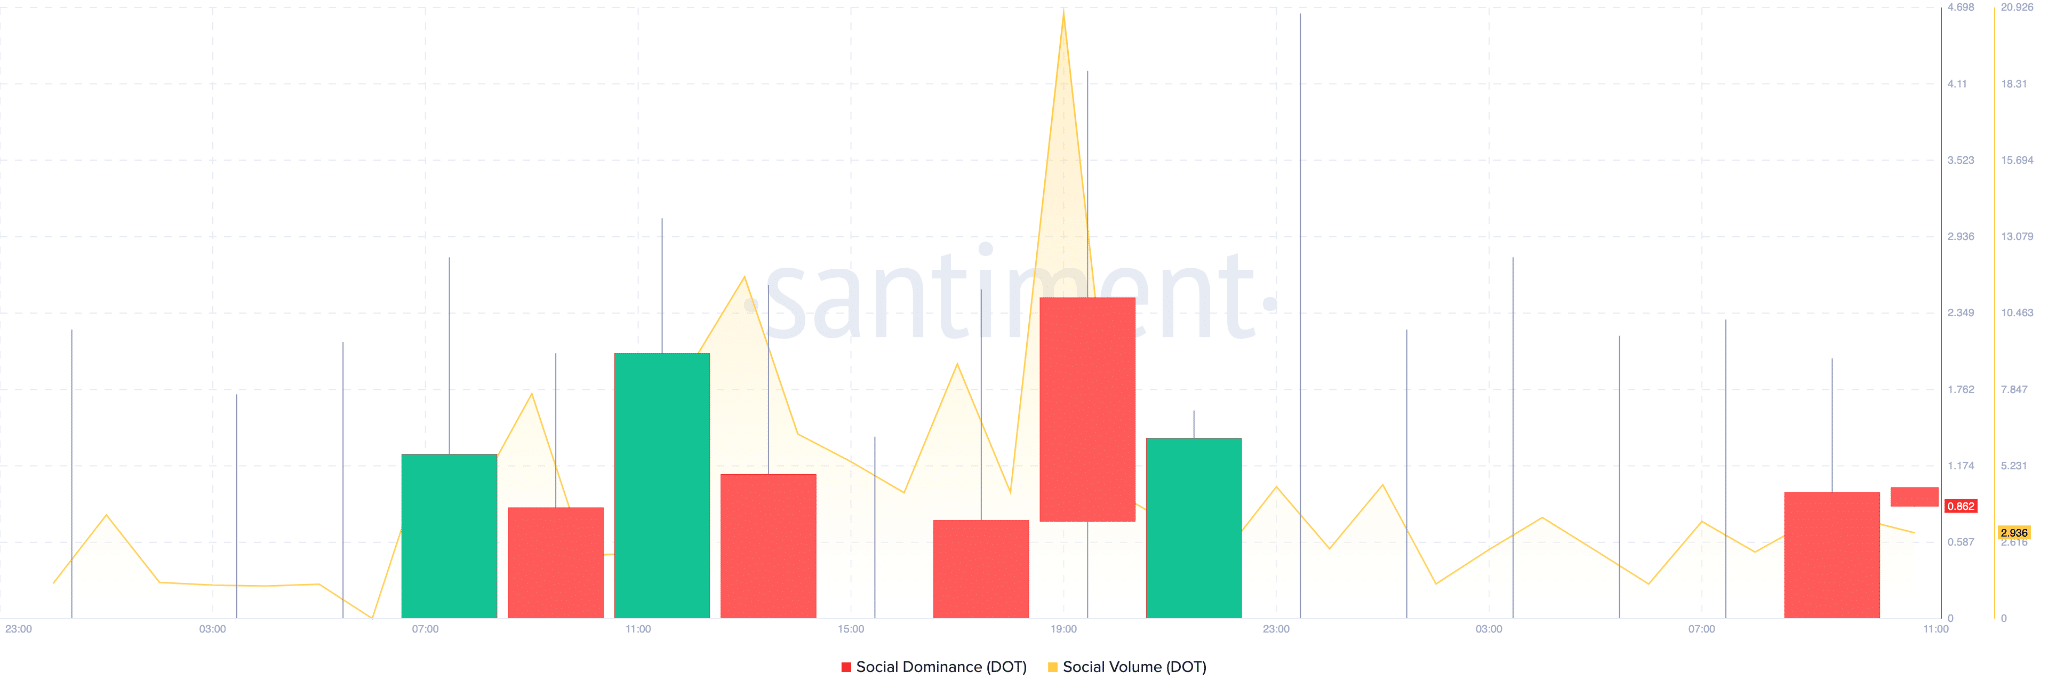
Source: Santiment
Interestingly, DOT’s social volume and dominance recently recorded fairly modest spikes on the charts. The alignment of high social volume and sustained social dominance can often precede volatility in price as more traders and investors pay attention to DOT and potentially act on the information circulated.