MATIC: A $1+ value if bulls clear this roadblock
MATIC cracked the bullish order block (OB) and the $0.94 - $1.05 support zone in early May, exposing the altcoin to elevated selling pressure.

Disclaimer: The information presented does not constitute financial, investment, trading, or other types of advice and is solely the writer’s opinion
Although Q1 2023 was smooth, Q2 has been full-blown bearish for altcoins so far. In particular, Polygon [MATIC] cracked the key support zone of $0.94 – $1.05 in Q2. However, the plunge eased and made a U-turn before retesting the December lows of $0.75.
As of press time, MATIC hiked over 8% in the past seven days, according to CoinMarketCap. But the daily performance was muted at about 0.7% after it hit a key bearish zone.
Will bulls clear the hurdle?
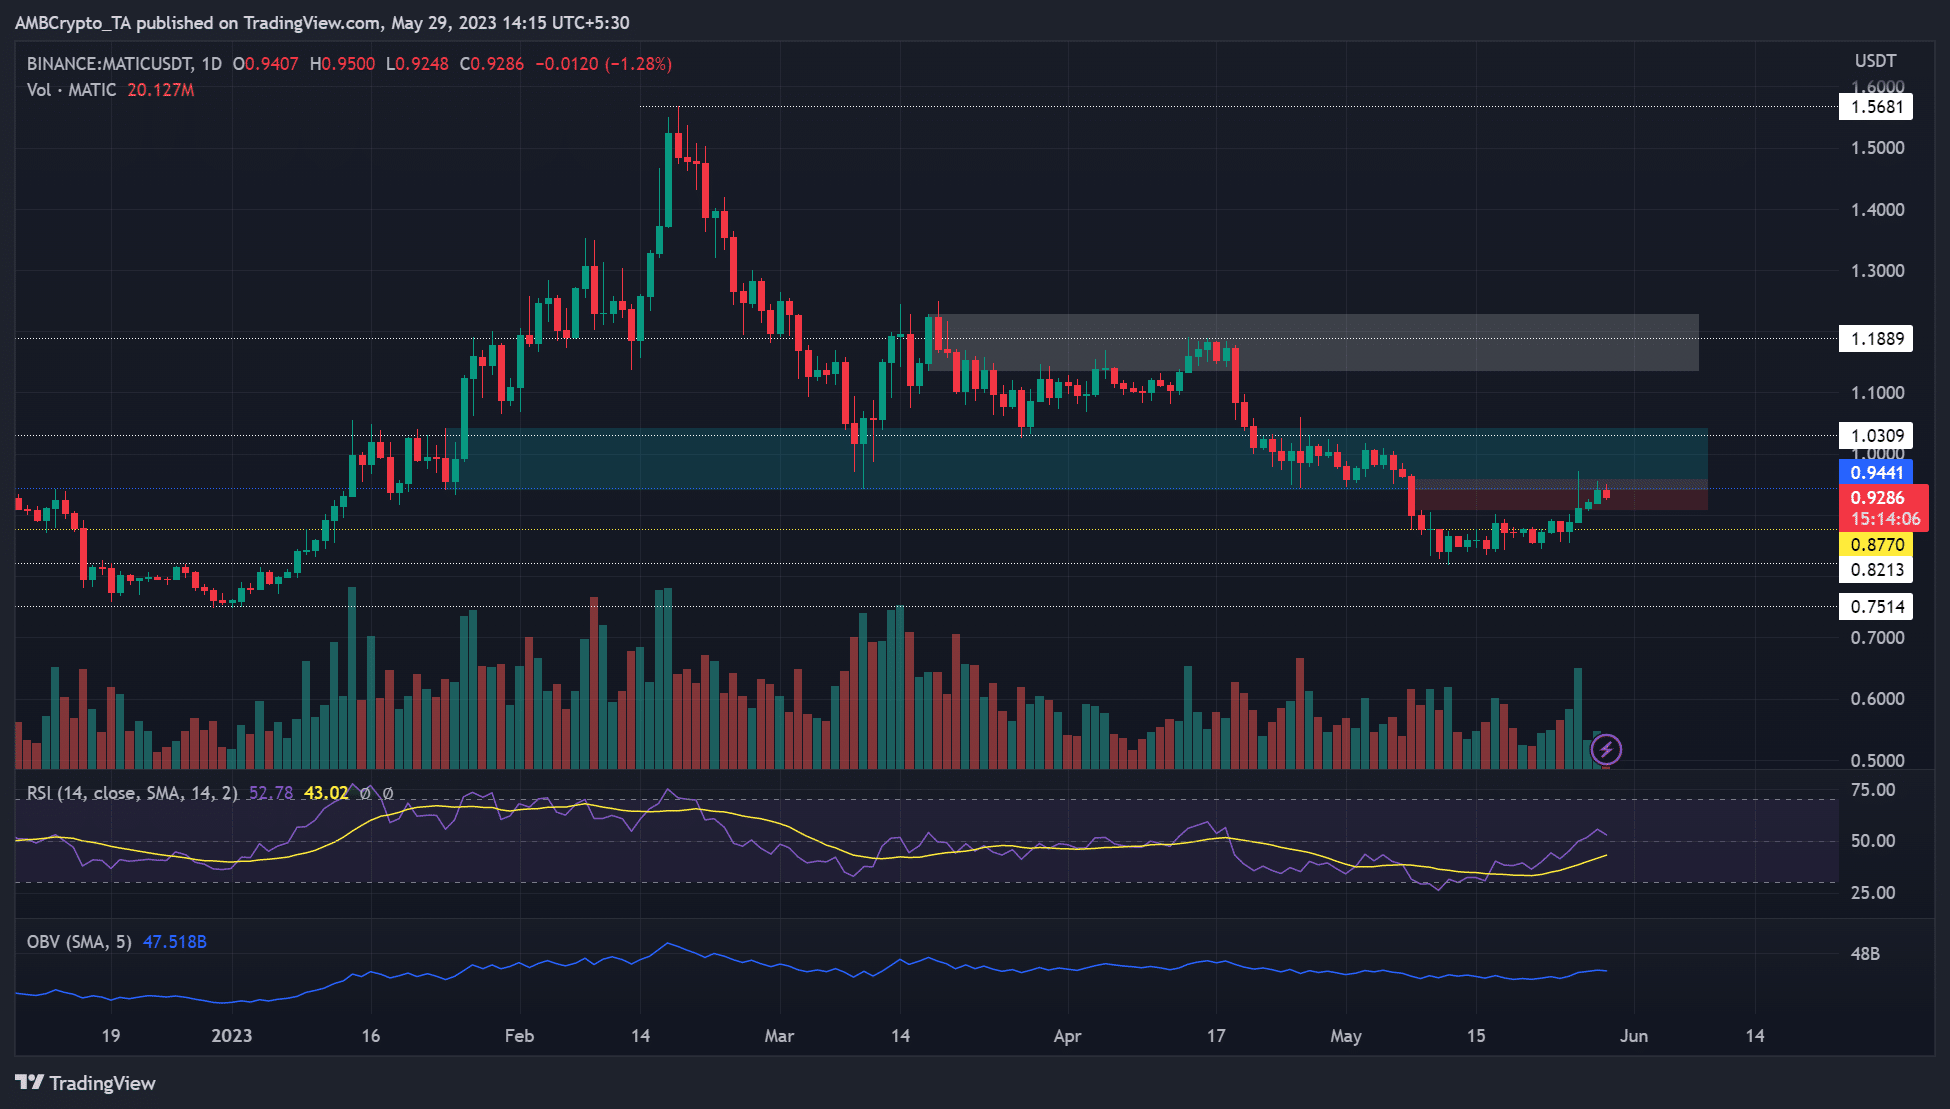
MATIC cracked the bullish order block (OB) and the $0.94 – $1.05 support zone in early May, exposing the altcoin to elevated selling pressure. Similarly, Bitcoin [BTC] also cracked a key $26.6k support level before rebounding strongly by the time of writing.
MATIC took a cue from BTC and fronted recovery. But the rally has hit a snag near the $0.94 level. Apart from dealing with the previous $0.94 – $1.05 support, the zone also aligns with an FVG (fair value gap) of $0.91 – $0.96 (red).
This could make the obstacle a strong bearish zone. But MATIC will reclaim the $1+ value if it is cleared. Above this hurdle, the next target will be a bearish OB, near $1.19.
Alternatively, sellers could stamp their control if bulls fail to flip $0.94 – $1.05 into a support zone. Such a price rejection would drag MATIC to $0.88 or $0.82.
The RSI and OBV increased in the past few days, but RSI was slightly above the neutral level. It means buying pressure and demand improved, but prices could go in either direction.
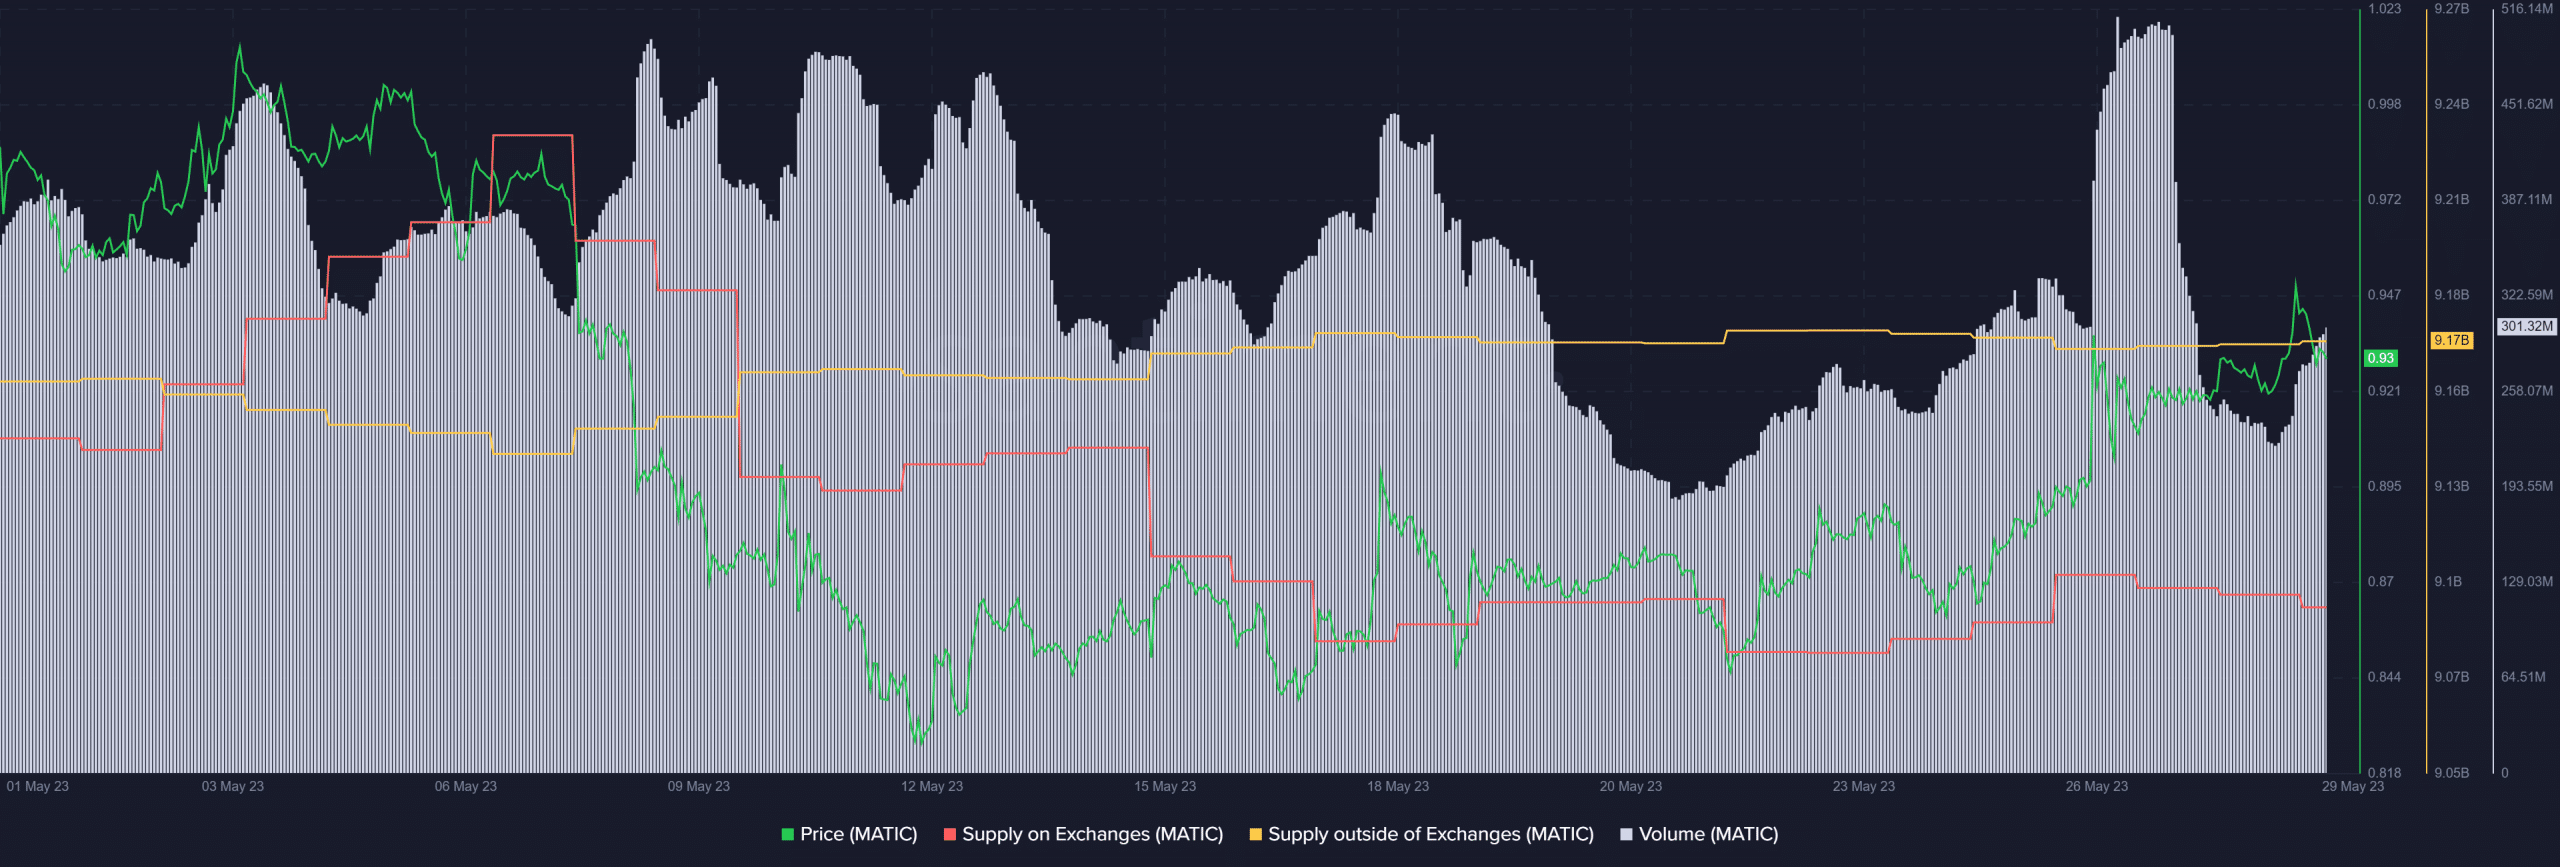
Supply on exchanges declined
Is your portfolio green? Check MATIC Profit Calculator
MATIC’s $1 value in early May, exposed it to increased selling pressure, as shown by the peak of supply on exchanges (red line). After that, the metric eased, denoting less MATIC was moved for selling on CEXs.
On the contrary, supply outside of exchanges increased, albeit sluggishly, highlighting traders’ slow accumulation of MATIC during the plunge.
The volume hit a new May record, surging above $500 million around 27 May after MATIC crossed the $0.90 mark.
But the volume eased at press time, which could further undermine bulls from bypassing the $0.94 obstacle. However, a BTC move to $28k could rally MATIC bulls to clear the hurdle.