Polygon
Polygon ends September on low note – What about holder profitability?
With most POL holders in the red, October’s outlook hinges on the price breaking out of its narrow range.
- POL token saw tight range-trading between $0.36 and $0.44 range across September.
- The 200-day SMA hovers below the 50-day and 100-day SMAs on the POL/USDT 4-hour. chart.
Polygon [POL] faced a challenging September, diverging from the broader crypto market’s bullish sentiment despite initial mild optimism tied to the ecosystem’s token swap.
The layer 2 scaling network activated the upgrade enabling the highly-anticipated MATIC to POL token migration on 4th September in a move aimed at unlocking more utility and flexibility.
Despite the hype around this milestone, POL reversed its gains in the last week of the month.
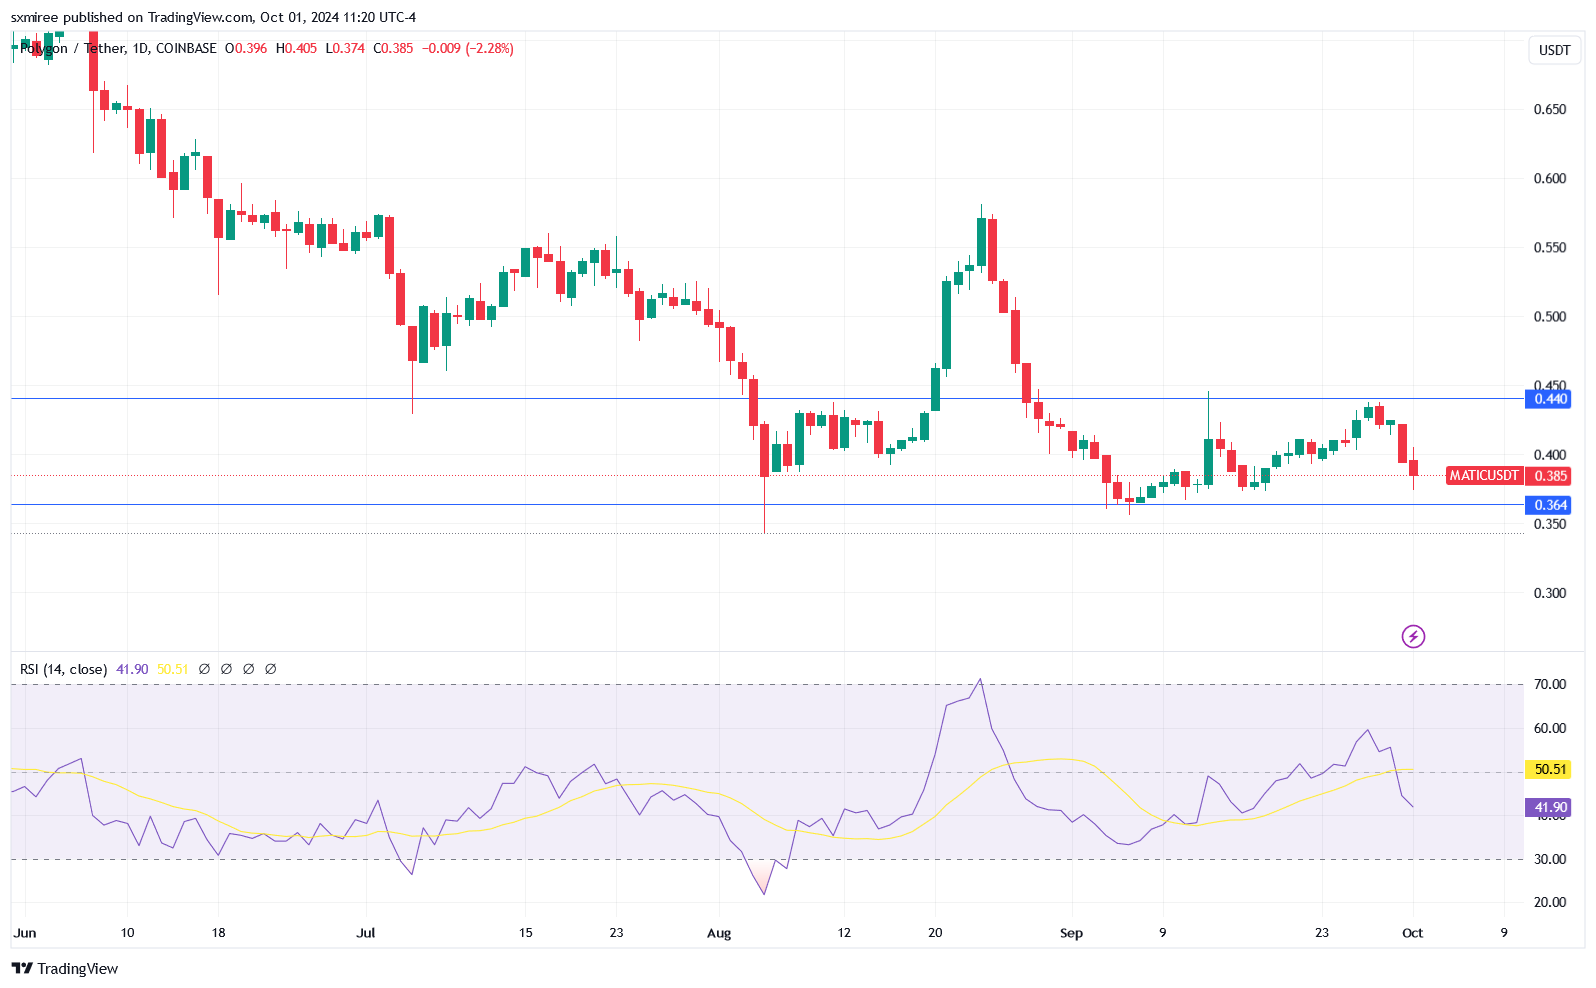
Source: TradingView
TradingView data shows the token’s price dropped from a month high of $0.446 on 28th September to $0.398 on the last day of the month.
POL (formerly MATIC) was trading at $0.38 at press time, down 5.6% on the day and 70% below its 13th March all-time high.
Holder profitability heading into Q4
The disappointing price action in September starkly contrasted Bitcoin and several altcoins, which registered decent gains in a month that is historically associated with negative returns.
Coinglass data showed that Bitcoin’s price rose 7.29% in September while Ether’s price moved 3.56% higher in the same period.
POL’s slump is especially concerning, given up to 95% of token holders are sitting on unrealized losses, according to data
from IntoTheBlock. This includes 81% of holders who have owned the token for a year, during which POL has shed 37% of its value.Ecosystem milestones
Last week, Polygon Labs activated the Ahmedabad hardfork on the Proof-of-Stake (PoS) mainnet following a two-week test period on the Amoy testnet.
The upgrade, which marked a crucial step in Polygon’s roadmap, entails three Polygon Improvement Proposals, i.e., PIP-30, PIP-36, and PIP-45.
The proposals introduce several optimizations to the PoS chain, primarily focused on improving the experience for decentralized application (dApp) users and developers.
PIP-30 increased the maximum code size from 24KB to 32KB, enabling dApp builders to execute complex contract deployments and logics. PIP 36 addressed the issue of stuck bridge transactions by making it possible to replay failed state syncs.
POL/USD technical analysis
On the POL/USDT 4-hour chart, the Relative Strength Index (RSI) bounced slightly from the oversold zone it touched on Monday before crashing again. The RSI reading stood at 30.61 at the time of writing.
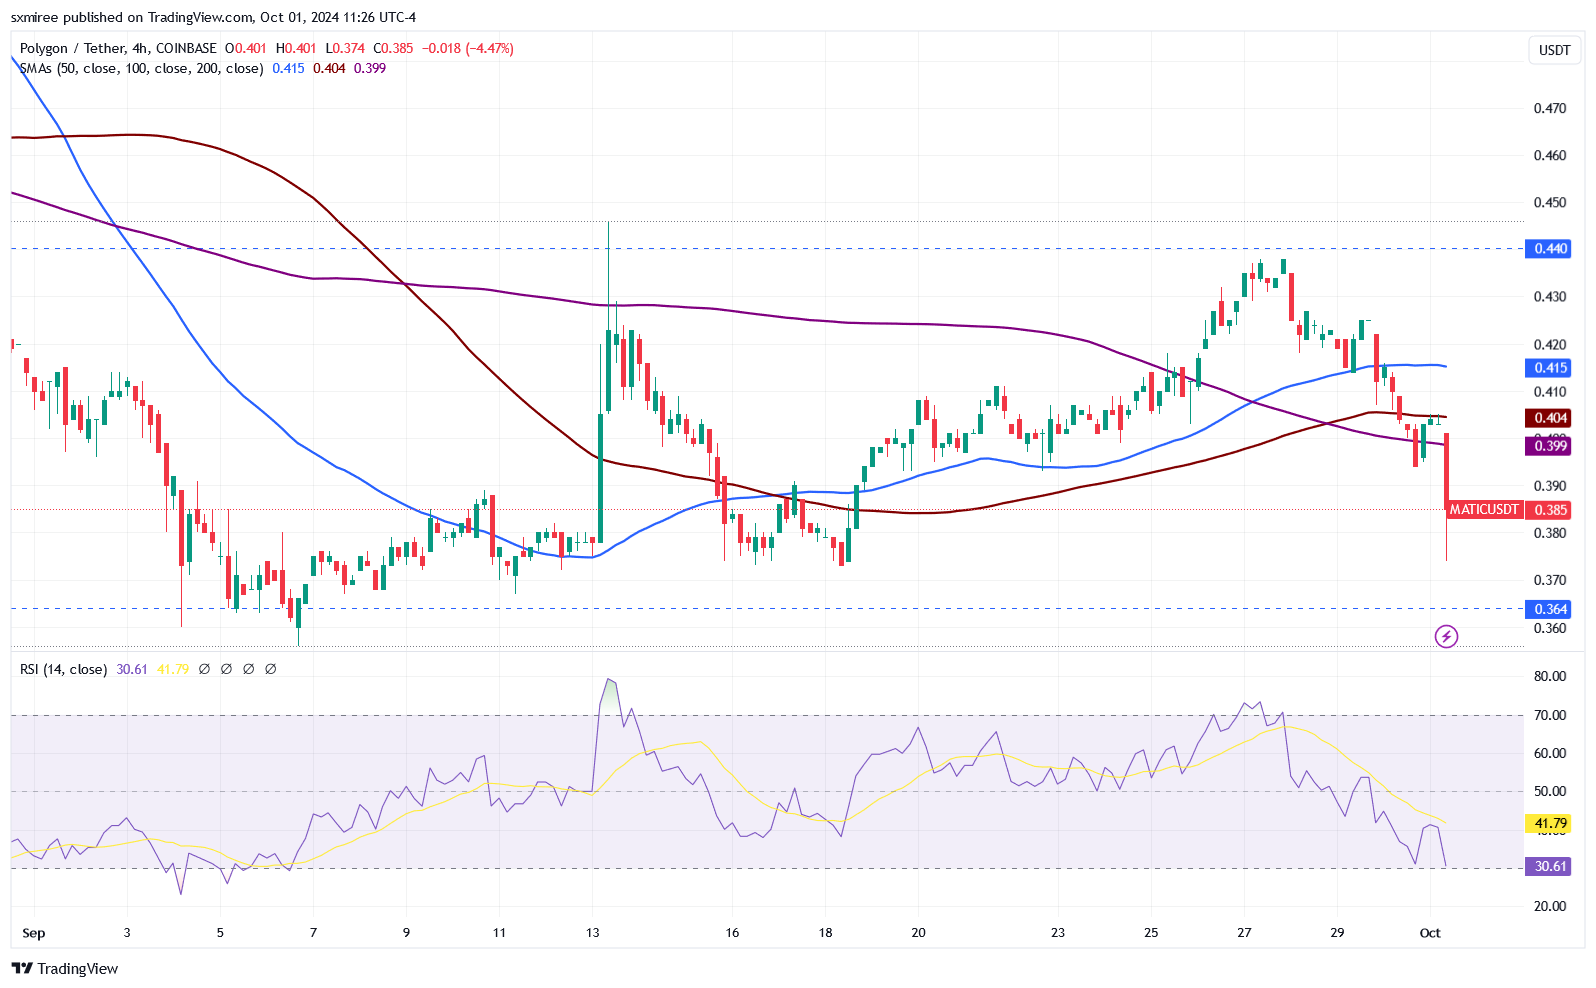
Source: TradingView
The 200-day Simple Moving Average (SMA) fell below the 100-day SMA on September 28, following a similar move below the 50-day SMA a day earlier.
These crossovers indicate weakening momentum and suggest that POL price will likely remain under downward pressure in the near term.
Is your portfolio green? Check out the POL Profit Calculator
In the previous instance of such a bearish crossover formation, the rising 50-day SMA crossed above a flat 200-day SMA on 24th August. The 100-day, also trending upwards then, crossed above the 200-day three days later on 27th August.
The crossover heralded a POL price slump as the token’s price fell from $0.576 on August 24 to $0.415 on August 30.