
- MATIC’s price dropped by more than 2% in the last 24 hours.
- Though selling pressure was low, other metrics looked bearish.
After a comfortable rise last week, Polygon’s [MATIC] daily chart turned bearish. But investors shouldn’t worry yet, as MATIC was exiting a bullish pattern on its price chart at press time.
Therefore, AMBCrypto checked MATIC’s metrics to find out whether the token could reach its 2023 high in the coming weeks.
Polygon exits from a bull pattern
Investors did make a profit last week as Polygon’s value surged by more than 4%. However, the scenario changed in the last 24 hours, as its price declined by 2% according to CoinMarketCap.
At press time, it was trading at $0.9802 with a market capitalization of over $9.4 billion.
Meanwhile, World of Charts, a popular X (formerly Twitter), recently posted a tweet highlighting the fact that MATIC was exiting from a bullish triangle pattern.

Source: X
AMBCrypto then checked MATIC’s liquidation heatmap to see which resistance zones Polygon might face in the short term.
The possibility of MATIC facing strong resistance near $1.11 seemed high, as liquidation might increase sharply at that level. A hike in liquidation might put selling pressure on it and, in turn, push its price down.

Source: Hyblock Capital
Is a rally inevitable?
To better understand whether investors should expect a bull rally from MATIC, AMBCrypto analyzed its metrics. As per CryptoQuant’s data, MATIC’s exchange reserve was decreasing at press time.
This was a typical bull signal, as it indicated that selling pressure was low. However, the rest of the metrics looked concerning.
For example, the token’s MVRV ratio dipped over the last week. Its supply held by top addresses also remained flat, meaning that the whales are not accumulating MATIC.
Additionally, MATIC’s network activity also somewhat declined last week, as evident from the marginal drop in its daily active addresses.
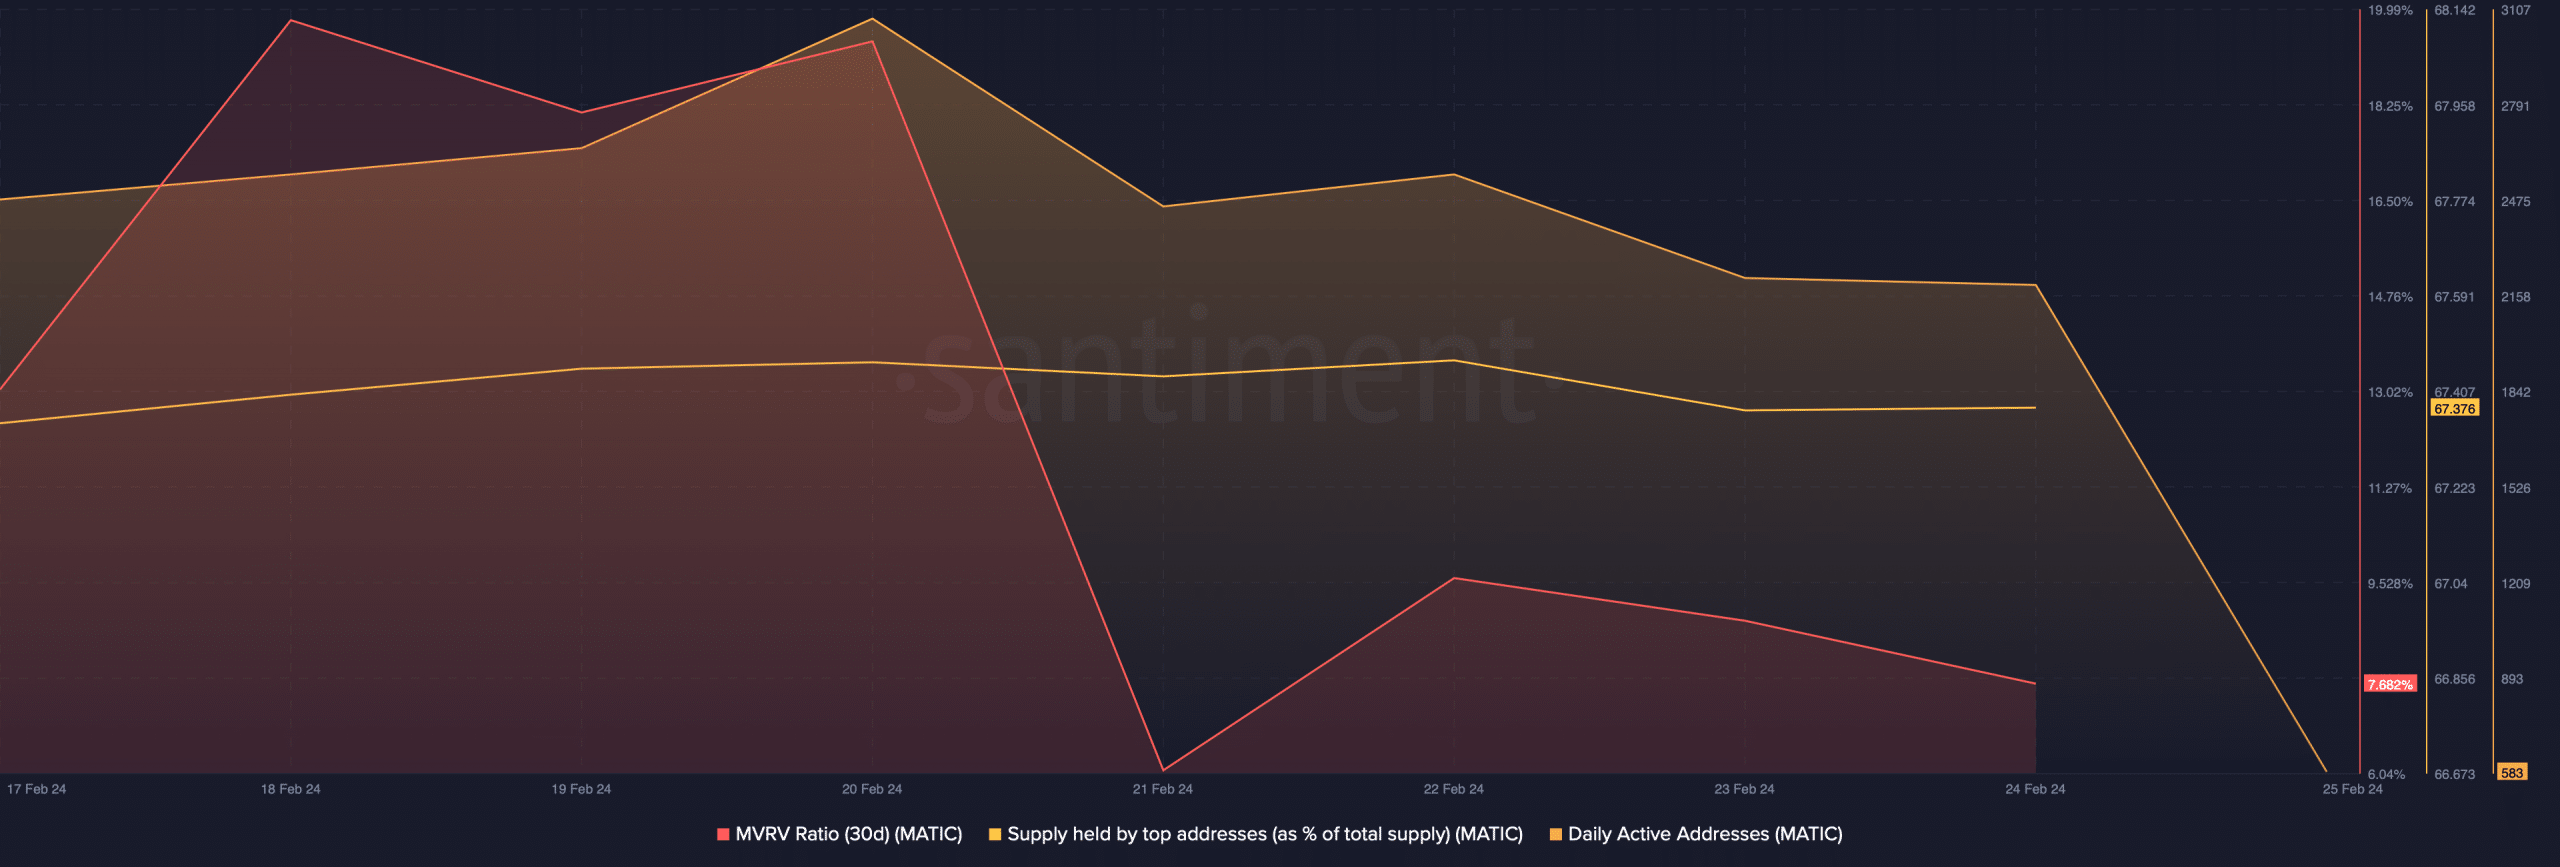
Source: Santiment
The technical indicator MACD displayed the possibility of a bearish crossover. Polygon’s price also touched the upper limit of the Bollinger bands, causing its price to drop slightly.
Is your portfolio green? Check out the MATIC Profit Calculator
Nonetheless, the Money Flow Index (MFI) remained well above the neutral mark.
MATIC’s price was still above its 20-day simple moving average (SMA) at the time of writing, which could act as a key support and help MATIC rebound.
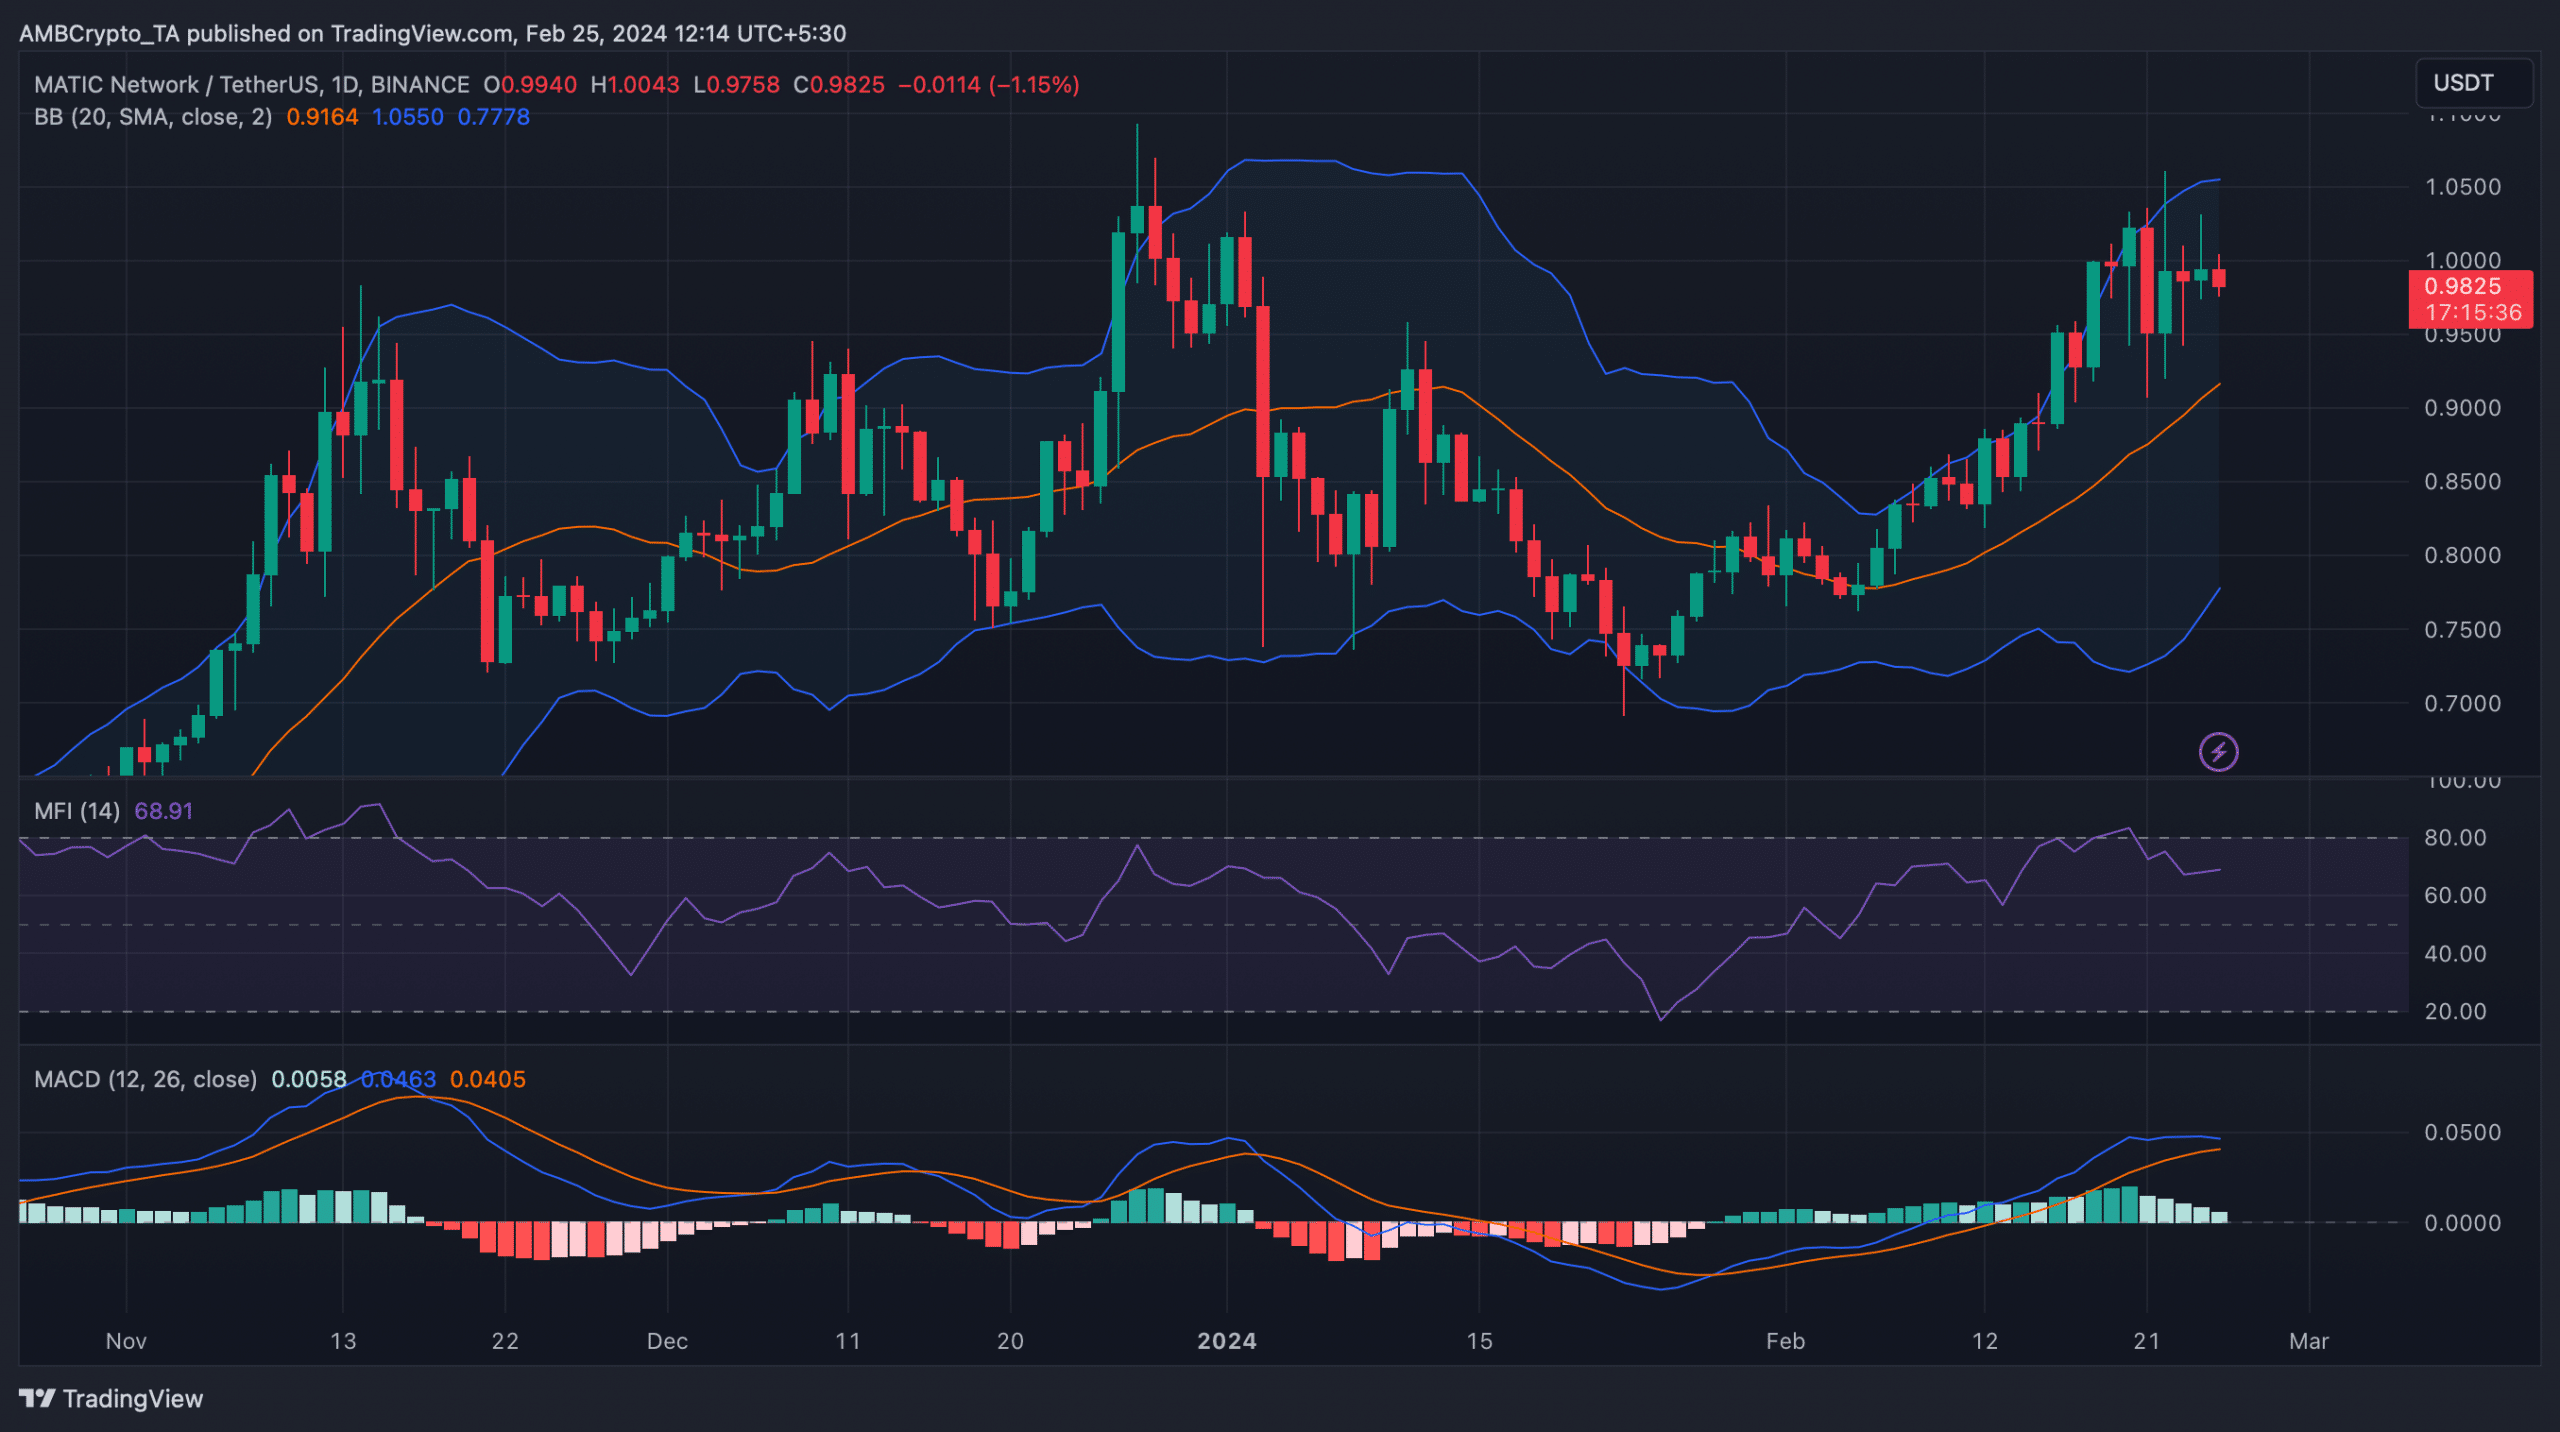
Source: TradingView