Disclaimer: The information presented does not constitute financial, investment, trading, or other types of advice and is solely the writer’s opinion
- MATIC hit the overbought zone on the lower timeframe chart.
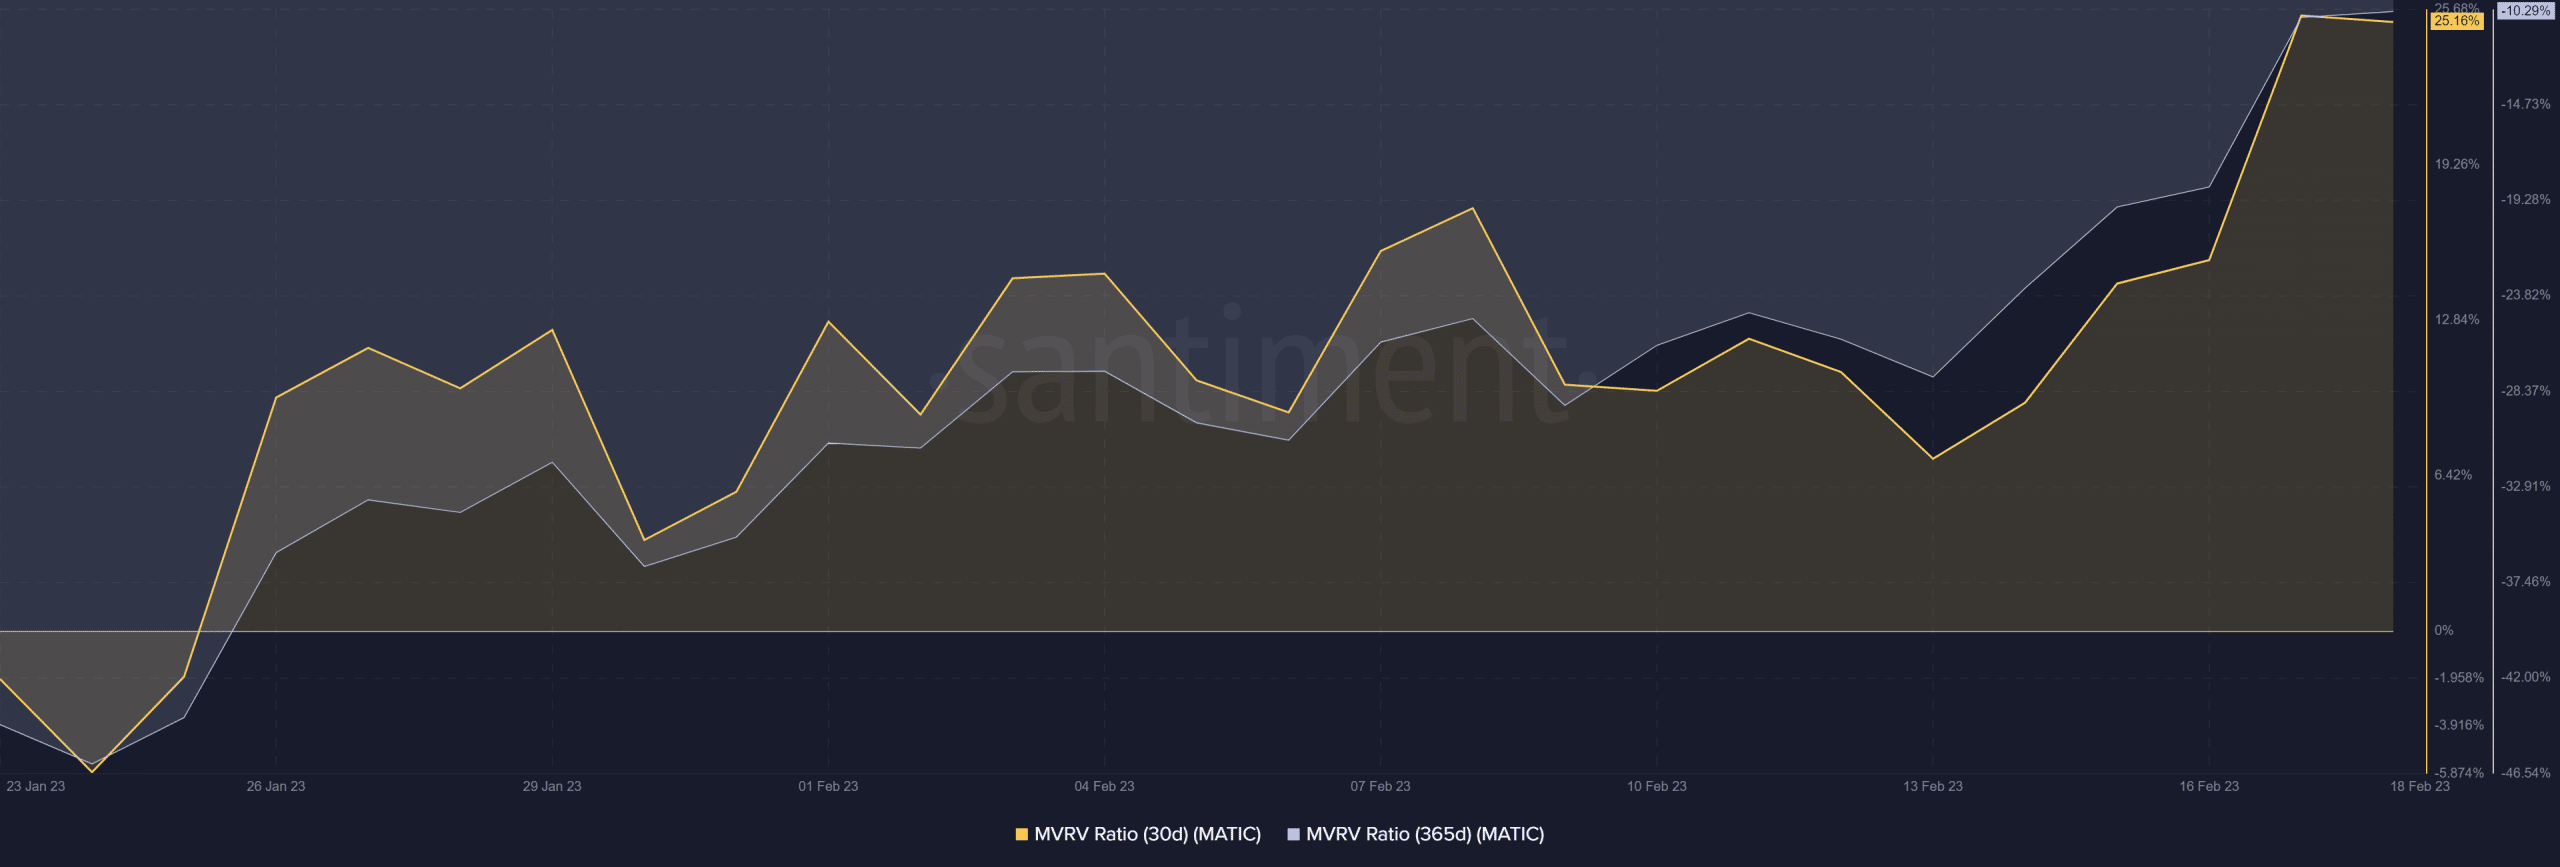
- Monthly holders saw gains jump from 7% to 25% at press time.
Polygon’s [MATIC] recent rally is a win for every investor. But short-term holders outperformed long-term holders in the recent hike.
MATIC posted over 20% and 7% in the past seven days and 24 hours, respectively. But long-term holders were still in losses.
Read Polygon’s [MATIC] Price Prediction 2023-24
MATIC formed a bearish order block: Will the momentum slow down?
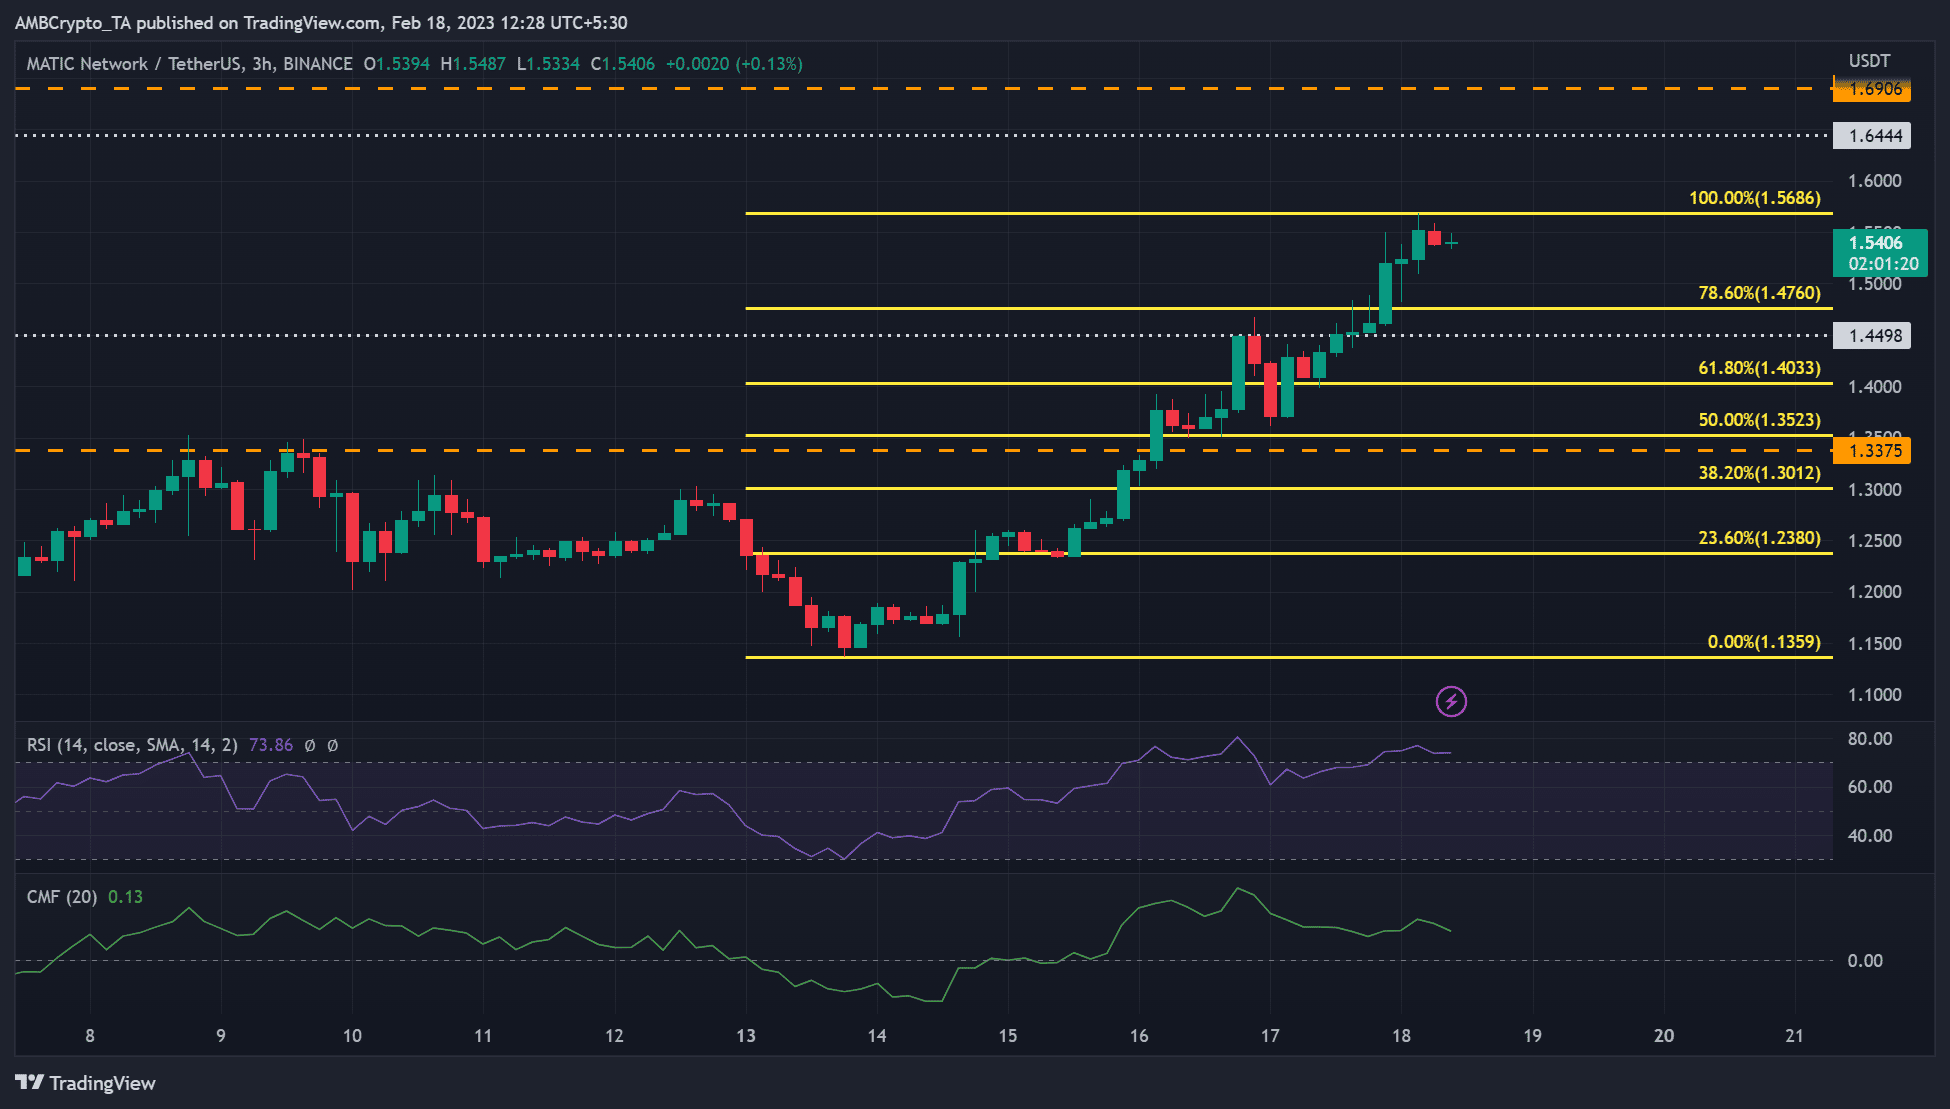
The three-hour chart showed a strongly bullish MATIC with an RSI value of 73. But the value is also in the overbought zone, which makes MATIC ripe for a price reversal. In addition, the Chaikin Money Flow (CMF) moved southwards, showing a weakening short-term market structure.
Short-term sellers could target the 78.6% Fib level of $1.4760 or $1.4498 support level, especially if BTC breaks below the $24.42K level.
How much is 1,10,100 MATICs worth today?
The bearish thesis will be invalid if MATIC clears the bearish order block and closes above the 100% Fib level of $1.5686. Such an upswing will allow short-term bulls to profit at $1.6444 or $1.6906.
A CMF break below the zero line would give bears more leverage. However, a rebound from the level would reinforce the bullish structure.
Short-term holders saw gains, but long-term holders struggled to recover losses
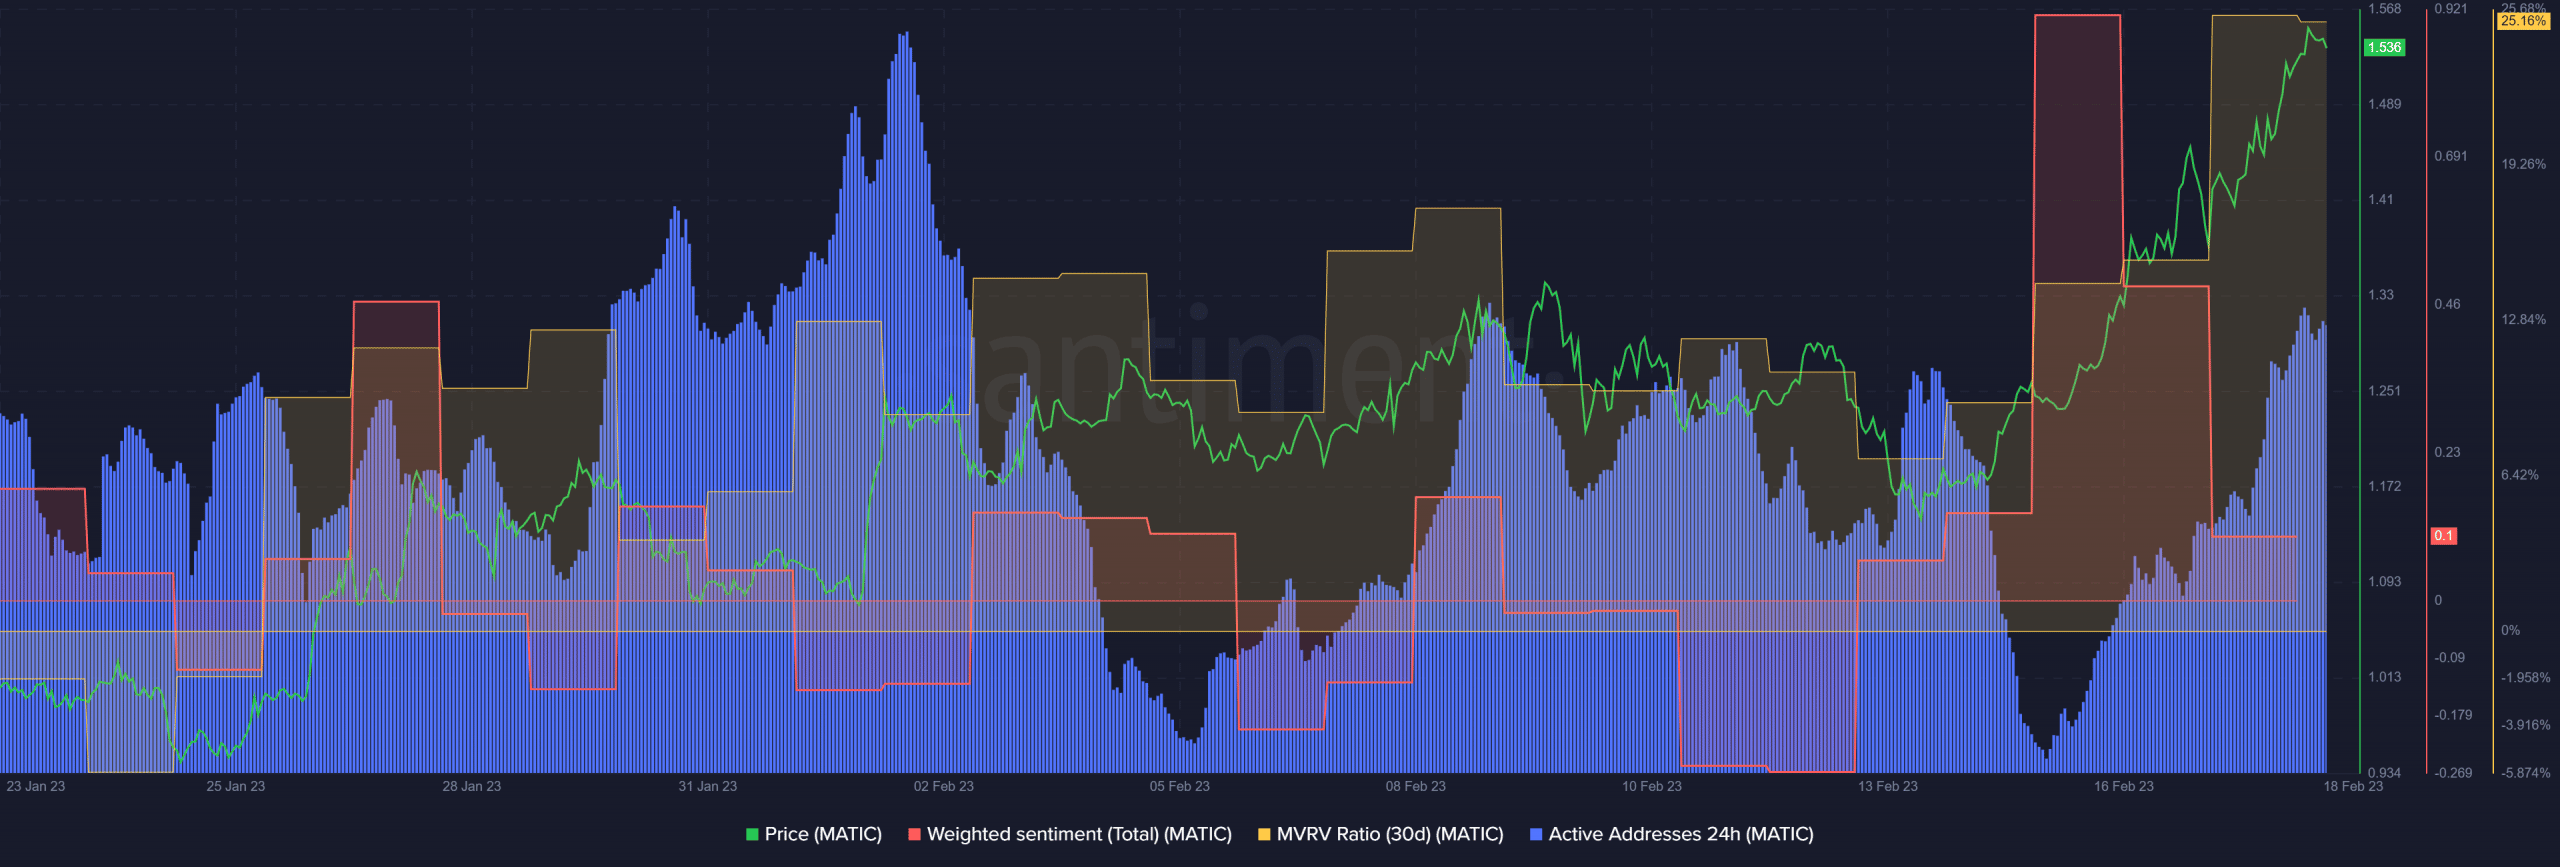
MATIC’s weighted sentiment sharply dropped following BTC’s unexpected fall from the $25K level. But the sentiment remained positive; thus, bulls could attempt an extra rally. In addition, MATIC saw increased active addresses, which could boost buying pressure and the uptrend.
However, monthly holders saw positive profits from 7% to about 25% by press time, as shown by the 30-day MVRV (Market Value to Realized Value).
In contrast, long-term holders were struggling to recover losses. Long-term holders were at -10%, as shown by the 365-day MVRV, indicating that they were yet to post gains despite the recent rally.