
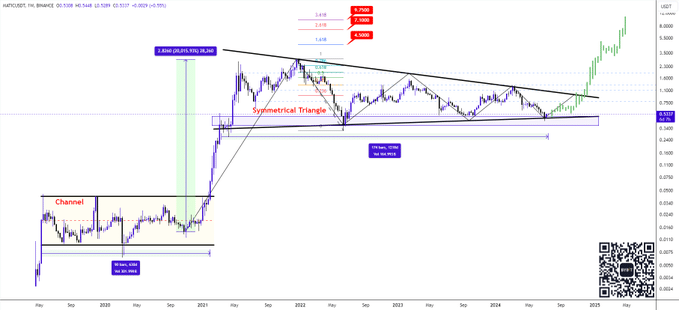
- Polygon’s symmetrical triangle phase hints at a bullish breakout, targeting $4.5 to $9.75.
- Despite recent bearish signals, Polygon’s 24-hour trading volume and TVL reflect strong user engagement.
Polygon [MATIC] has been displaying noteworthy technical patterns and market movements. Recently, crypto analyst Alex Clay noted an accumulation phase, suggesting potential high returns.
The historical performance of Polygon includes two accumulation phases. The first was a 630-day long channel accumulation, which led to an impressive 20,000% return. This phase marked a dramatic breakout, establishing a strong foundation for MATIC’s growth.
Source: X
Currently, MATIC is in a 1218-day long symmetrical triangle accumulation phase. This pattern indicates a potential bullish breakout, similar to the previous phase.
Alex Clay stated,
“Now we have 1218 Days Long Symmetrical Triangle Accumulation. These are the targets that must be hit: $4.5 – $7.1 – $9.75.”
Polygon’s market capitalization stood at $4.94 billion at press time, with a fully diluted valuation of $5.32 billion. The 24-hour trading volume was $305.77 million, indicating active trading and liquidity.
Furthermore, the Total Value Locked (TVL) was $11.50 billion, reflecting substantial user engagement and trust in the platform.
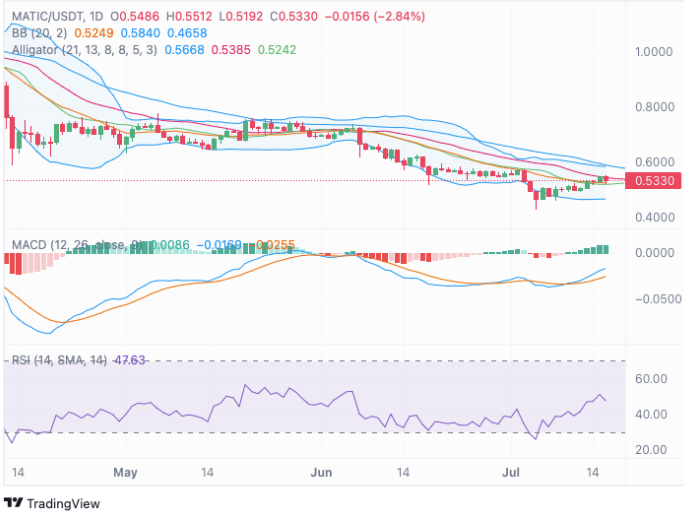
MATIC technical analysis
The technical analysis of MATIC shows mixed signals. The Bollinger Bands showed that the price was trading below the middle band, suggesting a bearish trend.
The MACD line was below the signal line, indicating bearish momentum. However, the histogram is slightly positive, suggesting weak buying pressure. If the MACD crosses above the signal line, it could indicate a potential bullish reversal for MATIC.
Source: TradingView
At press time, the RSI was at 46.73, below the midpoint of 50, indicating bearish sentiment. It is not in the oversold territory, suggesting more room for a downtrend. Significant buying could push the RSI into a bullish zone.
The Alligator indicator shows the lips below the teeth and jaw, indicating a prevailing downtrend. The lines are converging, suggesting a potential pause or change in trend.
Meanwhile, active addresses have dropped to approximately 8,392, while transaction counts have decreased to around 1,554. This downward trend indicates reduced network activity and engagement over the past few months.
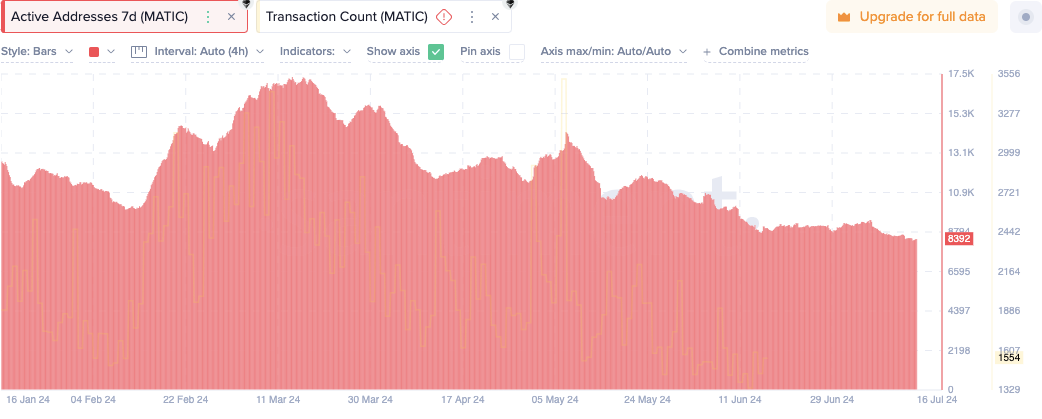
Source: Santiment
Read Polygon’s [MATIC] Price Prediction 2024-2025
Polygon’s price has experienced fluctuations, peaking around $0.555 before declining to approximately $0.525 and stabilizing around $0.53.
At the time of writing, MATIC was trading at $0.5284, indicating a 0.96% price decline in the last 24 hours but a 6.03% price increase over the past seven days.