
Analyzing if Litecoin [LTC] can breach $137 and trigger a squeeze

- Polygon saw a sharp increase in Open Interest as speculators clamored to participate in the bullish move.
- The failure to break the weekly structure suggested the bears might be dominant hereon.
The price of Polygon [MATIC] soared last week and established a strong short-term uptrend. The local resistance at $0.43 was decisively broken and the bulls were strong enough to drive a rally to the higher timeframe resistance zone at $0.58.
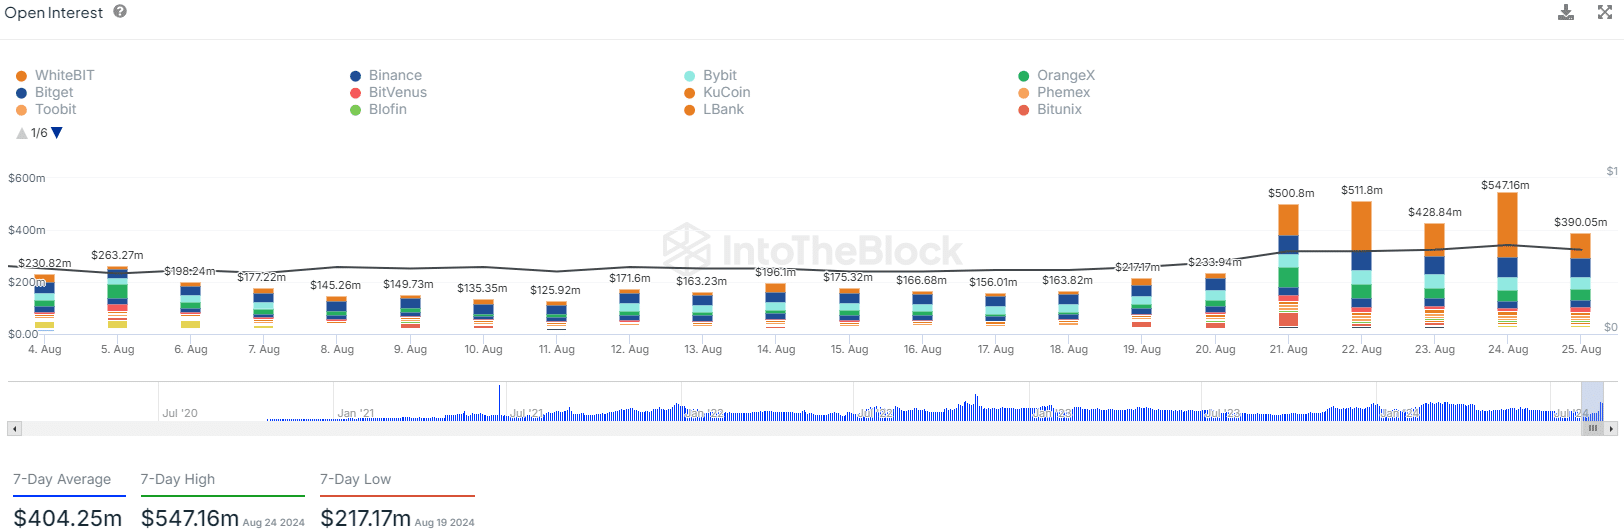
Source: IntoTheBlock
This price move was accompanied by the Open Interest doubling to indicate high bullish sentiment. Since then, the price has fallen by 7.5% after reaching a local high at $0.5819, and the OI fell alongside.
A recent report noted that plenty of MATIC investors were still at a loss- and this was true for short-term holders too.
Market participants might hinder continued MATIC gains
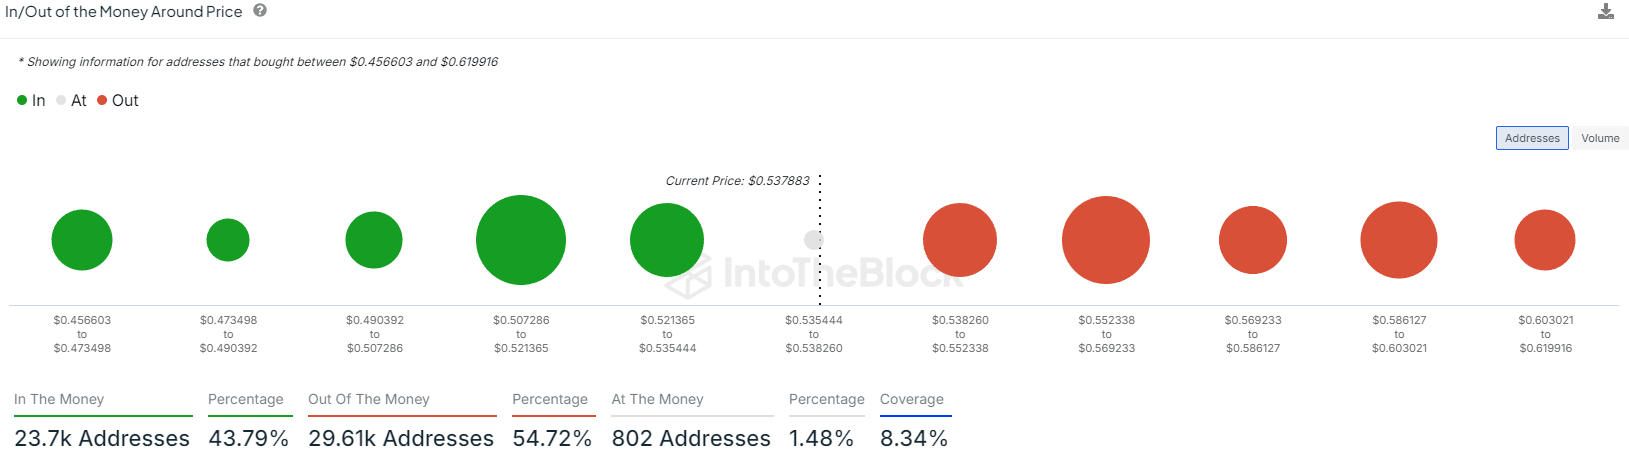
Source: IntoTheBlock
The local in/out of the money data showed that 54.72% of addresses that bought MATIC between $0.456 and $0.62 were at a loss.
This meant that a price bounce to the $0.552-$0.569 region for instance would lead to a wave of selling as underwater holders look to exit at break even.
To the south, the psychological $0.5 region is likely to see increased buying activity.
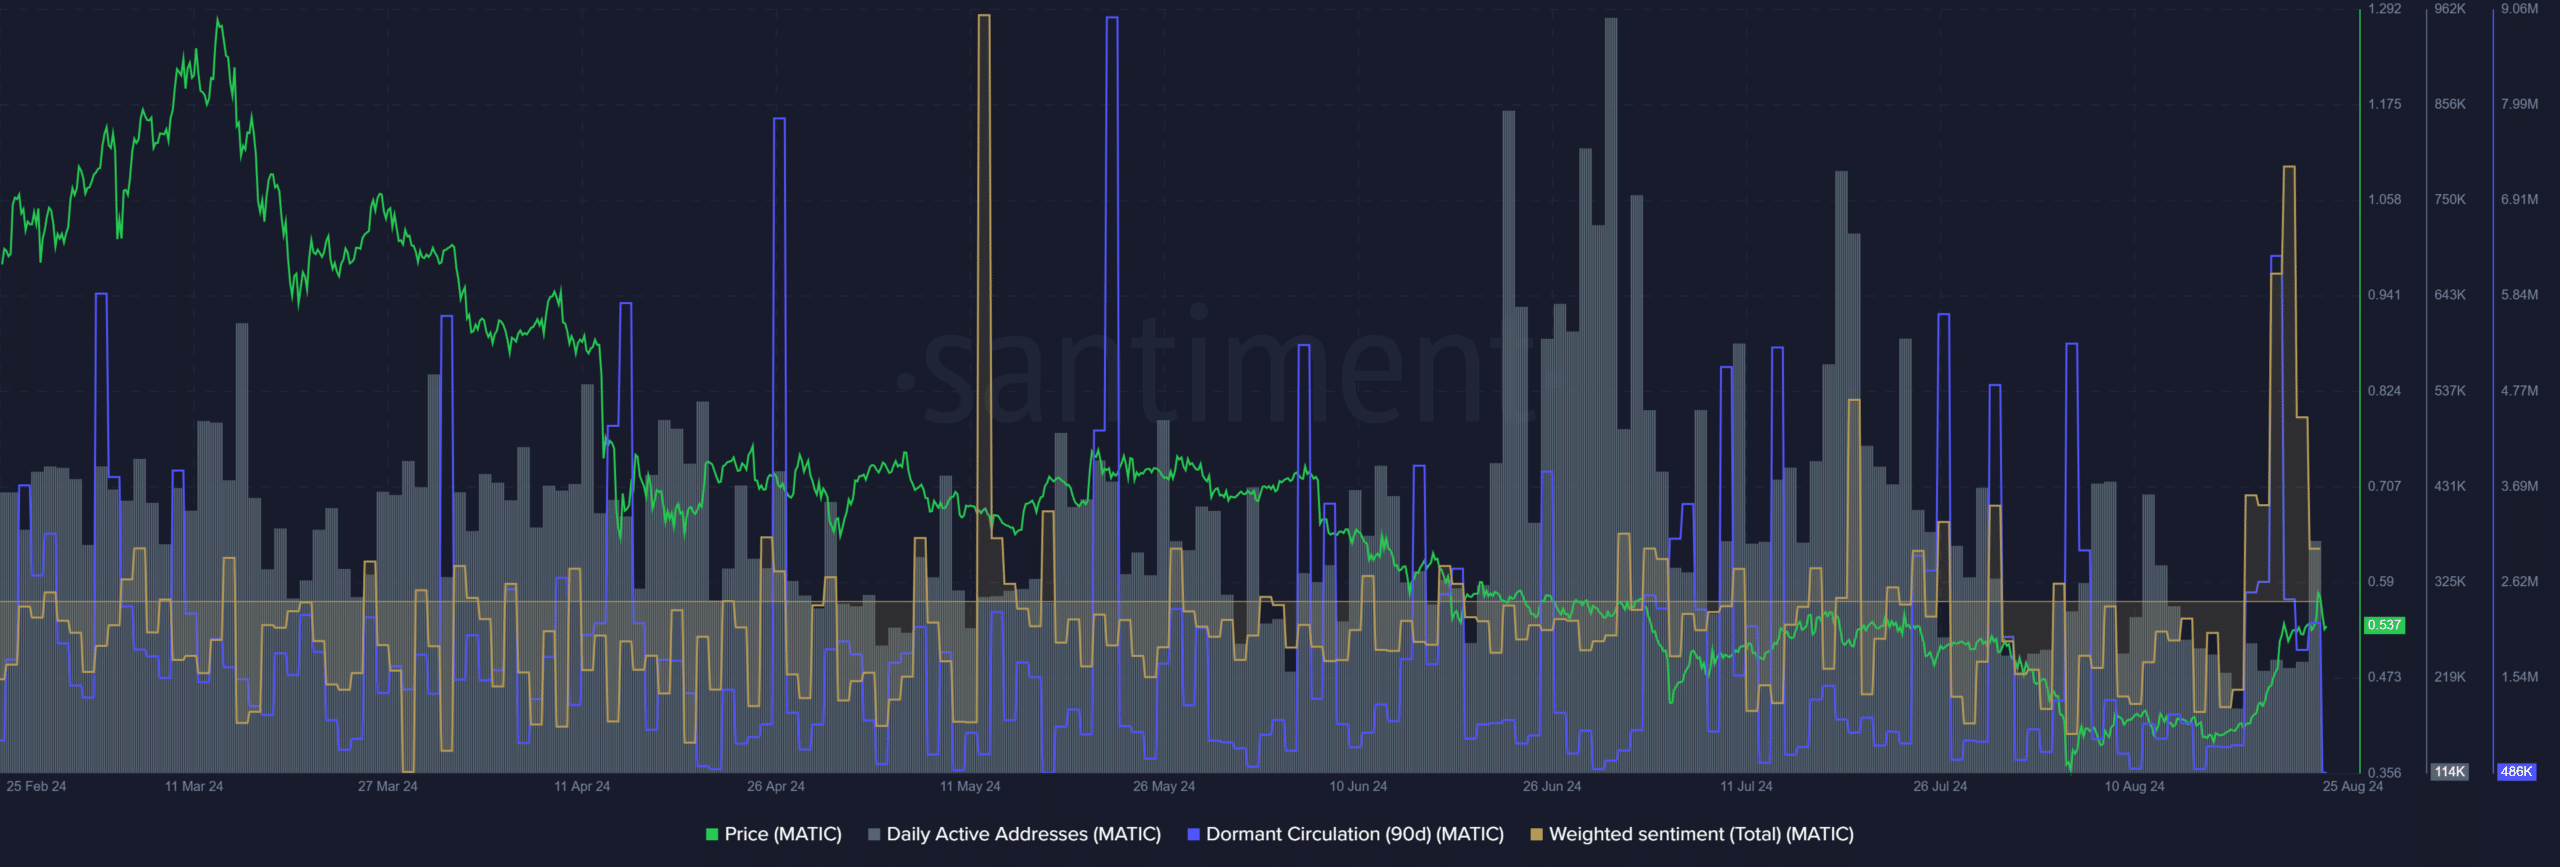
Source: Santiment
AMBCrypto found that the daily active addresses metric has trended downward over the past month. This indicated reduced network adoption and demand for the token.
The price surge meant the weighted sentiment had reached its highest point since May, but another metric served as a warning to buyers. The dormant circulation skyrocketed on Wednesday, the 21st of August.
Usually, a flurry of token movement on this scale implies a wave of selling activity was nearby. Such a selling wave may materialize soon and push prices lower.
Another reason MATIC’s uptrend might be exhausted
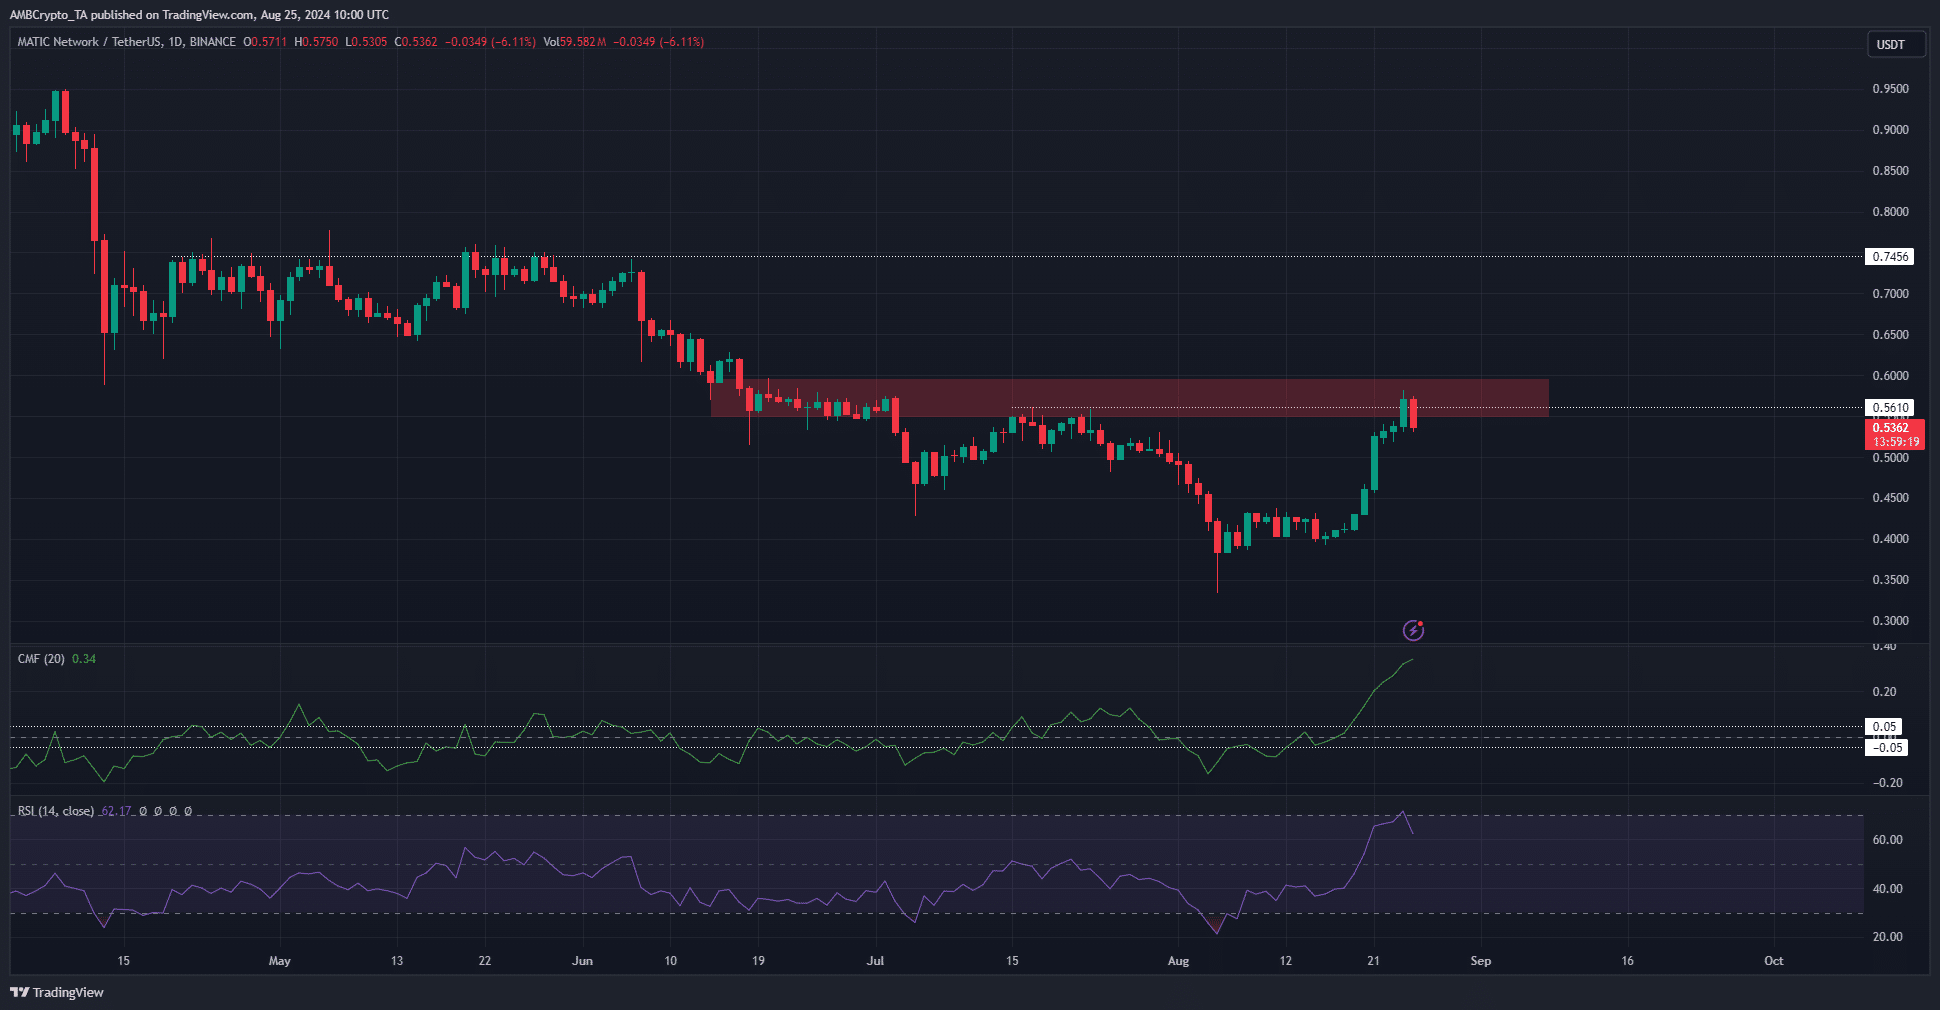
Source: MATIC/USDT on TradingView
The daily chart showed that the market structure was bullish after the recent move. The indicators were also in favor of the buyers.
Realistic or not, here’s MATIC’s market cap in BTC’s terms
But the $0.56-$0.58 zone was a key weekly resistance that MATIC faced rejection at in recent hours.
The market has shown its hand, and prices will likely consolidate around $0.56-$0.58 in a distribution phase before a move south toward $0.5 or $0.45 occurs.


