- Popcat’s $1 breakthrough sparks speculation of a 26% surge, with key resistance at $1.05.
- Bullish signals suggest Popcat could push to $1.3350, but mixed volume data keeps traders cautious.
Popcat [POPCAT] has surged past the critical $1 mark, with its market cap now surpassing $1 billion. POPCAT is attracting attention due to increased trading activity, which reached a 24-hour volume of $153 million.
Despite recent volatility, Popcat has shown resilience, although the price has declined slightly by 1.02% over the last 24 hours, per Coingecko.
Popcat’s market momentum comes as traders monitor its potential for further gains. The current market environment suggests that the coin is eyeing a breakout from its $0.90 – $1 resistance zone, which aligns with a technical pattern that could signal further upward movement.
Inverse head and shoulders pattern indicates bullish reversal
The POPCATUSD chart displays a clear inverse head-and-shoulders pattern, a bullish technical indicator suggesting a potential reversal. The neckline, which is positioned around $1.05, has become a critical resistance point.
If the price manages to break above this level, it could trigger a strong upward move toward the next target of $1.3350, representing a possible 26% price surge.
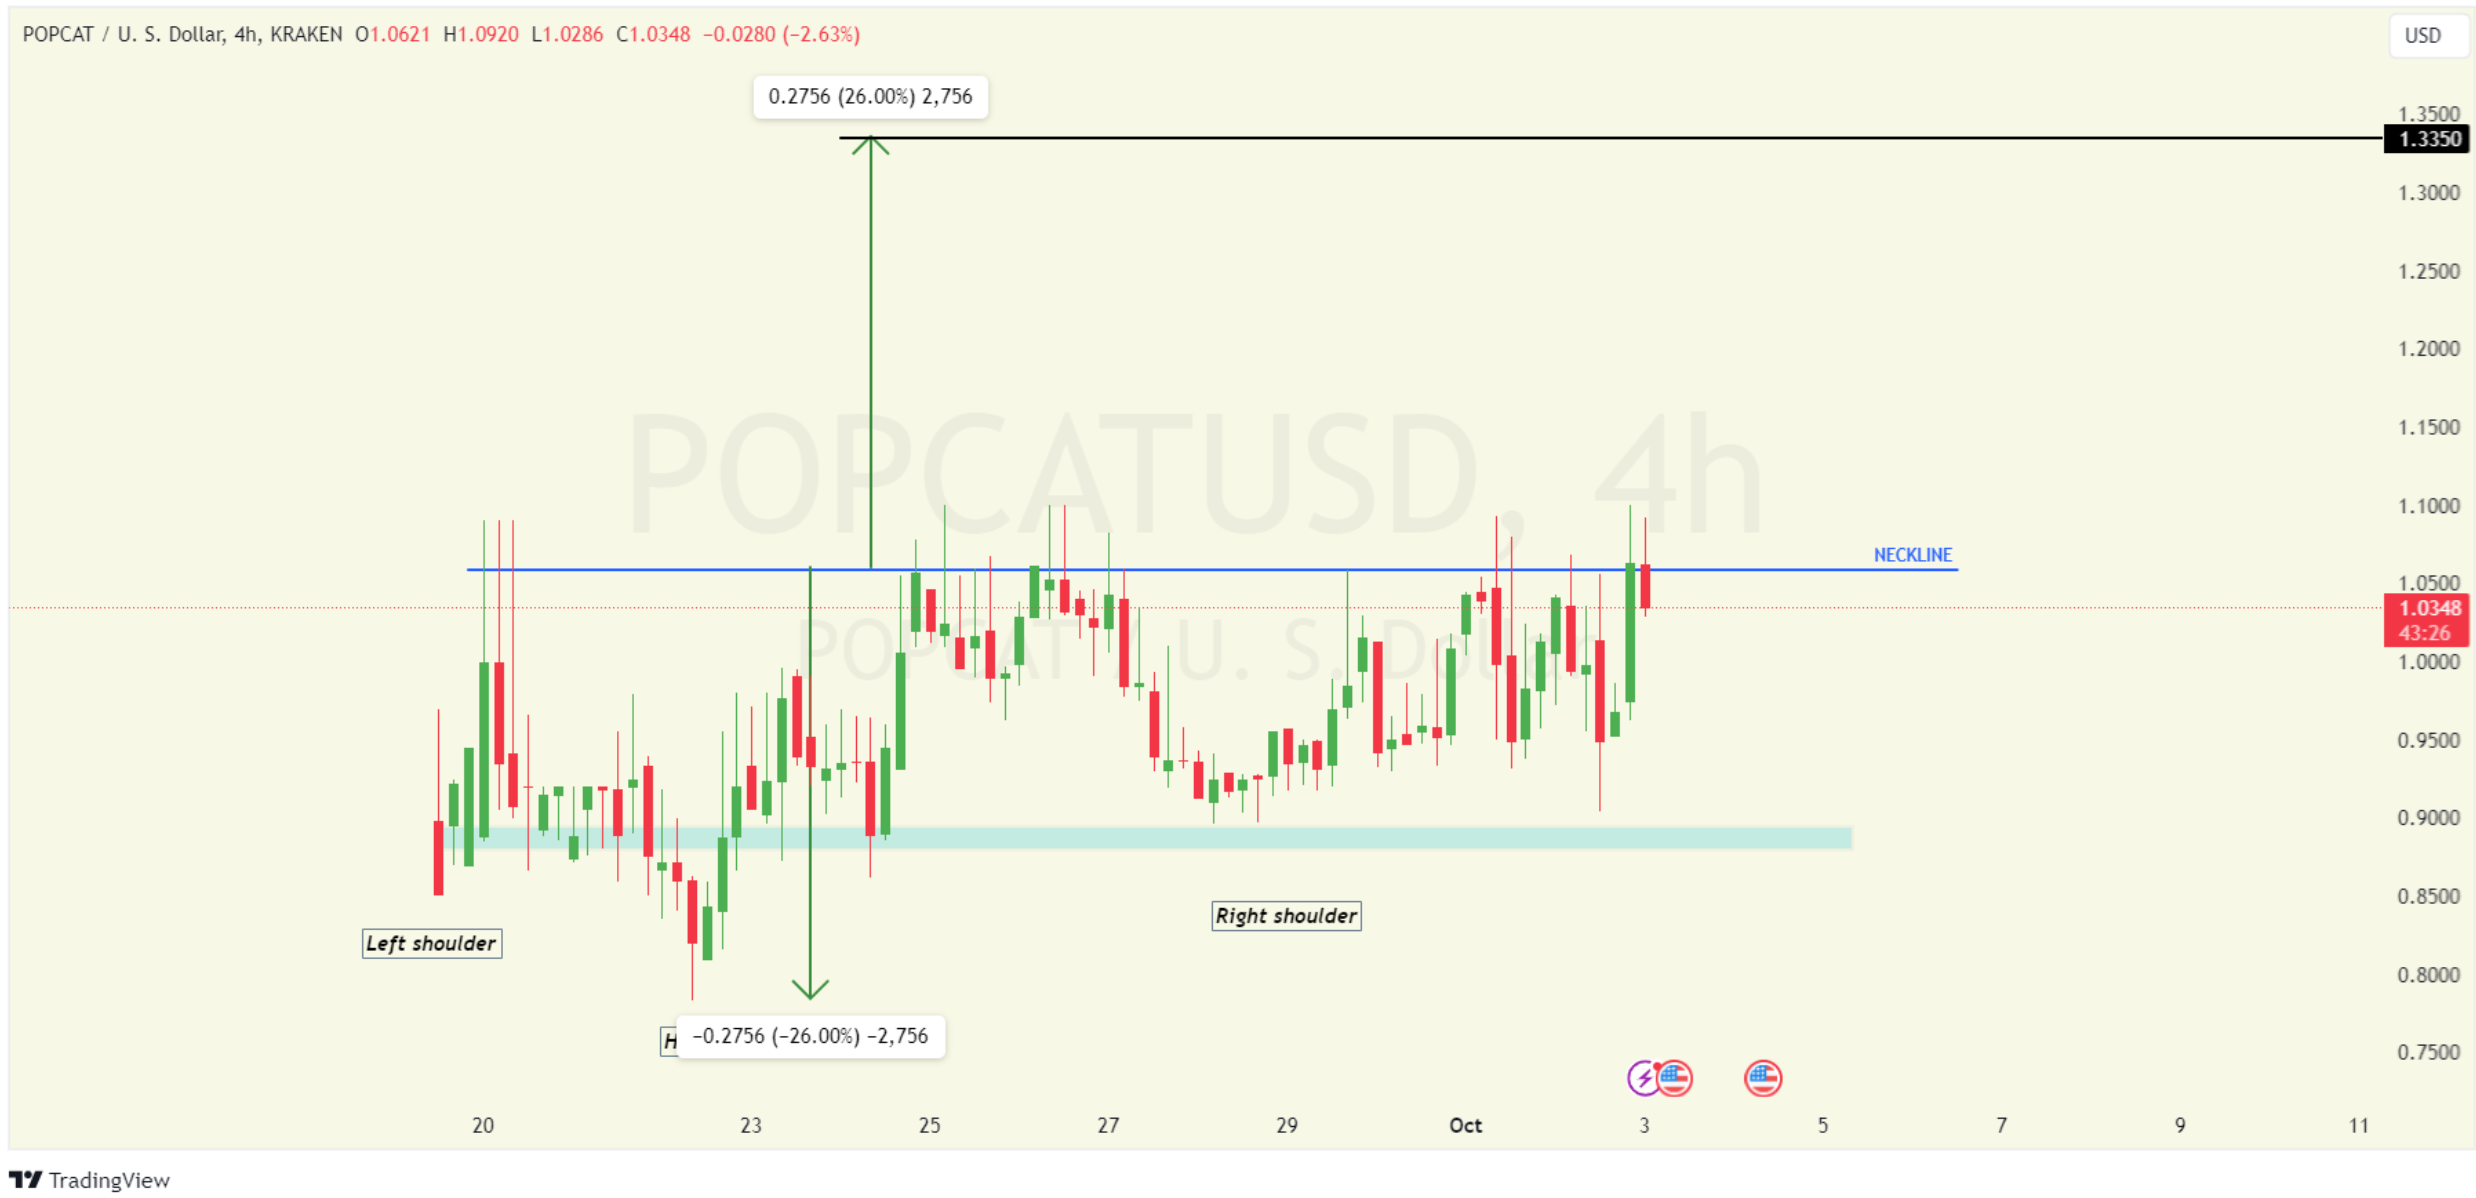
Source: TradingView
However, if the price fails to break the neckline, key support lies around $0.90, the point where the right shoulder formed. This level provides a safety net, allowing traders to gauge the risk of a failed breakout.
Should Popcat break through the neckline, traders are eyeing intermediate resistance at $1.20, with the potential for continued bullish momentum toward the $1.3350 target.
POPCAT indicators suggest further upside potential
Meanwhile, the Bollinger Bands indicate mild volatility in the market, with the price touching the upper band near $1.0680, signaling potential short-term overbought conditions.
A pullback toward the middle band at $0.9923 could occur if selling pressure increases.
The Relative Strength Index (RSI) stands at 55.61, just above the neutral mark of 50, suggesting a moderately bullish sentiment. The RSI is not yet in overbought territory, which means there is still room for further price appreciation if buying pressure continues.
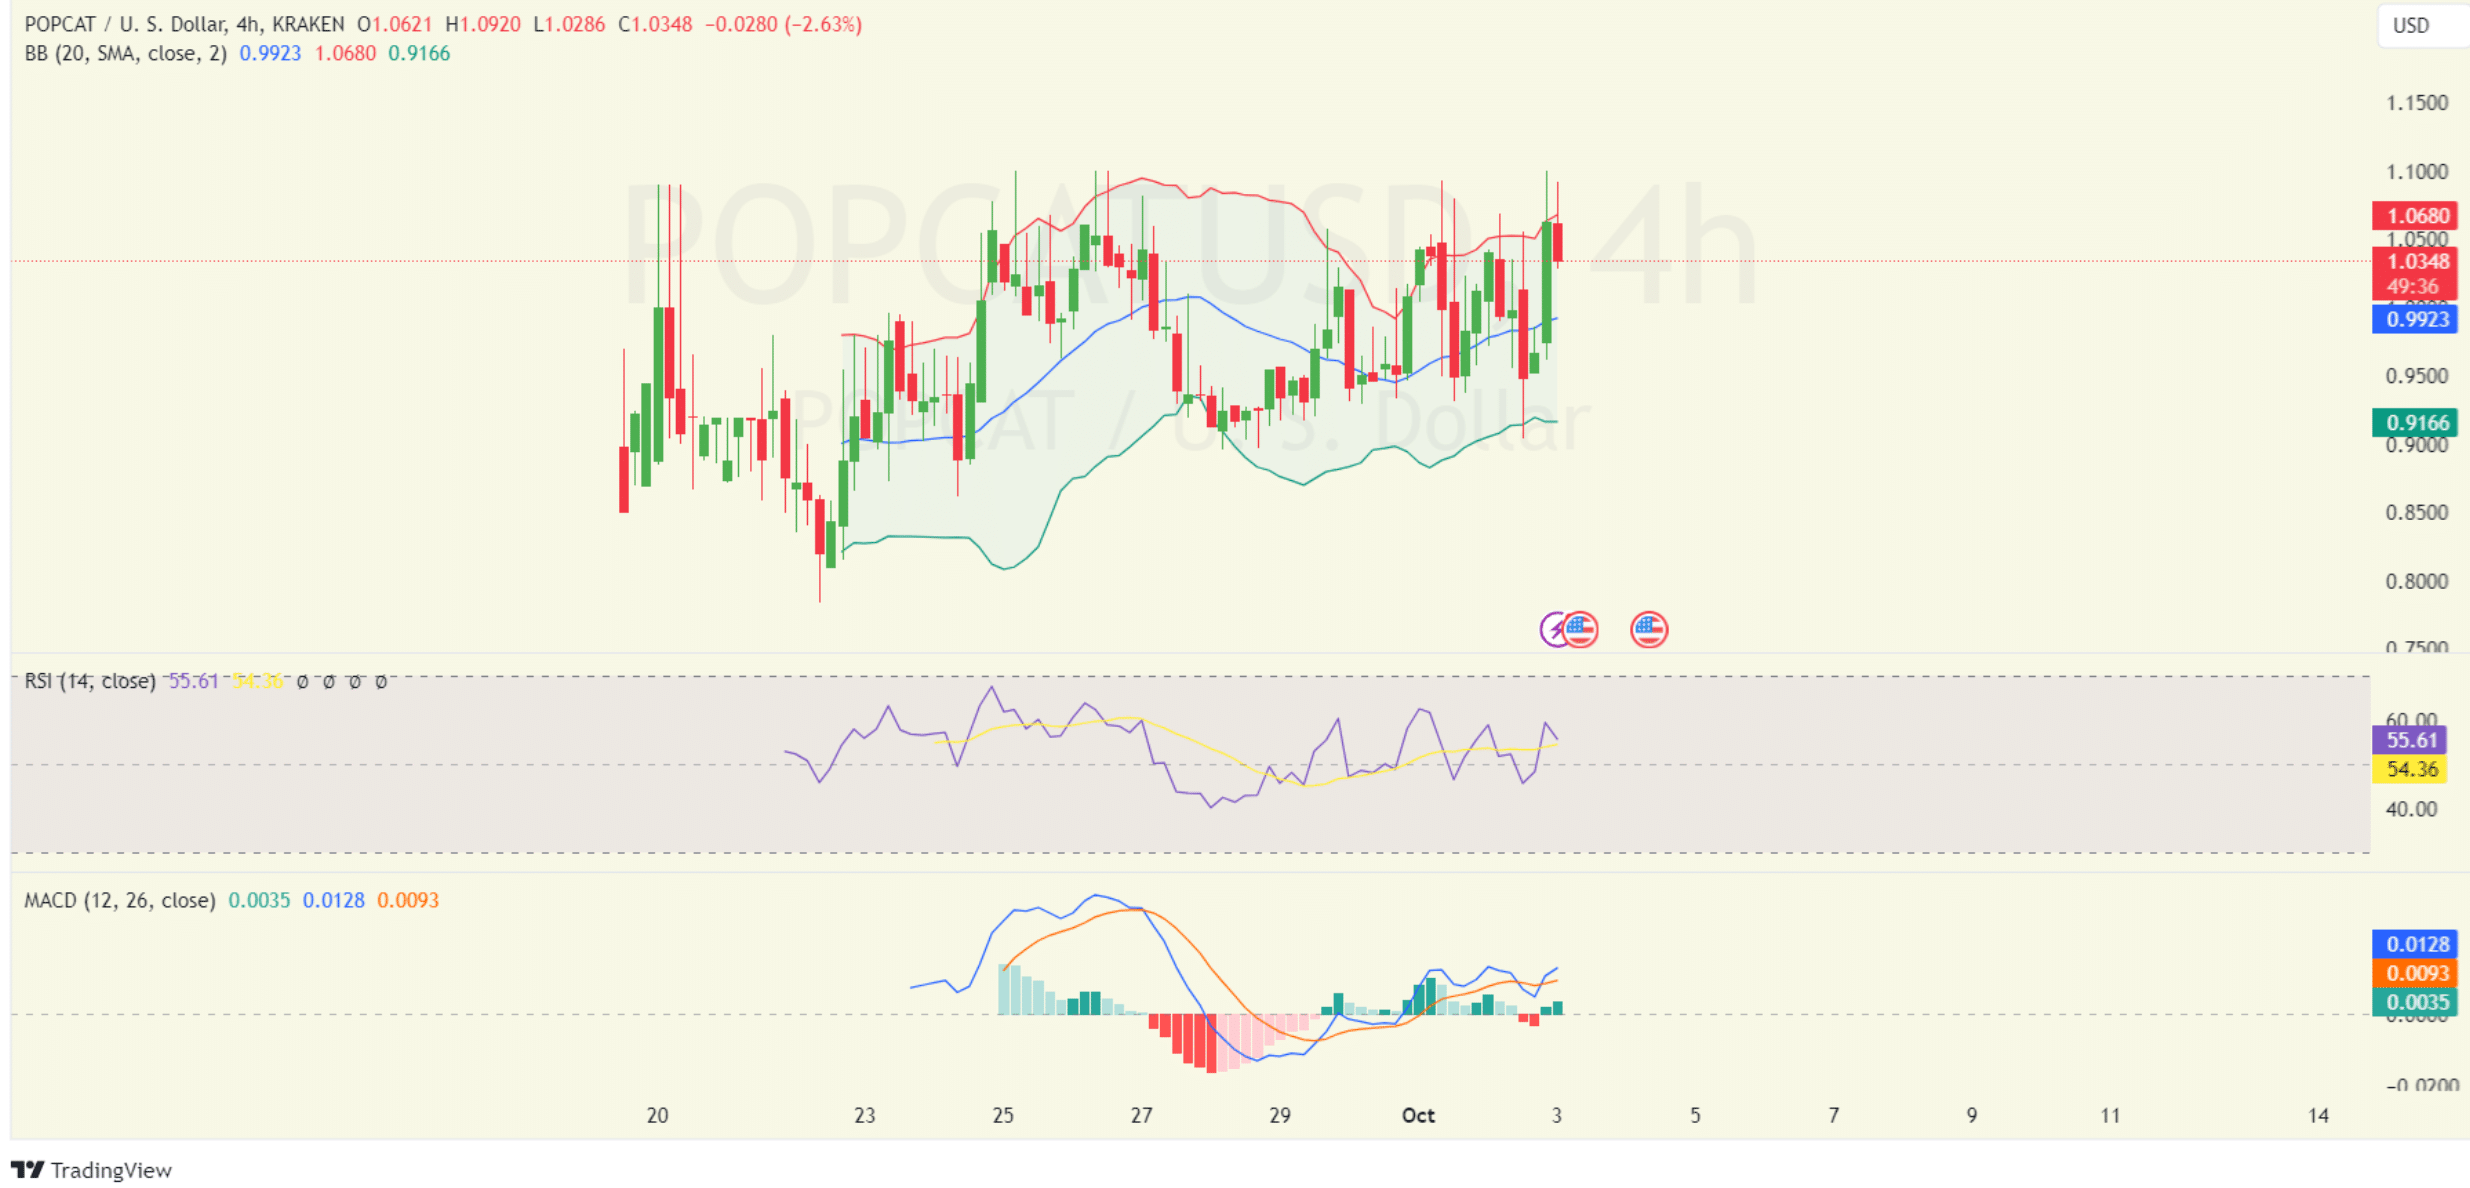
Source: TradingView
The Moving Average Convergence Divergence (MACD) indicator shows a recent bullish crossover, with the MACD line crossing above the signal line, suggesting potential upward momentum.
The histogram has started printing green bars, indicating early bullish momentum. However, traders will be monitoring whether this trend gains strength or fades in the coming days.
Is your portfolio green? Check out the POPCAT Profit Calculator
While technical indicators are pointing toward potential gains, coinglass data shows that Popcat’s volume has decreased by 9.75%, bringing the total volume to $954 million, while open interest has increased by 3.94% to reach $143 million.
These mixed signals indicate that traders remain cautious but are open to potential upward movements as the coin approaches key resistance levels.