Merge track: ETH’s grim on-chain metrics ft. a surprising uptick

Following the broader market cues, the largest altcoin Ethereum had a good rally in July. However, the scenario seems to be changing for ETH now.
With the upcoming Merge, investors across the Ethereum network are excited. Ethereum has surpassed all speculations, FUD with the backing of Merge is a matter of contemplation.
But one wonders if investors are bullish on ETH ahead of the much-anticipated transition from PoW to PoS consensus mechanism?
Hiccups, errors, and more
Over the last 24 hours, more than 57,000 traders have been liquidated in the crypto market. This has led to a total of $150 million in assets liquidated over the last day. The most prominent of these has been the Ethereum liquidations.
As ETH traders await the September proof-of-stake consensus mechanism transition, there are still hints of uncertainty- such as negative sentiment and Ethereum’s percentage of coins sitting on exchanges as highlighted in Santiment’s tweet below.
📊 As #Ethereum traders await the September proof-of-stake consensus mechanism transition, there are still hints as to where we go between now & then. Negative sentiment & $ETH shifting to exchanges are a couple things to check out in our latest insight! https://t.co/uOF7h58P3X pic.twitter.com/4RramKIVpW
— Santiment (@santimentfeed) July 26, 2022
Indeed, ETH’s rising supply on exchanges is the key concern at the moment. Even the much-spoken July price surge didn’t quite satisfy investors/traders.
Ergo, they kept their coins in the place which provides ease to execute future sell-offs.
Another worrisome indicator was the DeFi domain. The dominance of DeFi applications has declined from 27.5% to 15.1%.
Glassnode, the analytical platform shared this scenario in the graph below.
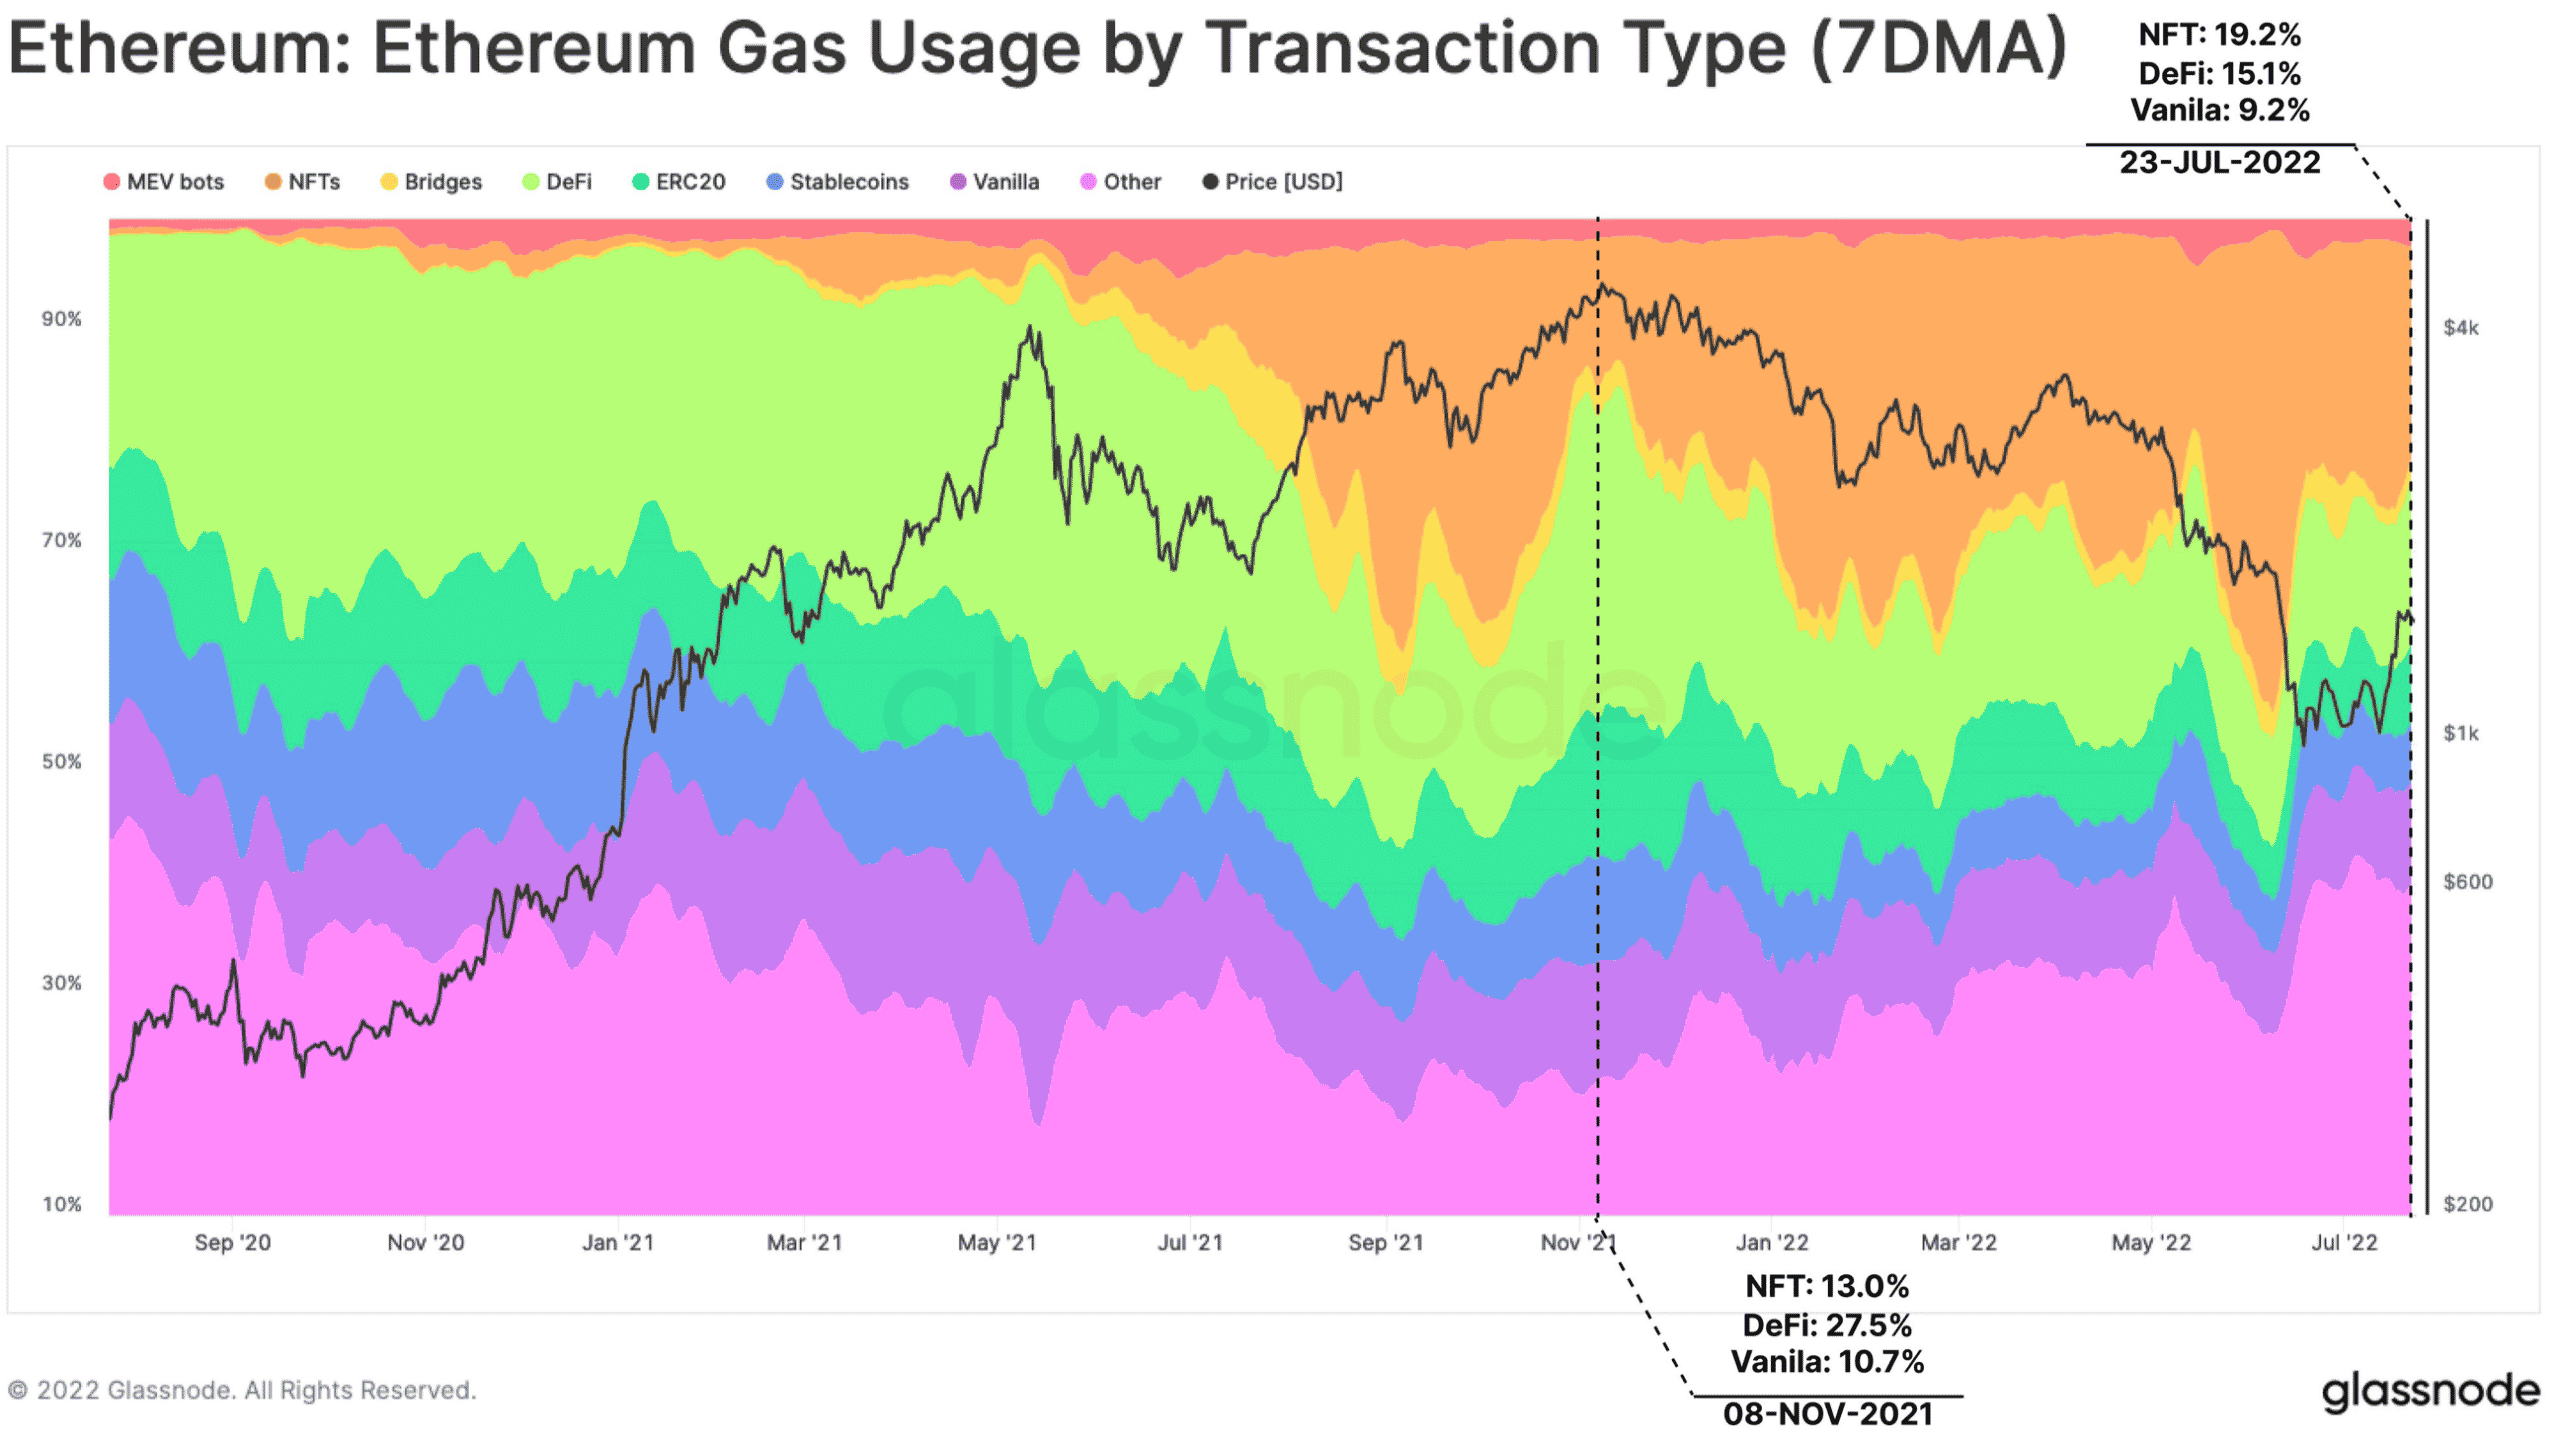
To put this in perspective, Ethereum’s market share of DeFi TVL stood at 100% at the beginning of 2021. However, that figure dropped more than 65% towards the end of the same year. Well, 2022 didn’t favor the bulls much.
Only 6% chances of sunshine
Having said that, the NFT arena did highlight a welcome sign for ETH enthusiasts. ETH’s relative gas consumption dominance by NFT activities grew by 6.2% since November. Thus, showing a continued market preference for NFT transactions.
Furthermore, as per CryptoSlam data, the average sale price for an Ethereum NFT went from $2,463 in May to just $440 at press time, a 71% decrease. So as the crypto bear market continues, NFTs are being purchased for less.

The aforementioned developments did indeed affect ETH’s price. At the time of writing, ETH suffered a fresh 8% correction as it traded around the $1.4k mark. Even ETH holders (0.1+ coins) reached an all-time low of 6,892,910.