Predicting Bitcoin’s bounce: If not $66K, then what?
The Bitcoin liquidation levels showed the long positions far outweighed the short positions, showing the prices could slide lower next.

- Bitcoin is expected to trade within the established range in the weeks after the halving.
- In the near term, the $66.8k level was crucial resistance, and another support level was worth watching.
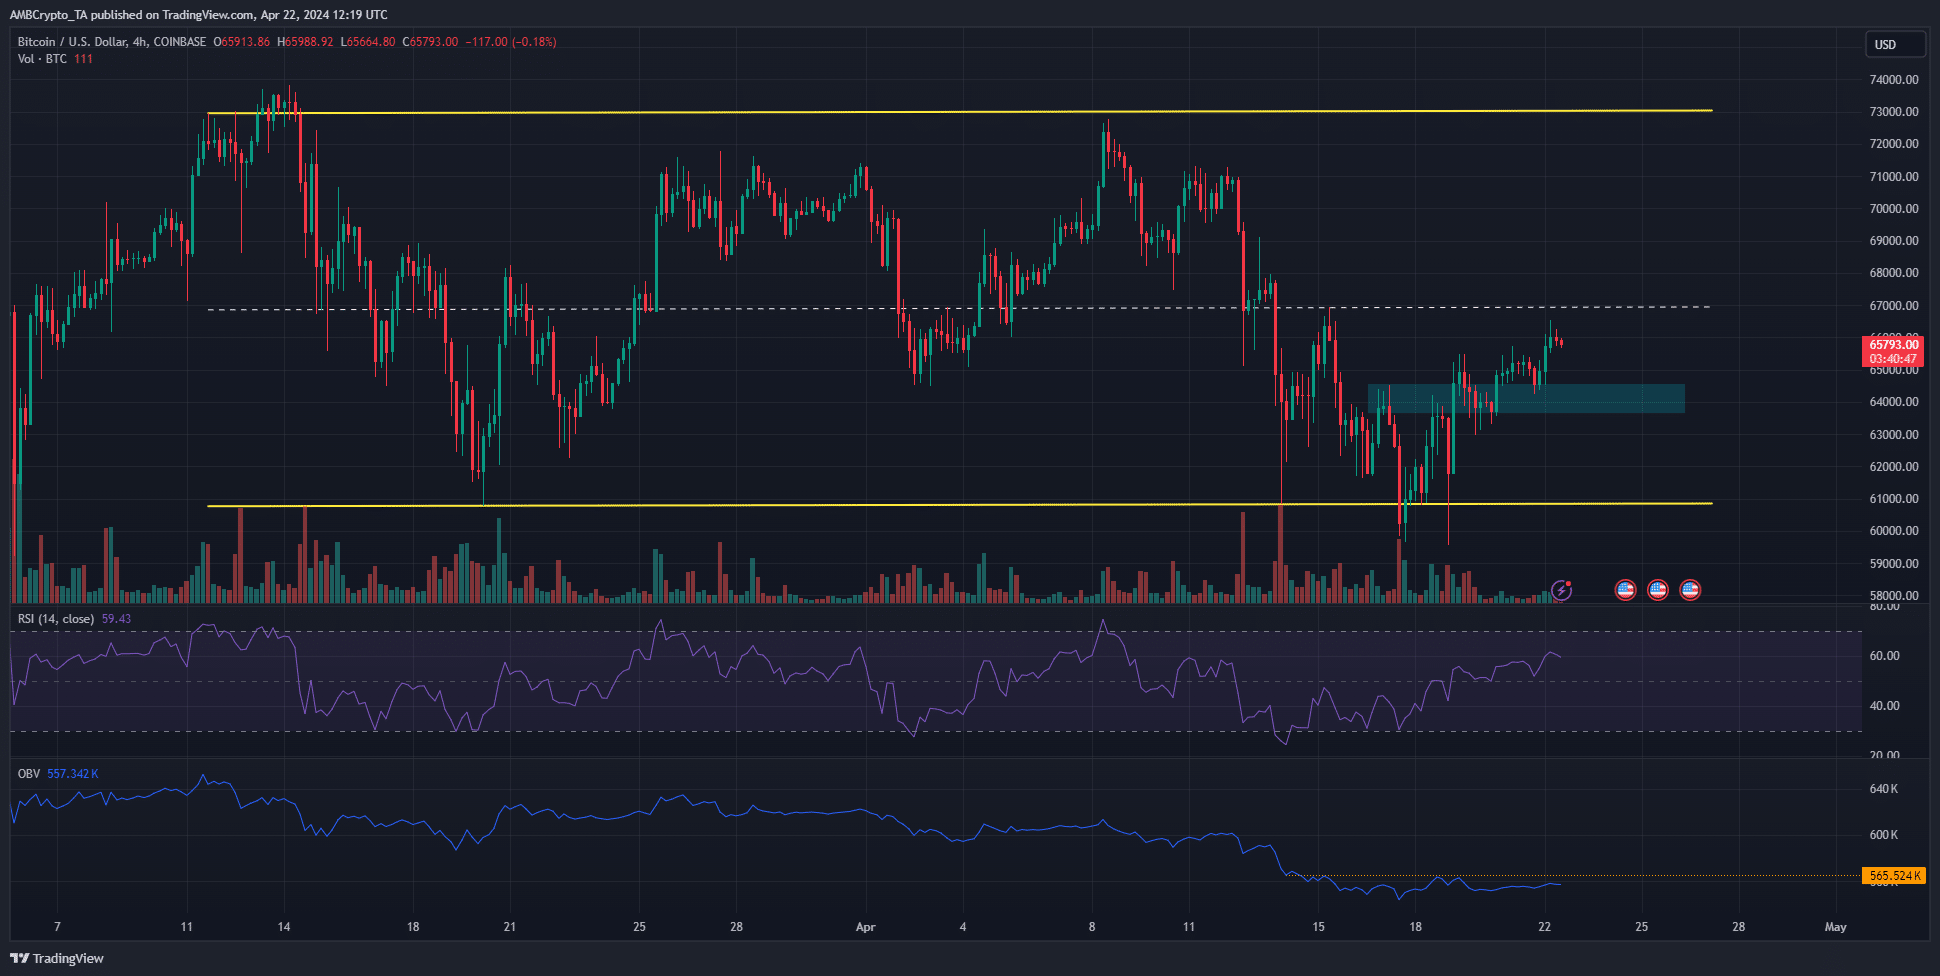
Bitcoin [BTC] formed a range between $73k and $60.7k. The mid-point of this range sat at $66.9k.
Bitcoin saw a healthy uptrend at press time, but the New York Open on Monday the 22nd of April had not yet occurred.
On Sunday, crypto analyst CrypNuevo posted on X (formerly Twitter) that he expected a move to $66k to commence.
This has come to pass, and AMBCrypto decided to investigate where BTC prices would go next within the range.
The conditions for a move past $66k
CrypNuevo pointed out that the 7-day look-back period liquidation heatmap showed a cluster of liquidation levels at the $66k level.
This level is also less than 1% below the mid-range level of the range formation mentioned earlier.
This was a good place for prices to reverse bearishly. The New York session open could see prices jump past $66k, and collect the liquidity there.
It would likely follow up by plunging lower to take out the eager bulls waiting for a move past the $65k-$66k short-term resistance zone.
The invalidation of such a bearish reversal would be a continued move past $66k. A move below $64.5k would indicate that $63k was the next target.
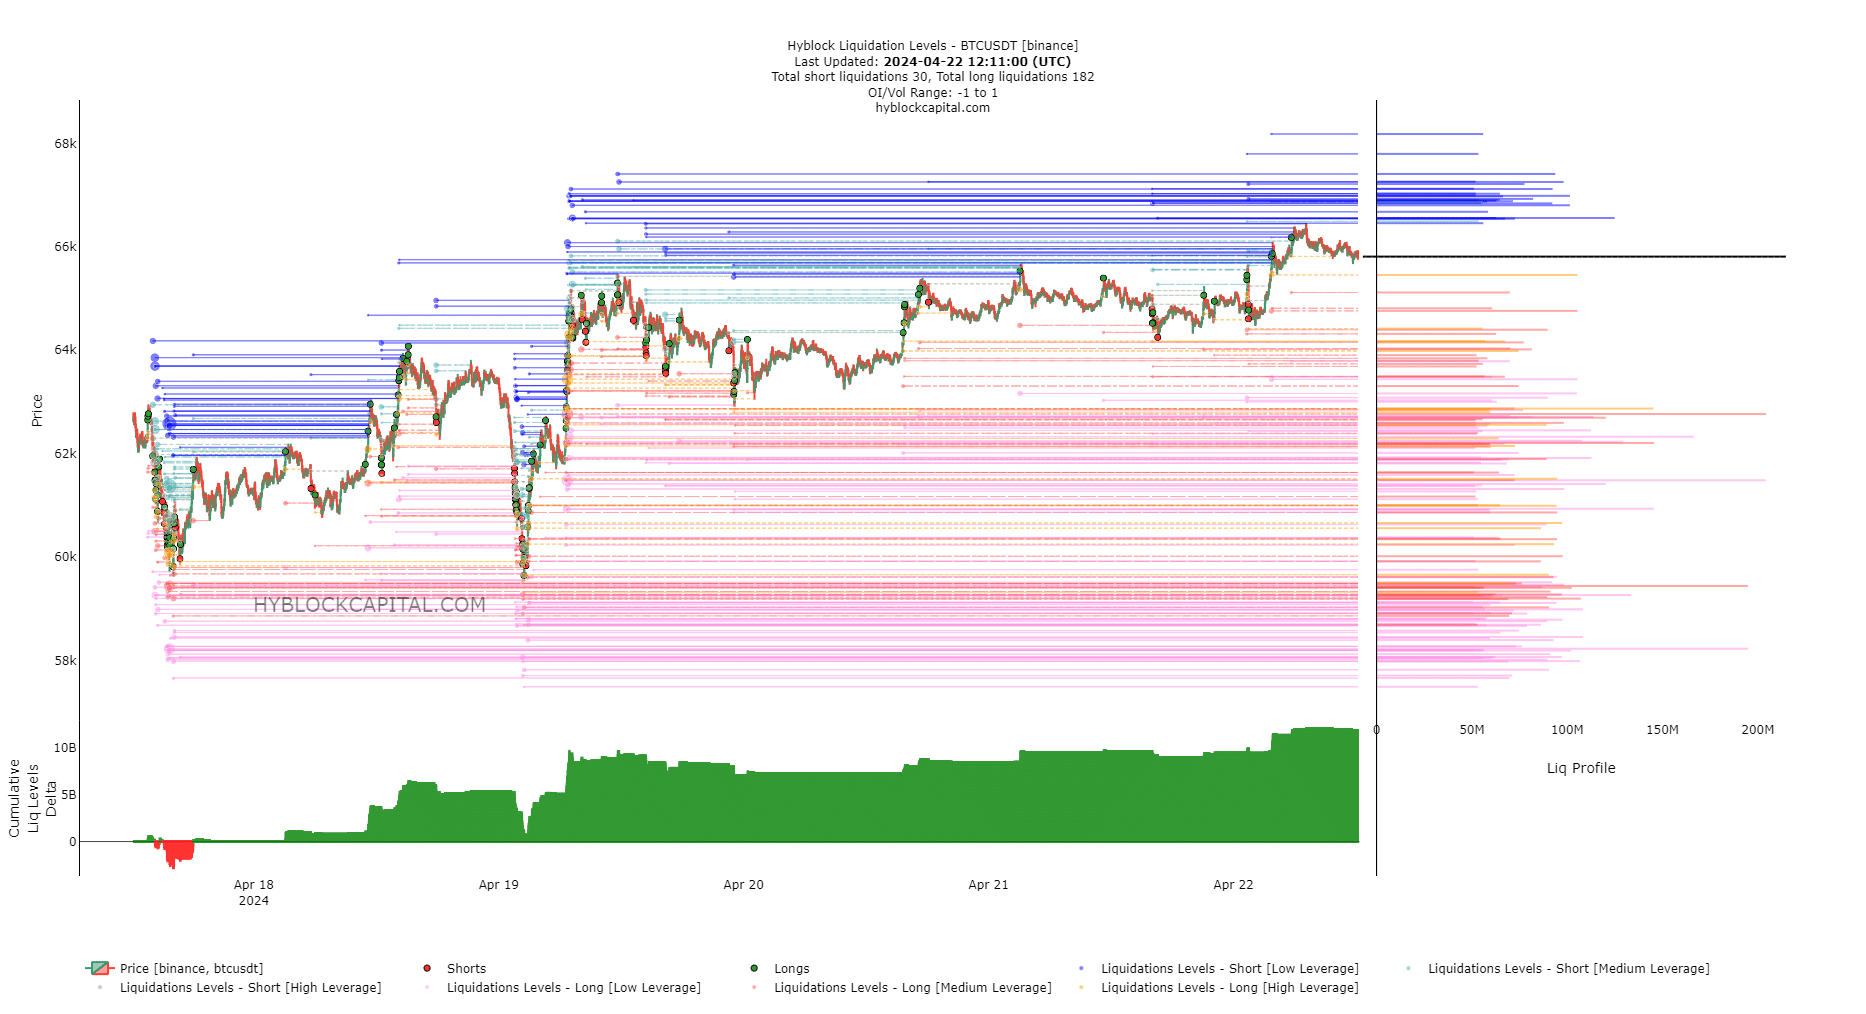
The liquidation levels showed the long positions far outweighed the short positions. This indicated that a downward move was favorable. The $66.8k region had a high concentration of large short liquidations.
Meanwhile, the $62.8k area had a cluster of long liquidation levels as well. Therefore, a drop below $64.5k would likely see a dip to $62.8k.
Combining technical indicators with the range formation
CrypNuevo highlighted that a deviation below the range lows usually sees prices go to the opposite extreme of the range.
We saw such a deviation on the 17th of April, when prices fell to $59.8k. Since then, the direction has reversed.
The RSI on the 4-hour chart also highlighted bullish momentum. Yet, the OBV was unable to scale the local resistance level. This indicated a lack of buying volume in the past week.
Is your portfolio green? Check out the BTC Profit Calculator
The range highs and range lows have confluence with the liquidity pockets at $73.2k and $56k. Therefore, these are the higher timeframe levels of interest.
It is expected that Bitcoin would consolidate within these levels for a few weeks and gather strength for its breakout after the selling pressure that came with the halving.