
Bitcoin Cash Price Prediction: 2024, 2025, 2030


Bitcoin Cash’s price at the same time last week was $528.79. It has moved by 4.48 % in the past week and is currently at $505.14. Infact, in the past 24 hours, BCH has dumped by -0.74 %. There is a slight bearish sentiment in the crypto market. The long term sentiment, however, remains bullish and BCH could hit $375.80 in 2025.
The total circulating supply of Bitcoin Cash as of writing this article was $19695706.15 and the marketcap of BCH remains at $9,967,631,370
Disclaimer
For some coins with little to no data points and inexistent historical data the model by default will show a positive price prediction. There is no way for our AI bot to decipher whitepaper, tokenomics and team integrity. The coin's price that you are about to see below can fall drastically depending on many factors, so please invest wisely after checking the team and project's whitepaper. This current price prediction is done by a machine crunching numbers and the model is still in the early beta stages. It should strictly not be taken as an investment advice. Although the best engineers are currently tweaking and updating the algorithm, no human has verified the price predicted below, so please use your discretion and make a decision wisely.
BCH price prediction: Key highlights
1. Primary support and resistance levels
- Within the weekly timeframe, a support level of $114 was identified as the lowest point.
- Conversely, a resistance level around $970 might stand out as the highest resistance mark.
2. Market sentiment
- In April 2024, BCH remains in a bullish market while undergoing correction.
3. Predictive forecasts
- Based on forecasts from our AI/ML models, BCH is projected to trade at an average price of over $4,000 in 2026 and nearly $70,000 in 2030.
Gain deep insights on BCH via a comprehensive weekly technical analysis, followed by the coming days of the month, upcoming months, and yearly forecast tables derived from our AI/ML-based predictive models:
BCH technical analysis: Did the halving favor the price?
April marks a milestone month for crypto with major events lined up. While the anticipation of the upcoming Bitcoin (BTC) halving continues to garner hype among the community, the recent BCH halving has also put this asset on the broader crypto community’s radar. The impact of this event has significantly influenced Bitcoin Cash (BCH) price prediction for 2024 and beyond.
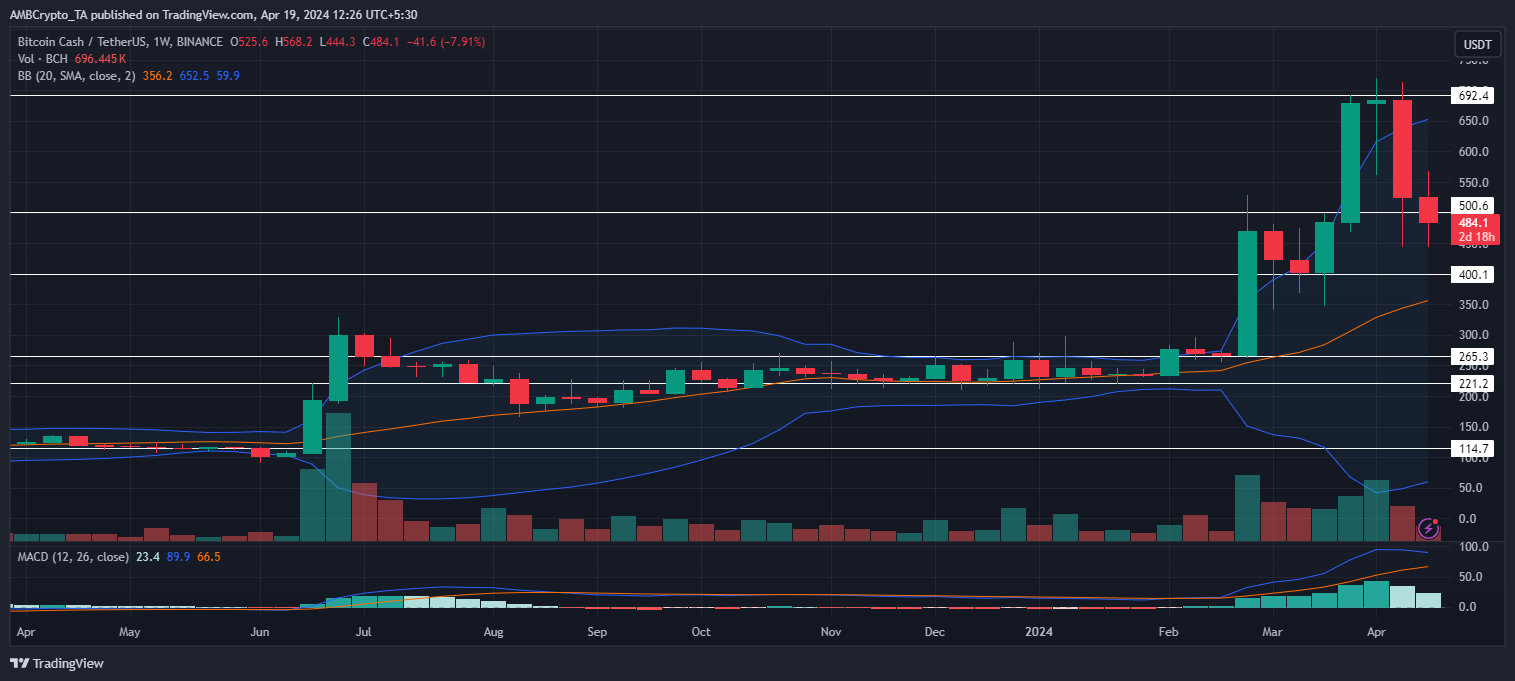
An analysis of BCH’s performance over the past year revealed that the initial period was characterized by a bearish trend. This saw the cryptocurrency's value plunge over the initial month, reaching a low support level of $114 by the end of April.
This level was breached briefly in early June. Nonetheless, the bulls managed to reclaim it by mid-month with a notable pump. Following this, the price even breached the resistance at $265.
This momentum wasn’t sustained as BCH underwent a corrective pullback. Thus, a consolidation phase began in July, which saw the asset trading between $265 and $221. A bearish breakdown pushed the price below the latter support between mid-August and mid-September. However, the buyers regrouped and managed to stay afoot on $221 by the end of September.
For months, this support proved resilient to halt any declines. Finally, in February, BCH broke out and claimed $265. By the end of the month, a significant surge allowed it to fly past $400 and test the critical $500 mark.
After a slight retraction that was halted at $400, the price resumed the uptrend. Another pump towards the end of March allowed BCH to mark a new high resistance at $692. The second halving in early April pushed BCH to highs over $700, which had not been touched since 2021.
However, bearish pressure hit the asset hard as it faced a downturn the week following the halving event. The price faced rejection at the peak chart resistance as the market displayed overextended conditions.
Consequently, BCH fell below $500 close to mid-month. As the period under review came to a close, it traded at $484. This represented a loss of over 20% over the last week, as per CoinMarketCap.
Coinglass data revealed that the Open Interest (OI) has also taken a hit. This behavior contradicted what was observed in the 2020 halving. Many experts are looking at this trajectory as a reflection of what could happen with BTC, whose halving is close.
Moving forward, increased selling pressure can put the resilience of $400 to the test. If the bulls are able to defend it, it can provide a cushion for another rally. Moreover, with the BTC halving, the price might experience a positive momentum that can see BCH reclaim its position above $500.
In that case, the bulls' next target would be to overcome $692 and effectively enter the $700 range. Given a sustained bull run, the price can go as high as $1,000 within this year. Yet, $970 can pose significant resistance to this uptick.
Nevertheless, if the price falls below the current support, the market can likely succumb to a downtrend. This could push the asset close to $300. Meanwhile, the most bearish scenario can even see it fall as low as $265.
Future forecasts from our advanced prediction models indicate a substantial growth trajectory. These projections estimate that the average BCH price could escalate to $4,000 by 2026. This entails reclaiming the all-time high (ATH) within the next two years. Looking ahead, these models offer an even more optimistic outlook for the cryptocurrency, envisioning a remarkable surge in value to reach $70,000 in 2030.
BCH's 2024 roadmap: Key indicators to watch and trade
- The trading volume was low at the start but increased substantially as the price rose in June. During the stagnant price movement that followed, the volume dropped.
- An increase in volume was noted starting in late February, although not as substantial as in June. This suggested a cautious interest from traders during the latest bullish trend.
- Initially, the Bollinger Bands contracted, with the price falling below the 20-week moving average (MA) towards the end of April. By mid-June, the price had climbed above the MA and even slightly exceeded the upper band, causing the bands to expand. However, by the end of October, the bands contracted again. Additionally, the price stabilized near the MA, which served as a dynamic support.
- Towards the end of February, the bands significantly expanded, with the price frequently moving above the upper band and maintaining its position till April. As the analysis concluded, bearish candles were observed below the upper band, yet the price remained above the 20 MA. This was indicative of the market finding an equilibrium after extensive buying.
- The Moving Average Convergence Divergence (MACD) and signal lines started below zero, with the MACD line initially dominant. After a brief dip below the signal line in June, the MACD line reclaimed dominance and moved above the signal line and even the zero line in mid-June. This suggested a potential shift toward bullish momentum as the signal line followed by the month’s end.
- Between late August and February, the MACD line dipped below the signal line again, yet both lines remained above zero. It reflected that while momentum may have fluctuated, the overall trend remained positive. In mid-February, the MACD line reasserted its dominance and began to rise. Yet, in April, the line experienced a downtick.
- At the time of analysis, the MACD line stood at 89.9, the signal line at 66.5, and the histogram at 23.4. This was indicative of waning market strength.


Bitcoin Cash Price Prediction
Bitcoin Cash has had an eventful 2023. To simplify the latest BCH price prediction, we have divided up the prediction by short term Bitcoin Cash price prediction and long term Bitcoin Cash price prediction. As of writing this article, BCH had a trading volume of 287,235,679. Bitcoin Cash has gone up by 9.75% in the past 30 days.
According to our analysis in the short term, Bitcoin Cash price prediction for June 2024 shows the average price of BCH at 558.21 and the highest possible price for June 2024 would be $597.28.
Further, according to our analysis in the long term, Bitcoin Cash price prediction for October 2024 shows the average price of BCH at 565.40 and the highest possible price for October 2024 would be $604.98.
Bitcoin Cash's Short Term Price Prediction
| Date | Avg Price | Lowest Price | Highest Price |
| 24 April 2024 | $469.12 | $436.28 | $501.96 |
| 25 April 2024 | $473.75 | $440.58 | $506.91 |
| 26 April 2024 | $480.15 | $446.54 | $513.76 |
| 27 April 2024 | $476.91 | $443.53 | $510.30 |
| 2 May 2024 | $477.35 | $443.93 | $510.76 |
| 7 May 2024 | $487.76 | $453.62 | $521.90 |
| 17 May 2024 | $529.91 | $492.82 | $567.00 |
| June 2024 | $558.21 | $519.13 | $597.28 |
| July 2024 | $560.01 | $520.81 | $599.21 |
| August 2024 | $561.81 | $522.48 | $601.13 |
| September 2024 | $563.60 | $524.15 | $603.06 |
| October 2024 | $565.40 | $525.83 | $604.98 |
| November 2024 | $567.20 | $527.50 | $606.91 |
| December 2024 | $569.00 | $529.17 | $608.83 |
Bitcoin Cash price prediction 24 April 2024: Bitcoin Cash's price for 24 April 2024 according to our analysis should range between $436.28 to $501.96 and the average price of BCH should be around $469.12.
Bitcoin Cash price prediction 25 April 2024: Bitcoin Cash's price for 25 April 2024 according to our analysis should range between $440.58 to $506.91 and the average price of BCH should be around $473.75.
Bitcoin Cash price prediction 26 April 2024: Bitcoin Cash's price for 26 April 2024 according to our analysis should range between $446.54 to $513.76 and the average price of BCH should be around $480.15.
Bitcoin Cash price prediction 27 April 2024: Bitcoin Cash's price for 27 April 2024 according to our analysis should range between $443.53 to $510.30 and the average price of BCH should be around $476.91.
Bitcoin Cash price prediction 2 May 2024: Bitcoin Cash's price for 2 May 2024 according to our analysis should range between $443.93 to $510.76 and the average price of BCH should be around $477.35.
Bitcoin Cash price prediction 7 May 2024: Bitcoin Cash's price for 7 May 2024 according to our analysis should range between $453.62 to $521.90 and the average price of BCH should be around $487.76.
Bitcoin Cash price prediction 17 May 2024: Bitcoin Cash's price for 17 May 2024 according to our analysis should range between $492.82 to $567.00 and the average price of BCH should be around $529.91.
Bitcoin Cash price prediction June 2024: Bitcoin Cash's price for June 2024 according to our analysis should range between $519.13 to $597.28 and the average price of BCH should be around $558.21.
Bitcoin Cash price prediction July 2024: Bitcoin Cash's price for July 2024 according to our analysis should range between $520.81 to $599.21 and the average price of BCH should be around $560.01.
Bitcoin Cash price prediction August 2024: Bitcoin Cash's price for August 2024 according to our analysis should range between $522.48 to $601.13 and the average price of BCH should be around $561.81.
Bitcoin Cash price prediction September 2024: Bitcoin Cash's price for September 2024 according to our analysis should range between $524.15 to $603.06 and the average price of BCH should be around $563.60.
Bitcoin Cash price prediction October 2024: Bitcoin Cash's price for October 2024 according to our analysis should range between $525.83 to $604.98 and the average price of BCH should be around $565.40.
Bitcoin Cash price prediction November 2024: Bitcoin Cash's price for November 2024 according to our analysis should range between $527.50 to $606.91 and the average price of BCH should be around $567.20.
Bitcoin Cash price prediction December 2024: Bitcoin Cash's price for December 2024 according to our analysis should range between $529.17 to $608.83 and the average price of BCH should be around $569.00.
Bitcoin Cash's Long Term Price Prediction
Bitcoin Cash’s long term Price Prediction below is a look at BCH’s future prospect with regards to price. Bitcoin Cash was last seen at $505.14, with a market cap of $9,967,631,370 and trading volumes of $287,235,679. BCH’s price prediction is possible by analyzing historical price action, current developments and social sentiment from the community.
| Years | Avg Price | Lowest Price | Highest Price |
| 2024 | $569.00 | $455.20 | $682.80 |
| 2025 | $313.16 | $250.53 | $375.80 |
| 2026 | $336.35 | $269.08 | $403.63 |
| 2027 | $361.26 | $289.01 | $433.51 |
| 2028 | $388.01 | $310.41 | $465.62 |
| 2029 | $416.75 | $333.40 | $500.10 |
| 2030 | $447.61 | $358.09 | $537.13 |
| 2031 | $480.76 | $384.61 | $576.91 |
| 2032 | $516.36 | $413.09 | $619.63 |
| 2033 | $554.60 | $443.68 | $665.52 |
| 2035 | $639.78 | $511.82 | $767.73 |
Bitcoin Cash price prediction 2024: Bitcoin Cash's price for 2024 according to our analysis should range between $455.20 to $682.80 and the average price of BCH should be around $569.00.
Bitcoin Cash price prediction 2025: Bitcoin Cash's price for 2025 according to our analysis should range between $250.53 to $375.80 and the average price of BCH should be around $313.16.
Bitcoin Cash price prediction 2026: Bitcoin Cash's price for 2026 according to our analysis should range between $269.08 to $403.63 and the average price of BCH should be around $336.35.
Bitcoin Cash price prediction 2027: Bitcoin Cash's price for 2027 according to our analysis should range between $289.01 to $433.51 and the average price of BCH should be around $361.26.
Bitcoin Cash price prediction 2028: Bitcoin Cash's price for 2028 according to our analysis should range between $310.41 to $465.62 and the average price of BCH should be around $388.01.
Bitcoin Cash price prediction 2029: Bitcoin Cash's price for 2029 according to our analysis should range between $333.40 to $500.10 and the average price of BCH should be around $416.75.
Bitcoin Cash price prediction 2030: Bitcoin Cash's price for 2030 according to our analysis should range between $358.09 to $537.13 and the average price of BCH should be around $447.61.
Bitcoin Cash price prediction 2031: Bitcoin Cash's price for 2031 according to our analysis should range between $384.61 to $576.91 and the average price of BCH should be around $480.76.
Bitcoin Cash price prediction 2032: Bitcoin Cash's price for 2032 according to our analysis should range between $413.09 to $619.63 and the average price of BCH should be around $516.36.
Bitcoin Cash price prediction 2033: Bitcoin Cash's price for 2033 according to our analysis should range between $443.68 to $665.52 and the average price of BCH should be around $554.60.
Bitcoin Cash price prediction 2035: Bitcoin Cash's price for 2035 according to our analysis should range between $511.82 to $767.73 and the average price of BCH should be around $639.78.
Top Coins Price Predictions


Similar Long Term Price Predictions


A Historical look at Bitcoin Cash, BCH’s price
BCH/USD Pair


BCH/Euro Pair
FAQs about Bitcoin Cash
Bitcoin Cash’s current price is $505.14 and witnessed a -0.74% decrease in the past 24 hours. BCH/BTC pair saw a -0.77% decrease in the past 24 hours
Investing in Bitcoin Cash, BCH will purely depend on your personal risk appetite. As you can see over the past 24 hours Bitcoin Cash’s price has witnessed a -0.74% decrease and over the past 30 days Bitcoin Cash has increase by 9.75%. So it all depends on if this investment will hit your trading goals.
According to our latest Bitcoin Cash Price prediction for 2024, BCH should vary between $682.80 and $455.20. Please keep in mind that the crypto market is very volatile and this Bitcoin Cash price prediction does not account for extreme wild swings in price.
As per the Bitcoin Cash price prediction 2024 model above, BCH’s price for April 2024 should range between $455.20 to $682.80 with the average price for April being $569.00
According to the Bitcoin Cash Price Prediction model above, BCH’s price in 2025 would be $313.16. This price would however would range from $375.80 and $250.53.
According to the Bitcoin Cash Price Prediction model above, BCH’s price in 2026 would be $336.35. This price would however would range from $403.63 and $269.08.
According to the Bitcoin Cash Price Prediction model above, BCH’s price in 2027 would be $361.26. This price would however would range from $433.51 and $289.01.
According to the Bitcoin Cash Price Prediction model above, BCH’s price in 2028 would be $388.01. This price would however would range from $465.62 and $310.41.
According to the Bitcoin Cash Price Prediction model above, BCH’s price in 2029 would be $416.75. This price would however would range from $500.10 and $333.40.
According to the Bitcoin Cash Price Prediction model above, BCH’s price in 2030 would be $447.61. This price would however would range from $537.13 and $358.09.
According to the Bitcoin Cash Price Prediction model above, BCH’s price in 2031 would be $480.76. This price would however would range from $576.91 and $384.61.
According to the Bitcoin Cash Price Prediction model above, BCH’s price in 2032 would be $516.36. This price would however would range from $619.63 and $413.09.
According to the Bitcoin Cash Price Prediction model above, BCH’s price in 2033 would be $554.60. This price would however would range from $665.52 and $443.68.
According to the Bitcoin Cash Price Prediction model above, BCH’s price in 2035 would be $639.78. This price would however would range from $767.73 and $511.82.
The highest price for Bitcoin Cash was recorded in 20 December 2017 during which BCH hit an All Time High of $3785.82
The price of 1 Bitcoin Cash according to current market rate is $505.14