
CFX is the native utility token of Conflux, a Layer-1 public blockchain network used for ecosystem incentives, staking, and network governance. The network was founded in 2018 by Fan Long, although its underlying technology had been in development since 2017.

The initial supply of the coin was 5 billion tokens, locked at the mainnet launch and released gradually over time. Moreover, private equity investors received 12% of the total supply, while the foundation was allocated 4%. 

Meanwhile, 36% of the supply was allocated to the Genesis team, including the founding team, Conflux Foundation employees, advisors, and the IIIS team, with the tokens vesting over four years. The Community Fund received 8% of the supply, while the Ecosystem Fund, the largest allocation designated for community builders and dApp developers, was granted 40%.

Conflux is backed by several prominent venture capital firms, including Sequoia China, Baidu Ventures, crypto exchange Huobi, Metastable, and IMO Ventures. Notably, the project announced a $35 million funding round. In total, Conflux has raised $68 million across seven funding rounds from 14 investors. Its most recent funding round was a seed VC round conducted in September 2023.

Another metric that crypto investors should be aware of is whale concentration. Approximately 35% of the CFX supply is held by whales, meaning that some wallets control a significant portion of the token supply. In the crypto market, such concentration can have a substantial impact on price movements, as large-scale selloffs by these holders could put significant downward pressure on CFX.

From the derivatives side, traders currently appear to be betting on further upside. At press time, Binance’s CFX Long/Short ratio was at 1.4166, indicating strong bullish sentiment among traders. Meanwhile, the CFX OI-Weighted Funding Rate turned positive and climbed to 0.0092%, indicating that long-position holders are willing to pay a premium to maintain their positions, a sign of growing bullish conviction in the market.

The two key liquidation levels sit at $0.0458 on the downside and $0.0517 on the upside, where traders are heavily leveraged. At these points, roughly $443.56K in long positions and $152.23K in shorts have been built. This positioning indicates bulls currently dominate the market, while bears are losing momentum and showing signs of exhaustion. 


VIEW MORE

Overview

Market Cap
$230.31M
+3.8%
Volume (24H)
$5.13M
Volume (7D)
$33.80M
+0.7%
Max Supply
Circulating Supply
5,213,885,115 CFX
All-Time High
$1.70
-97.4%
All-Time Low
$0.021999
+100.7%
(above ATL)

Prediction Analysis

Current Price
$0.04
Sentiment
Bearish
50-Day SMA
$0.05
Price Prediction
$0.03
-32.00%
Fear & Greed Index
200-Day SMA
$0.06
Green Days
13 / last 30 (44.8%)
Volatility
2.72%
Moderate
14-Day RSI
54.09
Neutral

Profit Calculator

Select asset
%
%
Total Profit
$0
(0%)
Total Exit Amount
$0
Total Investment Fee
$0
Total Exit Fee
$0

Conflux Price Prediction

Current Price
$0.04
2031
$0.01
2036
$0.00
2041
$0.00
2046
$0.00

Results are based solely on your predicted price change. They are not indicators of future performance and do not take into account different performance scenarios, historical data, or the effect of fees or other charges.

VIEW MORE

Short-Term Conflux Price Targets

Date Prediction Change
Jul 15, 2026 $0.05 +5.00%
Jul 16, 2026 $0.05 +10.25%
Jul 17, 2026 $0.05 +15.76%
Jul 18, 2026 $0.05 +21.55%
Jul 19, 2026 $0.06 +27.63%
Jul 20, 2026 $0.06 +34.01%
Jul 21, 2026 $0.06 +40.71%

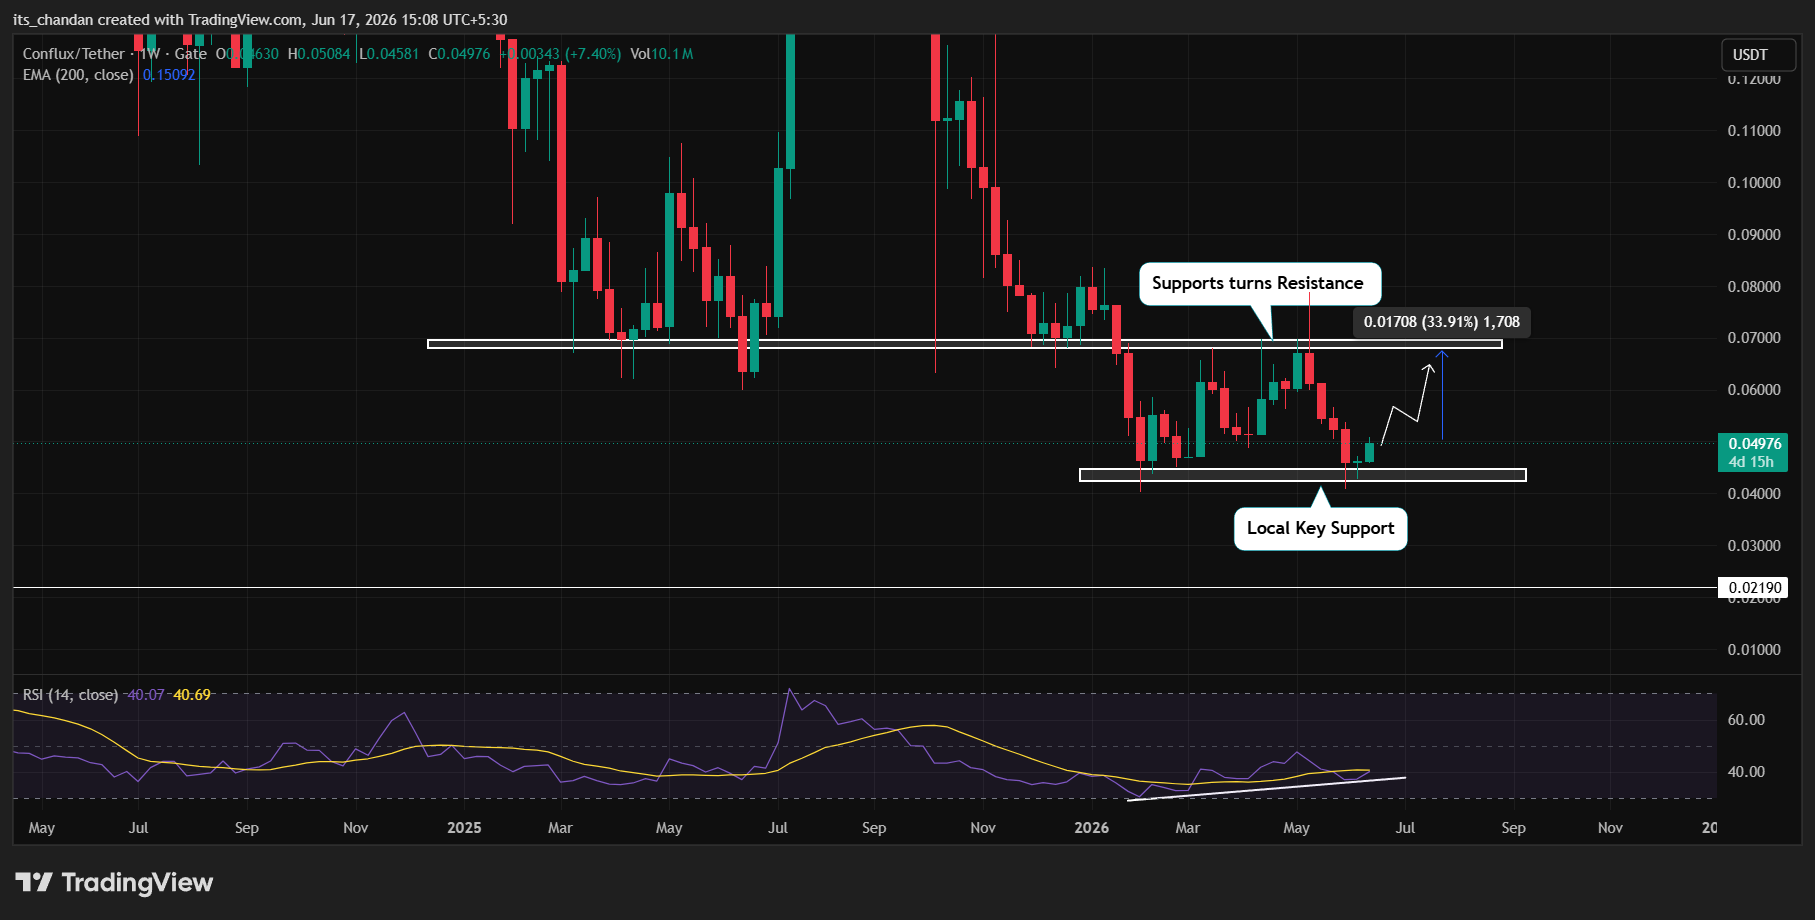
CFX appears bullish in the short term, with the price beginning to recover from the key local support level of $0.0428. In addition, at press time, the Average Directional Index (ADX) on the daily chart suggested that the asset was experiencing a strong directional trend. Based on the current price action, if CFX remains above this key support level, it could see another price increase of 34% and potentially reach the next resistance level at $0.0675. However, if the price falls below the local support, it could trigger a sharp downside move.

VIEW MORE

Monthly Conflux Price Prediction

Jun 30, 2026
$0.04
Jul 14, 2026
$0.04
Highest in Jul
$0.05
Lowest in Jul
$0.04
Overall Performance
Rising

Long-Term Conflux Price Prediction

Month Price AVG Price Max Price Change
Jul $0.04 $0.04 $0.04 -9.46%
Aug $0.03 $0.04 $0.04 -32.09%
Sep $0.03 $0.03 $0.03 -32.09%
Oct $0.02 $0.03 $0.03 -54.73%
Nov $0.02 $0.02 $0.02 -54.73%
Dec $0.02 $0.02 $0.02 -54.73%
In 2026, Conflux (CFX) is anticipated to trade between $0 and $0 , leading to an average annualized price of $0 . This could result in a potential return on investment of -32.09% compared to the current price.
VIEW MORE

Historical Price Performance

Year Highest Price Lowest Price
2026 (to date) $0 $0
2025 $0 $0
2024 $1 $0
2023 $0 $0
2022 $0 $0
2021 $2 $0
2020 $0 $0

Historically, CFX has been in a downtrend after losing the key $0.068 support level, which has now turned into resistance. Meanwhile, this bearish outlook of the asset further strengthened, as it continued to trade below the 200 EMA, indicating that sellers remained controlling the broader trend. However, recent price recovery and the chart indicate that CFX may be attempting to establish a bottom near the $0.0428 support zone. Both the daily and weekly charts show that buyers have consistently defended this level, triggering a recovery each time the asset revisited the area. As a result, CFX has started rebounding from its local lows and is currently showing signs of short-term strength.

VIEW MORE

Technical Analysis

At press time, CFX was trading near $0.050 as the trading volume jumped 45% to $13.95 million, indicating strong participation from both traders and investors.

According to the weekly chart, CFX’s long-term outlook remains bearish, as the price continues to trade below the key support level of $0.68, which served as a major floor from May 2025 to January 2026.

Consequently, the price also remains below the 200-day Exponential Moving Average (EMA), indicating that the long-term trend is still bearish and that sellers remain in control of the market.
Source: TradingView

Looking at CFX’s current price action, the asset appears to be recovering from the local support level of $0.0428, which it has held since January 2026. Based on the current market structure, if CFX continues to hold above this support level, there is a strong possibility that it could rally another 34% and reach the next key resistance level at $0.0675 in the coming days. 

At press time, the Relative Strength Index (RSI) was hovering around 40 and appeared to be forming higher lows while the price remained near a key support level, suggesting the presence of a bullish divergence on the weekly chart. This indicates that bearish momentum is gradually weakening, and if buyers continue to defend the current support zone, CFX could witness a strong upward rally. 

Meanwhile, on the daily chart, CFX appears bullish and is poised for a further upside move. The recent gains helped the asset extend its bullish streak. At current levels, CFX seems to be rebounding from a key local support level at $0.0428. However, the price remains below the 200-day EMA, indicating that the broader trend is still bearish.

Source: TradingView

At press time, CFX’s Average Directional Index (ADX) had risen to 25, supporting the asset’s current trend. This suggests that CFX is experiencing a strong directional trend, which could reinforce the ongoing price movement. However, if bullish momentum fades and the price falls below the $0.0428 support, CFX could decline toward the next support level.


Guides

How to Read Conflux Charts and Predict Price Movements?

Most traders use candlestick charts, as they provide more information than a simple line chart. Traders can view candlesticks that represent the price action of Conflux with different granularity – for example, you could choose a 5-minute candlestick chart for extremely short-term price action or choose a weekly candlestick chart to identify long-term trends. 1-hour, 4-hour, and 1-day candlestick charts are among the most popular.

Let’s use a 1-hour candlestick chart as an example of how this type of price chart gives us information about opening and closing prices. The chart is divided into “candles” that give us information about Conflux’s price action in 1-hour chunks. Each candlestick will display the asset’s opening price, closing price, as well as the highest and lowest prices reached within that period.

Conflux Price Prediction Indicators

Moving averages are among the most popular Conflux price prediction tools. As the name suggests, a moving average provides the average closing price over a selected time frame, which is divided into a number of periods of the same length. For example, a 12-day simple moving average is calculated by summing the closing prices over the last 12 days and dividing the result by 12.

In addition to the simple moving average (SMA), traders also use another type of moving average called the exponential moving average (EMA). The EMA gives more weight to recent prices, and therefore reacts more quickly to changes in market conditions.

What Affects the Price of Conflux?

Just like with any other asset, the price action of Conflux is driven by supply and demand. These dynamics can be influenced by fundamental events such as block reward halvings, hard forks, or new protocol updates. Regulations, adoption by companies and governments, cryptocurrency exchange hacks, and other real-world events can also affect market sentiment.

Technical indicators such as moving averages, RSI, and trading volume are also used by traders to anticipate price movements and identify potential trend reversals.

FAQs on Conflux Price Predictions

As of today, Conflux (CFX) is trading at $0.044177. The current market sentiment is Bearish, with RSI at 54.09 (Neutral) and volatility classified as Moderate.
Based on our technical analysis and projected annual growth rate, Conflux could reach $0.030041 by 2027. This estimate assumes continued market momentum and adoption trends.
According to our technical analysis indicators, the Conflux price prediction is forecasted to reach $0.006423 within the next five years (by 2031). Over the last 30 days, Conflux recorded green days 45% of the time.
Based on multiple technical indicators, the current outlook for Conflux in 2026 is Bearish. RSI currently sits at 54.09, which indicates Neutral momentum. However, investors should evaluate both technical signals and fundamental developments before making any investment decisions.
Long-term forecasts indicate that Conflux may continue to grow over the next decade if adoption, technology development, and global crypto demand continue to expand.
While Conflux's future value depends on various factors, technical indicators suggest it could experience both bullish and bearish cycles over time. Long-term investors typically monitor RSI levels, moving averages, and broader market sentiment when evaluating CFX's future trajectory.
Disclaimer

AMBCrypto's content is meant to be informational in nature and should not be interpreted as investment advice. Trading, buying or selling cryptocurrencies should be considered a high-risk investment and every reader is advised to do their own research before making any decisions.