CRV is the native governance and reward token of Curve Finance, one of the top decentralized exchanges (DEX) in the DeFi space, and was founded by Michael Egorov in 2020.

Unlike other DEXes that handle all kinds of token swaps, Curve Finance is built specifically for swapping stablecoins such as USDT, USDC, and DAI with ultra-low fees and minimal slippage.

This specialized focus has made it the backbone of DeFi liquidity.

Here, investors who deposit their stablecoins into liquidity pools earn trading fees and CRV tokens as rewards.

In fact, if you lock your CRV tokens, you receive veCRV, which grants voting power as well as a share of protocol fees. The longer you lock your tokens, the greater your voting power becomes.

What truly matters for the platform is its scale and reach. Data shows that total trading volume increased from $119 billion in 2024 to $126 billion in 2025.

Curve now captures 44% of all DEX fee revenue on Ethereum, up 16% from the previous year. Meanwhile, its total value locked (TVL) across multiple blockchains has surpassed $3.20 billion, making it one of the top five DEXs globally.

Whereas protocols like Aave, Yearn Finance, Convex, and Frax route a significant portion of their liquidity through Curve’s pools, meaning that if Curve were to stop functioning, a large part of the DeFi ecosystem could potentially slow down with it. 

Besides these, Curve Finance generates revenue in three ways: trading fees, crvUSD lending, and CRV emissions.

Through trading fees, the protocol earns a small portion of the fees collected from swaps, while the majority is distributed to liquidity providers. Since Curve launched its own stablecoin, crvUSD, users can borrow it by locking up collateral, allowing the protocol to earn fees from these loans.

Meanwhile, through CRV emissions, the protocol distributes CRV tokens as additional rewards to liquidity providers, helping incentivize liquidity across its pools. 

The key development that looks positive for Curve Finance is its decision to reduce the CRV inflation rate to 5.02% in August 2025, cutting nearly 22 million CRV tokens per year in selling pressure.

This means fewer new tokens are entering circulation, reducing constant sell-offs from emissions and potentially making CRV more valuable over time.

However, the founder itself proposed a protocol called Yield Basis to give CRV holders more ways to earn income. In this, the plan is to issue $60 million in crvUSD to fund three Bitcoin-focused pools (WBTC, cbBTC, tBTC).

Between 35% and 65% of Yield Basis yields flow back to veCRV holders. This means holding and locking CRV now gives exposure to Bitcoin DeFi yield in addition to stablecoin. So, that Curve is trying to make CRV holders earn from Bitcoin activity too. 

Whereas, the concerning part for Curve Finance is its security-related incidents. On the 5th of May 2025, the protocol experienced a major security breach, but not through its code or smart contracts. Instead, its official X account was compromised in a social engineering attack.

Despite the incident, the CRV token recovered quickly after the Curve team confirmed that no protocol-level breach had occurred and that user funds remained safe. 

More seriously, during the market crash in October 2025, liquidation failures in Curve’s LlamaLend market resulted in nearly $700,000 in bad debt.

To address the issue, founder Michael Egorov later proposed a market-based recovery solution aimed at covering the losses and restoring confidence in the protocol. 

VIEW MORE

Overview

Market Cap
$321.16M
+1.7%
Volume (24H)
$27.26M
Volume (7D)
$214.74M
+9.3%
Max Supply
3,030,303,031 CRV
Circulating Supply
1,529,613,145 CRV
All-Time High
$15.37
-98.6%
All-Time Low
$0.171683
+22.3%
(above ATL)

Prediction Analysis

Current Price
$0.21
Sentiment
Bearish
50-Day SMA
$0.21
Price Prediction
$0.36
+71.70%
Fear & Greed Index
200-Day SMA
$0.26
Green Days
16 / last 30 (55.2%)
Volatility
5.12%
High
14-Day RSI
51.51
Neutral

Profit Calculator

Select asset
%
%
Total Profit
$0
(0%)
Total Exit Amount
$0
Total Investment Fee
$0
Total Exit Fee
$0

Curve DAO Price Prediction

Current Price
$0.21
2031
$3.13
2036
$46.76
2041
$697.86
2046
$10,414.08

Results are based solely on your predicted price change. They are not indicators of future performance and do not take into account different performance scenarios, historical data, or the effect of fees or other charges.

VIEW MORE

Short-Term Curve DAO Price Targets

Date Prediction Change
Jul 06, 2026 $0.22 +3.65%
Jul 07, 2026 $0.23 +7.44%
Jul 08, 2026 $0.23 +11.37%
Jul 09, 2026 $0.24 +15.44%
Jul 10, 2026 $0.25 +19.66%
Jul 11, 2026 $0.26 +24.03%
Jul 12, 2026 $0.27 +28.56%

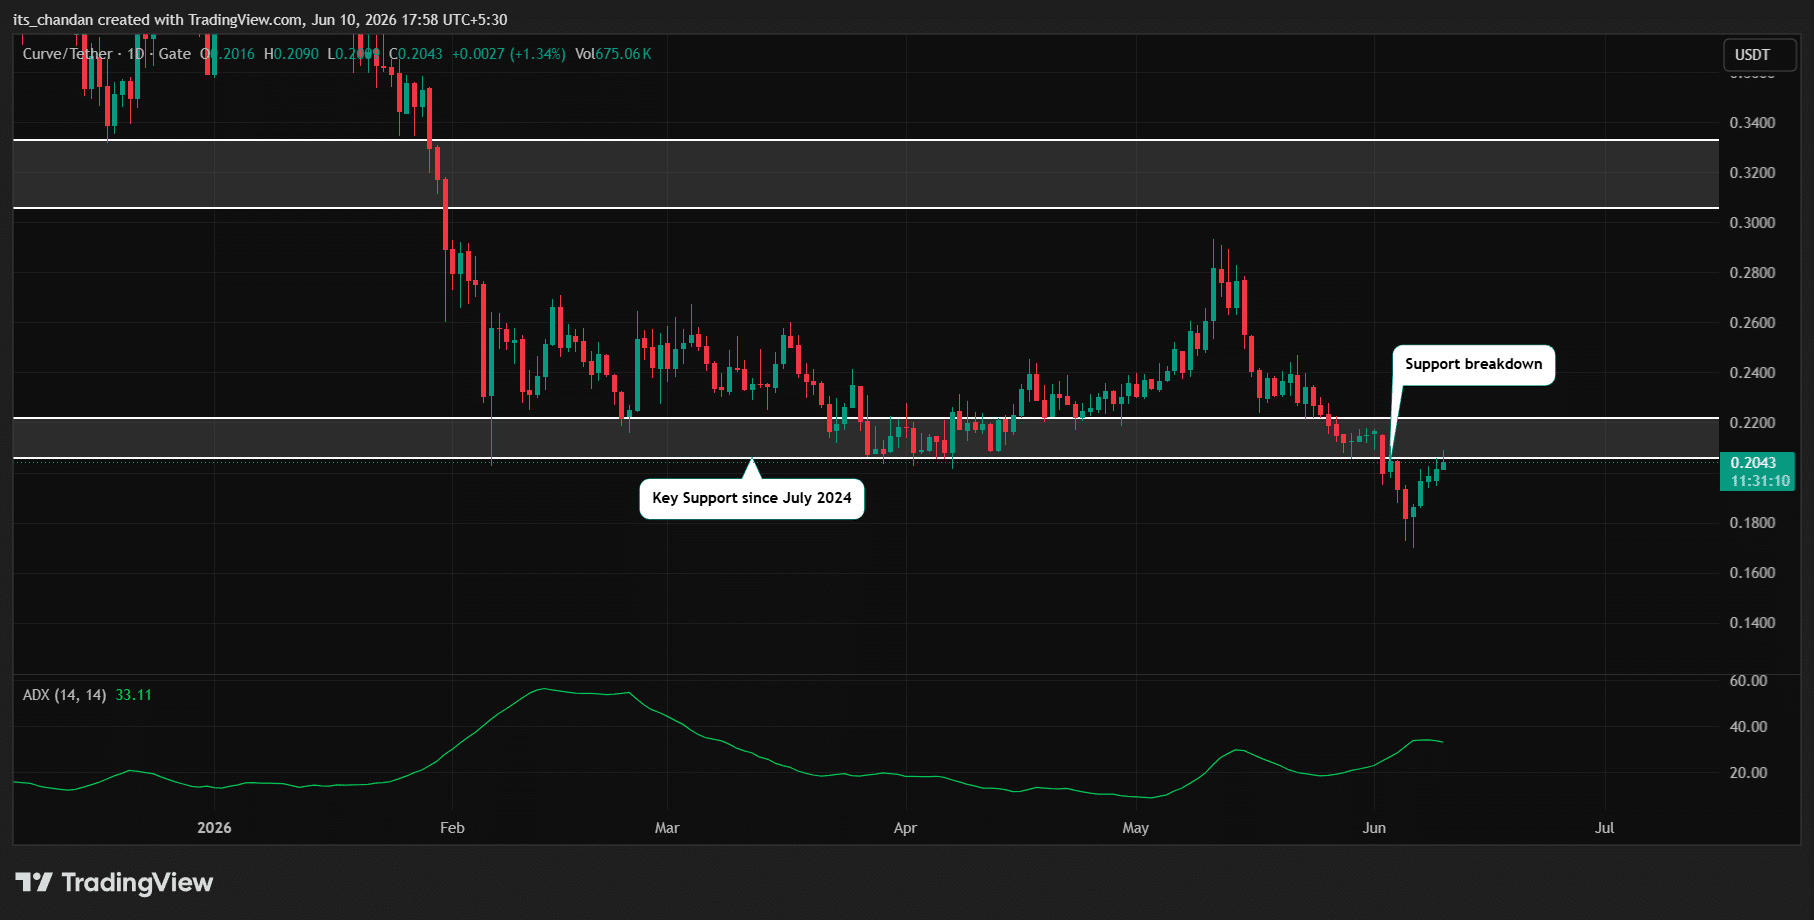
CRV’s short-term bias appears bearish, as it has recently broken below the key support level of $0.207, which had acted as a major demand zone since July 2024. Although the token has rebounded from its low of $0.17, recovery remains weak, as the price continues to trade below the important $0.207 level. Meanwhile, the daily ADX remains above 33, suggesting that the current trend still carries strong momentum and continues to favor sellers. This bearish thesis could be invalidated if CRV regains and reclaims the $0.222 level.

VIEW MORE

Monthly Curve DAO Price Prediction

Jun 30, 2026
$0.18
Jul 5, 2026
$0.21
Highest in Jul
$0.22
Lowest in Jul
$0.18
Overall Performance
Rising

Long-Term Curve DAO Price Prediction

Month Price AVG Price Max Price Change
Jul $0.25 $0.23 $0.23 +19.05%
Aug $0.31 $0.28 $0.28 +47.62%
Sep $0.38 $0.34 $0.34 +80.95%
Oct $0.46 $0.42 $0.42 +119.05%
Nov $0.55 $0.50 $0.50 +161.91%
Dec $0.67 $0.61 $0.61 +219.05%
In 2026, Curve DAO (CRV) is anticipated to trade between $0 and $1 , leading to an average annualized price of $0 . This could result in a potential return on investment of +88.89% compared to the current price.
VIEW MORE

Historical Price Performance

Year Highest Price Lowest Price
2026 (to date) $0 $0
2025 $1 $0
2024 $1 $0
2023 $1 $0
2022 $7 $1
2021 $6 $1
2020 $15 $0

CRV has witnessed notable volatility since its launch, initially trading above $1 and later reaching highs above $6 during the 2021 bull market. However, the asset struggled to maintain that upward momentum and eventually entered a prolonged downtrend as market sentiment weakened. Over the following years, CRV consistently formed lower highs and lower lows, with multiple recovery rallies failing to establish a sustained bullish trend. Moreover, the recent breakdown below the key support level of $0.207 appears to be pushing the asset lower and further reinforcing its bearish market structure.

VIEW MORE

Technical Analysis

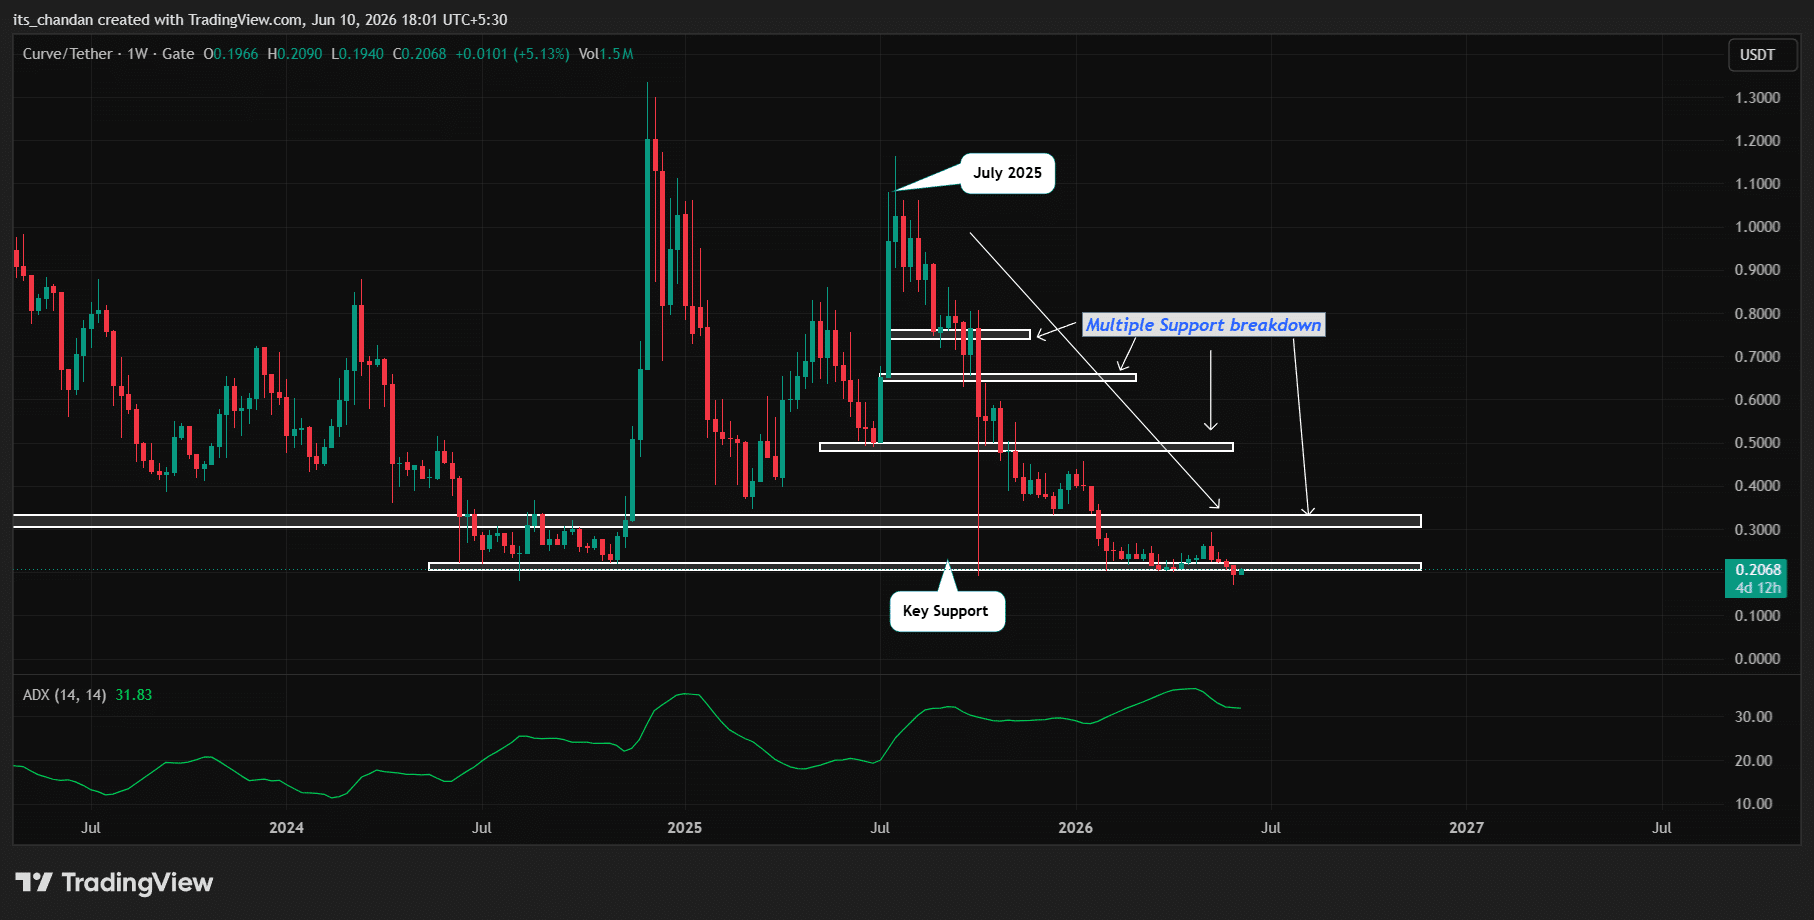
The weekly and daily charts show that CRV continues to exhibit a bearish technical structure. On the weekly chart, the token remains in a strong downtrend, forming a series of lower highs and lower lows, a pattern that has persisted since July 2025.

What further strengthens CRV’s bearish outlook is the recent breakdown below the key support level of $0.207, which had served as an important demand zone since mid-2024.

Moreover, the repeated testing of this support level suggested weakening buying pressure, while the weekly ADX remains above 30, indicating that the prevailing downtrend still carries notable strength.

Source: TradingView

Meanwhile, the daily chart shows that CRV has recently broken below the key support level of $0.207, suggesting that the asset is poised to continue its bearish move in the coming days.

The current price action indicates that a potential rebound could only occur if CRV reclaims and climbs above the $0.2220 level; otherwise, the downside momentum may continue.

At press time, the ADX indicator remained above 33, further confirming that the ongoing trend carries strong momentum.

Source: TradingView

Guides

How to Read Curve DAO Charts and Predict Price Movements?

Most traders use candlestick charts, as they provide more information than a simple line chart. Traders can view candlesticks that represent the price action of Curve DAO with different granularity – for example, you could choose a 5-minute candlestick chart for extremely short-term price action or choose a weekly candlestick chart to identify long-term trends. 1-hour, 4-hour, and 1-day candlestick charts are among the most popular.

Let’s use a 1-hour candlestick chart as an example of how this type of price chart gives us information about opening and closing prices. The chart is divided into “candles” that give us information about Curve DAO’s price action in 1-hour chunks. Each candlestick will display the asset’s opening price, closing price, as well as the highest and lowest prices reached within that period.

Curve DAO Price Prediction Indicators

Moving averages are among the most popular Curve DAO price prediction tools. As the name suggests, a moving average provides the average closing price over a selected time frame, which is divided into a number of periods of the same length. For example, a 12-day simple moving average is calculated by summing the closing prices over the last 12 days and dividing the result by 12.

In addition to the simple moving average (SMA), traders also use another type of moving average called the exponential moving average (EMA). The EMA gives more weight to recent prices, and therefore reacts more quickly to changes in market conditions.

What Affects the Price of Curve DAO?

Just like with any other asset, the price action of Curve DAO is driven by supply and demand. These dynamics can be influenced by fundamental events such as block reward halvings, hard forks, or new protocol updates. Regulations, adoption by companies and governments, cryptocurrency exchange hacks, and other real-world events can also affect market sentiment.

Technical indicators such as moving averages, RSI, and trading volume are also used by traders to anticipate price movements and identify potential trend reversals.

FAQs on Curve DAO Price Predictions

As of today, Curve DAO (CRV) is trading at $0.209998. The current market sentiment is Bearish, with RSI at 51.51 (Neutral) and volatility classified as High.
Based on our technical analysis and projected annual growth rate, Curve DAO could reach $0.360567 by 2027. This estimate assumes continued market momentum and adoption trends.
According to our technical analysis indicators, the Curve DAO price prediction is forecasted to reach $3.13 within the next five years (by 2031). Over the last 30 days, Curve DAO recorded green days 55% of the time.
Based on multiple technical indicators, the current outlook for Curve DAO in 2026 is Bearish. RSI currently sits at 51.51, which indicates Neutral momentum. However, investors should evaluate both technical signals and fundamental developments before making any investment decisions.
Based on long-term projections and historical crypto market cycles, Curve DAO could reach $46.76 within the next decade (by 2036).
While Curve DAO's future value depends on various factors, technical indicators suggest it could experience both bullish and bearish cycles over time. Long-term investors typically monitor RSI levels, moving averages, and broader market sentiment when evaluating CRV's future trajectory.
Disclaimer

AMBCrypto's content is meant to be informational in nature and should not be interpreted as investment advice. Trading, buying or selling cryptocurrencies should be considered a high-risk investment and every reader is advised to do their own research before making any decisions.