Decred is a Layer-1 blockchain and autonomous digital currency launched on the 8th of February, 2016, with a strong emphasis on governance, sustainability, and decentralized decision-making.

Built on a modified Bitcoin codebase using the Go programming language, Decred differentiates itself through a hybrid proof-of-work and proof-of-stake consensus mechanism. 

The design enables both miners and stakeholders to participate in block validation and governance, ensuring that no single group can dominate network control. The project’s guiding philosophy, often summarized as “Money Evolved,” reflects its goal of addressing governance limitations present in earlier blockchain systems.

At the core of Decred’s architecture is its dual-consensus model, where proof-of-work miners generate blocks while proof-of-stake participants validate them through a ticket-based voting system. Each block requires approval from at least three out of five randomly selected tickets, introducing a robust checks-and-balances system. 

The mechanism allows stakeholders to veto blocks that do not align with consensus rules, significantly reducing the risk of malicious mining behavior. The average block time stands at approximately five minutes, offering a balance between transaction throughput and network security.

Decred’s economic structure is designed to align incentives across all participants. Block rewards are distributed in a structured manner, with 60% allocated to miners, 30% to stakeholders, and 10% directed to the treasury. 

The treasury plays a critical role in funding development, marketing, and ecosystem initiatives, enabling the network to sustain itself without relying on external funding sources. The treasury is governed through Politeia, Decred’s off-chain proposal system, where stakeholders vote on funding decisions and protocol upgrades.

From a supply perspective, Decred maintains a hard cap of 21 million coins, mirroring Bitcoin’s scarcity model. As of June 2026, circulating supply stands at approximately 17.46 million DCR, with total supply nearing full distribution.

This near-complete emission reduces inflationary pressure over time, while the protocol’s declining reward schedule introduces gradual deflation.

Unlike Bitcoin’s halving model, Decred employs a smoother reduction mechanism, where block rewards decrease incrementally every 6,144 blocks, roughly every 21 days. This predictable emission curve contributes to long-term supply stability.

The project’s initial distribution was notably transparent, with 8% of the total supply premined and split evenly between the development team and the community.

Approximately 840,000 DCR was allocated to early contributors and developers, while another 840,000 DCR was distributed through an airdrop to around 3,000 participants. This approach avoided traditional ICO structures, fostering a more decentralized ownership base from inception.

Decred also integrates a sophisticated governance framework through Politeia, allowing stakeholders to propose and vote on changes to the network. Proposals undergo a structured lifecycle, including submission, review, public discussion, and final voting.

Approval requires a 60% majority with a minimum quorum, ensuring that decisions reflect broad consensus. This governance model has enabled Decred to evolve continuously while maintaining decentralization.

In terms of security, Decred’s hybrid consensus significantly increases resistance to attacks. To execute a 51% attack, an adversary would need to control both the majority of mining power and a substantial portion of staked coins.

This dual requirement dramatically raises the cost and complexity of attacks compared to traditional proof-of-work systems. Additionally, the random selection of validation tickets reduces the likelihood of coordinated manipulation.

Overall, Decred presents a comprehensive approach to blockchain design, combining security, governance, and economic sustainability. Its hybrid consensus model, treasury-driven development, and structured emission schedule position it as a unique alternative within the Layer-1 ecosystem.

While adoption and market performance depend on broader industry dynamics, Decred’s foundational architecture remains one of the most robust attempts to balance decentralization with long-term viability.

VIEW MORE

Overview

Market Cap
$213.32M
-18.1%
Volume (24H)
$10.57M
Volume (7D)
$32.60M
+9.7%
Max Supply
21,000,000 DCR
Circulating Supply
17,510,201 DCR
All-Time High
$247.35
-95.1%
All-Time Low
$0.43154
+2,729.8%
(above ATL)

Prediction Analysis

Current Price
$12.16
Sentiment
Bearish
50-Day SMA
$12.42
Price Prediction
$10.23
-15.90%
Fear & Greed Index
200-Day SMA
$19.34
Green Days
16 / last 30 (55.2%)
Volatility
3.56%
Moderate
14-Day RSI
71.90
Overbought

Profit Calculator

Select asset
%
%
Total Profit
$0
(0%)
Total Exit Amount
$0
Total Investment Fee
$0
Total Exit Fee
$0

Decred Price Prediction

Current Price
$12.16
2031
$5.12
2036
$2.15
2041
$0.91
2046
$0.38

Results are based solely on your predicted price change. They are not indicators of future performance and do not take into account different performance scenarios, historical data, or the effect of fees or other charges.

VIEW MORE

Short-Term Decred Price Targets

Date Prediction Change
Jul 15, 2026 $11.70 -3.81%
Jul 16, 2026 $11.25 -7.48%
Jul 17, 2026 $10.82 -11.00%
Jul 18, 2026 $10.41 -14.39%
Jul 19, 2026 $10.01 -17.66%
Jul 20, 2026 $9.63 -20.79%
Jul 21, 2026 $9.26 -23.81%

In the short term, DCR is attempting to stabilize after a prolonged decline, with price holding near the $10.50 support zone. This level is critical, as it has previously acted as a base for accumulation. RSI indicates oversold conditions, suggesting that selling pressure may be fading. If buyers step in and sustain momentum, the price could recover toward $20 and eventually test the $30 level. However, a failure to hold above $10.50 would weaken the bullish outlook and expose lower support levels. Overall, the short-term setup favors a recovery phase, provided current support remains intact.

VIEW MORE

Monthly Decred Price Prediction

Jun 30, 2026
$10.75
Jul 14, 2026
$12.15
Highest in Jul
$15.68
Lowest in Jul
$10.68
Overall Performance
Rising

Long-Term Decred Price Prediction

Month Price AVG Price Max Price Change
Jul $9.01 $10.59 $10.59 -25.90%
Aug $6.68 $7.84 $7.84 -45.07%
Sep $4.95 $5.81 $5.81 -59.29%
Oct $3.67 $4.31 $4.31 -69.82%
Nov $2.72 $3.19 $3.19 -77.63%
Dec $2.01 $2.36 $2.36 -83.47%
In 2026, Decred (DCR) is anticipated to trade between $2 and $11 , leading to an average annualized price of $6 . This could result in a potential return on investment of -53.26% compared to the current price.
VIEW MORE

Historical Price Performance

Year Highest Price Lowest Price
2026 (to date) $35 $11
2025 $44 $10
2024 $31 $10
2023 $27 $12
2022 $75 $18
2021 $245 $41
2020 $40 $9
2019 $35 $13
2018 $129 $14
2017 $103 $0
2016 $3 $0

DCR’s historical price performance has been characterized by cyclical expansions followed by extended correction phases. After reaching significant highs during previous market cycles, the asset experienced sharp declines, reflecting broader market conditions and reduced speculative activity. Over time, price has formed multiple consolidation ranges, with key support zones emerging around lower levels. Recent price action shows stabilization after a prolonged downtrend, suggesting a shift toward accumulation. This pattern aligns with previous cycles, where extended consolidation periods preceded upward movements. Overall, DCR’s price history highlights a tendency for gradual recovery following deep corrections.

VIEW MORE

Technical Analysis

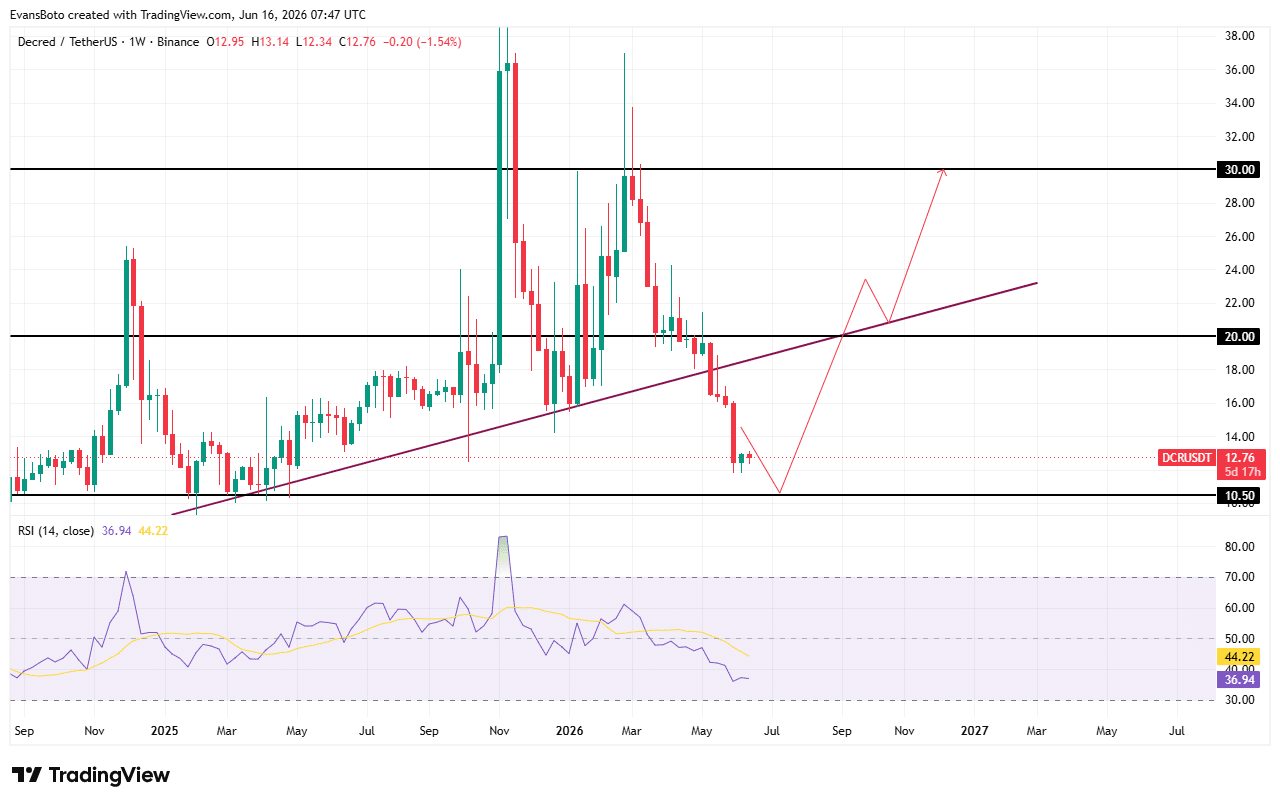
On the weekly chart, DCR is currently trading near the $12.7 region after an extended downtrend from previous highs above $30. Price recently approached the key support level around $10.50, which has historically acted as a demand zone. 

The structure suggests a potential short-term rebound, with a projected move toward the $20.00 resistance level and ultimately the $30.00 target.

RSI on the weekly timeframe sits around 36, indicating oversold conditions and suggesting that selling pressure may be weakening. This supports the likelihood of a relief rally if buyers defend the current support zone.

Source: TradingView

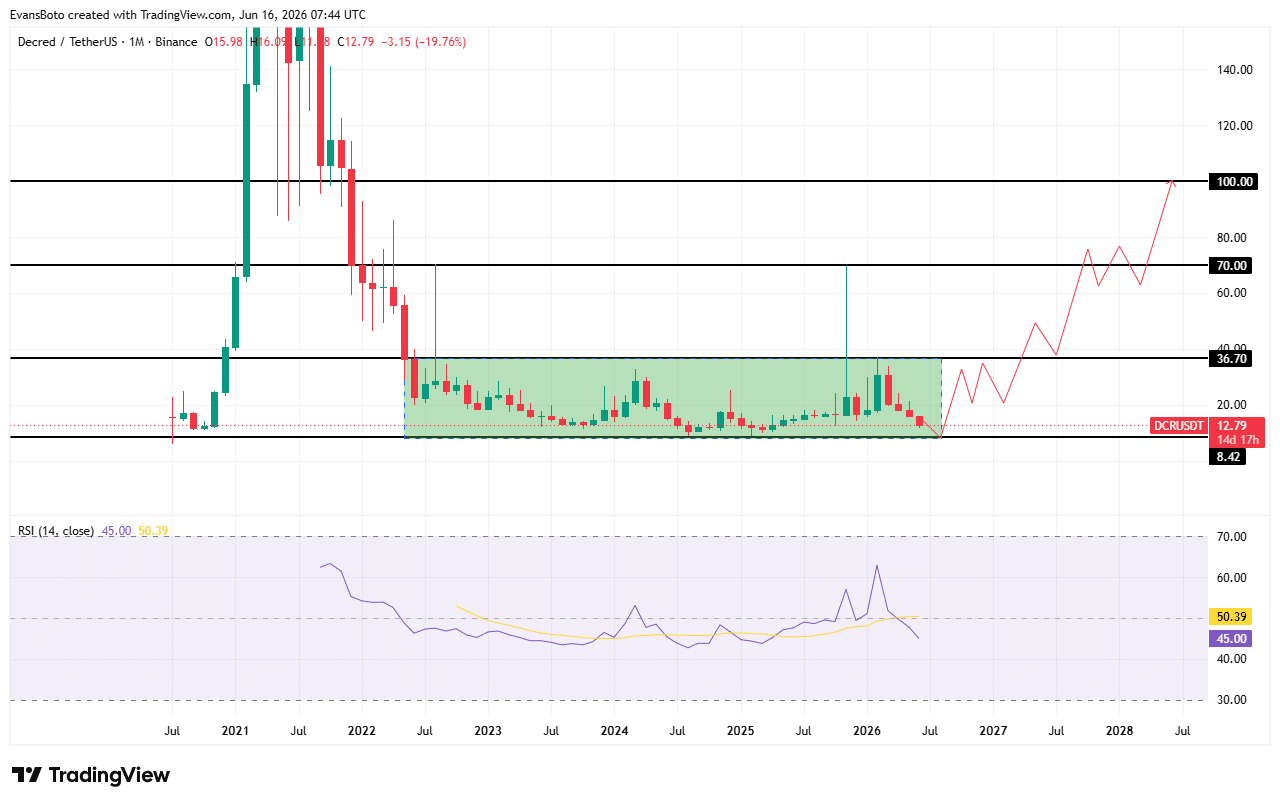
On the monthly chart, DCR shows a prolonged consolidation phase within a broad range, with price stabilizing above the $8.42 support zone. This region has historically acted as a base for accumulation, forming a long-term structure that could support upward expansion. 

The next major resistance levels are positioned at $36.70, $70.00, and $100.00, aligning with the projected long-term target. RSI on the monthly timeframe is near 45, reflecting neutral conditions with early signs of recovery.

Source: TradingView

If DCR maintains support above the current range and gradually builds momentum, a move toward $100 becomes structurally plausible over the long term.

Guides

How to Read Decred Charts and Predict Price Movements?

Most traders use candlestick charts, as they provide more information than a simple line chart. Traders can view candlesticks that represent the price action of Decred with different granularity – for example, you could choose a 5-minute candlestick chart for extremely short-term price action or choose a weekly candlestick chart to identify long-term trends. 1-hour, 4-hour, and 1-day candlestick charts are among the most popular.

Let’s use a 1-hour candlestick chart as an example of how this type of price chart gives us information about opening and closing prices. The chart is divided into “candles” that give us information about Decred’s price action in 1-hour chunks. Each candlestick will display the asset’s opening price, closing price, as well as the highest and lowest prices reached within that period.

Decred Price Prediction Indicators

Moving averages are among the most popular Decred price prediction tools. As the name suggests, a moving average provides the average closing price over a selected time frame, which is divided into a number of periods of the same length. For example, a 12-day simple moving average is calculated by summing the closing prices over the last 12 days and dividing the result by 12.

In addition to the simple moving average (SMA), traders also use another type of moving average called the exponential moving average (EMA). The EMA gives more weight to recent prices, and therefore reacts more quickly to changes in market conditions.

What Affects the Price of Decred?

Just like with any other asset, the price action of Decred is driven by supply and demand. These dynamics can be influenced by fundamental events such as block reward halvings, hard forks, or new protocol updates. Regulations, adoption by companies and governments, cryptocurrency exchange hacks, and other real-world events can also affect market sentiment.

Technical indicators such as moving averages, RSI, and trading volume are also used by traders to anticipate price movements and identify potential trend reversals.

FAQs on Decred Price Predictions

As of today, Decred (DCR) is trading at $12.16. The current market sentiment is Bearish, with RSI at 71.9 (Overbought) and volatility classified as Moderate.
Based on our technical analysis and projected annual growth rate, Decred could reach $10.23 by 2027. This estimate assumes continued market momentum and adoption trends.
According to our technical analysis indicators, the Decred price prediction is forecasted to reach $5.12 within the next five years (by 2031). Over the last 30 days, Decred recorded green days 55% of the time.
Based on multiple technical indicators, the current outlook for Decred in 2026 is Bearish. RSI currently sits at 71.9, which indicates Overbought momentum. However, investors should evaluate both technical signals and fundamental developments before making any investment decisions.
Based on long-term projections and historical crypto market cycles, Decred could reach $2.15 within the next decade (by 2036).
While Decred's future value depends on various factors, technical indicators suggest it could experience both bullish and bearish cycles over time. Long-term investors typically monitor RSI levels, moving averages, and broader market sentiment when evaluating DCR's future trajectory.
Disclaimer

AMBCrypto's content is meant to be informational in nature and should not be interpreted as investment advice. Trading, buying or selling cryptocurrencies should be considered a high-risk investment and every reader is advised to do their own research before making any decisions.