

FLOKI’s technical picture seemed to differ across timeframes. In mid-June 2026, the short-term setup leaned mildly bullish while the long-term structure sat at a level that could break either way.
On the short-term chart, FLOKI had broken down from a consolidation channel it traded inside for 118 days, between 6 February and 4 June, after months of selling pressure on the memecoin going into the year.
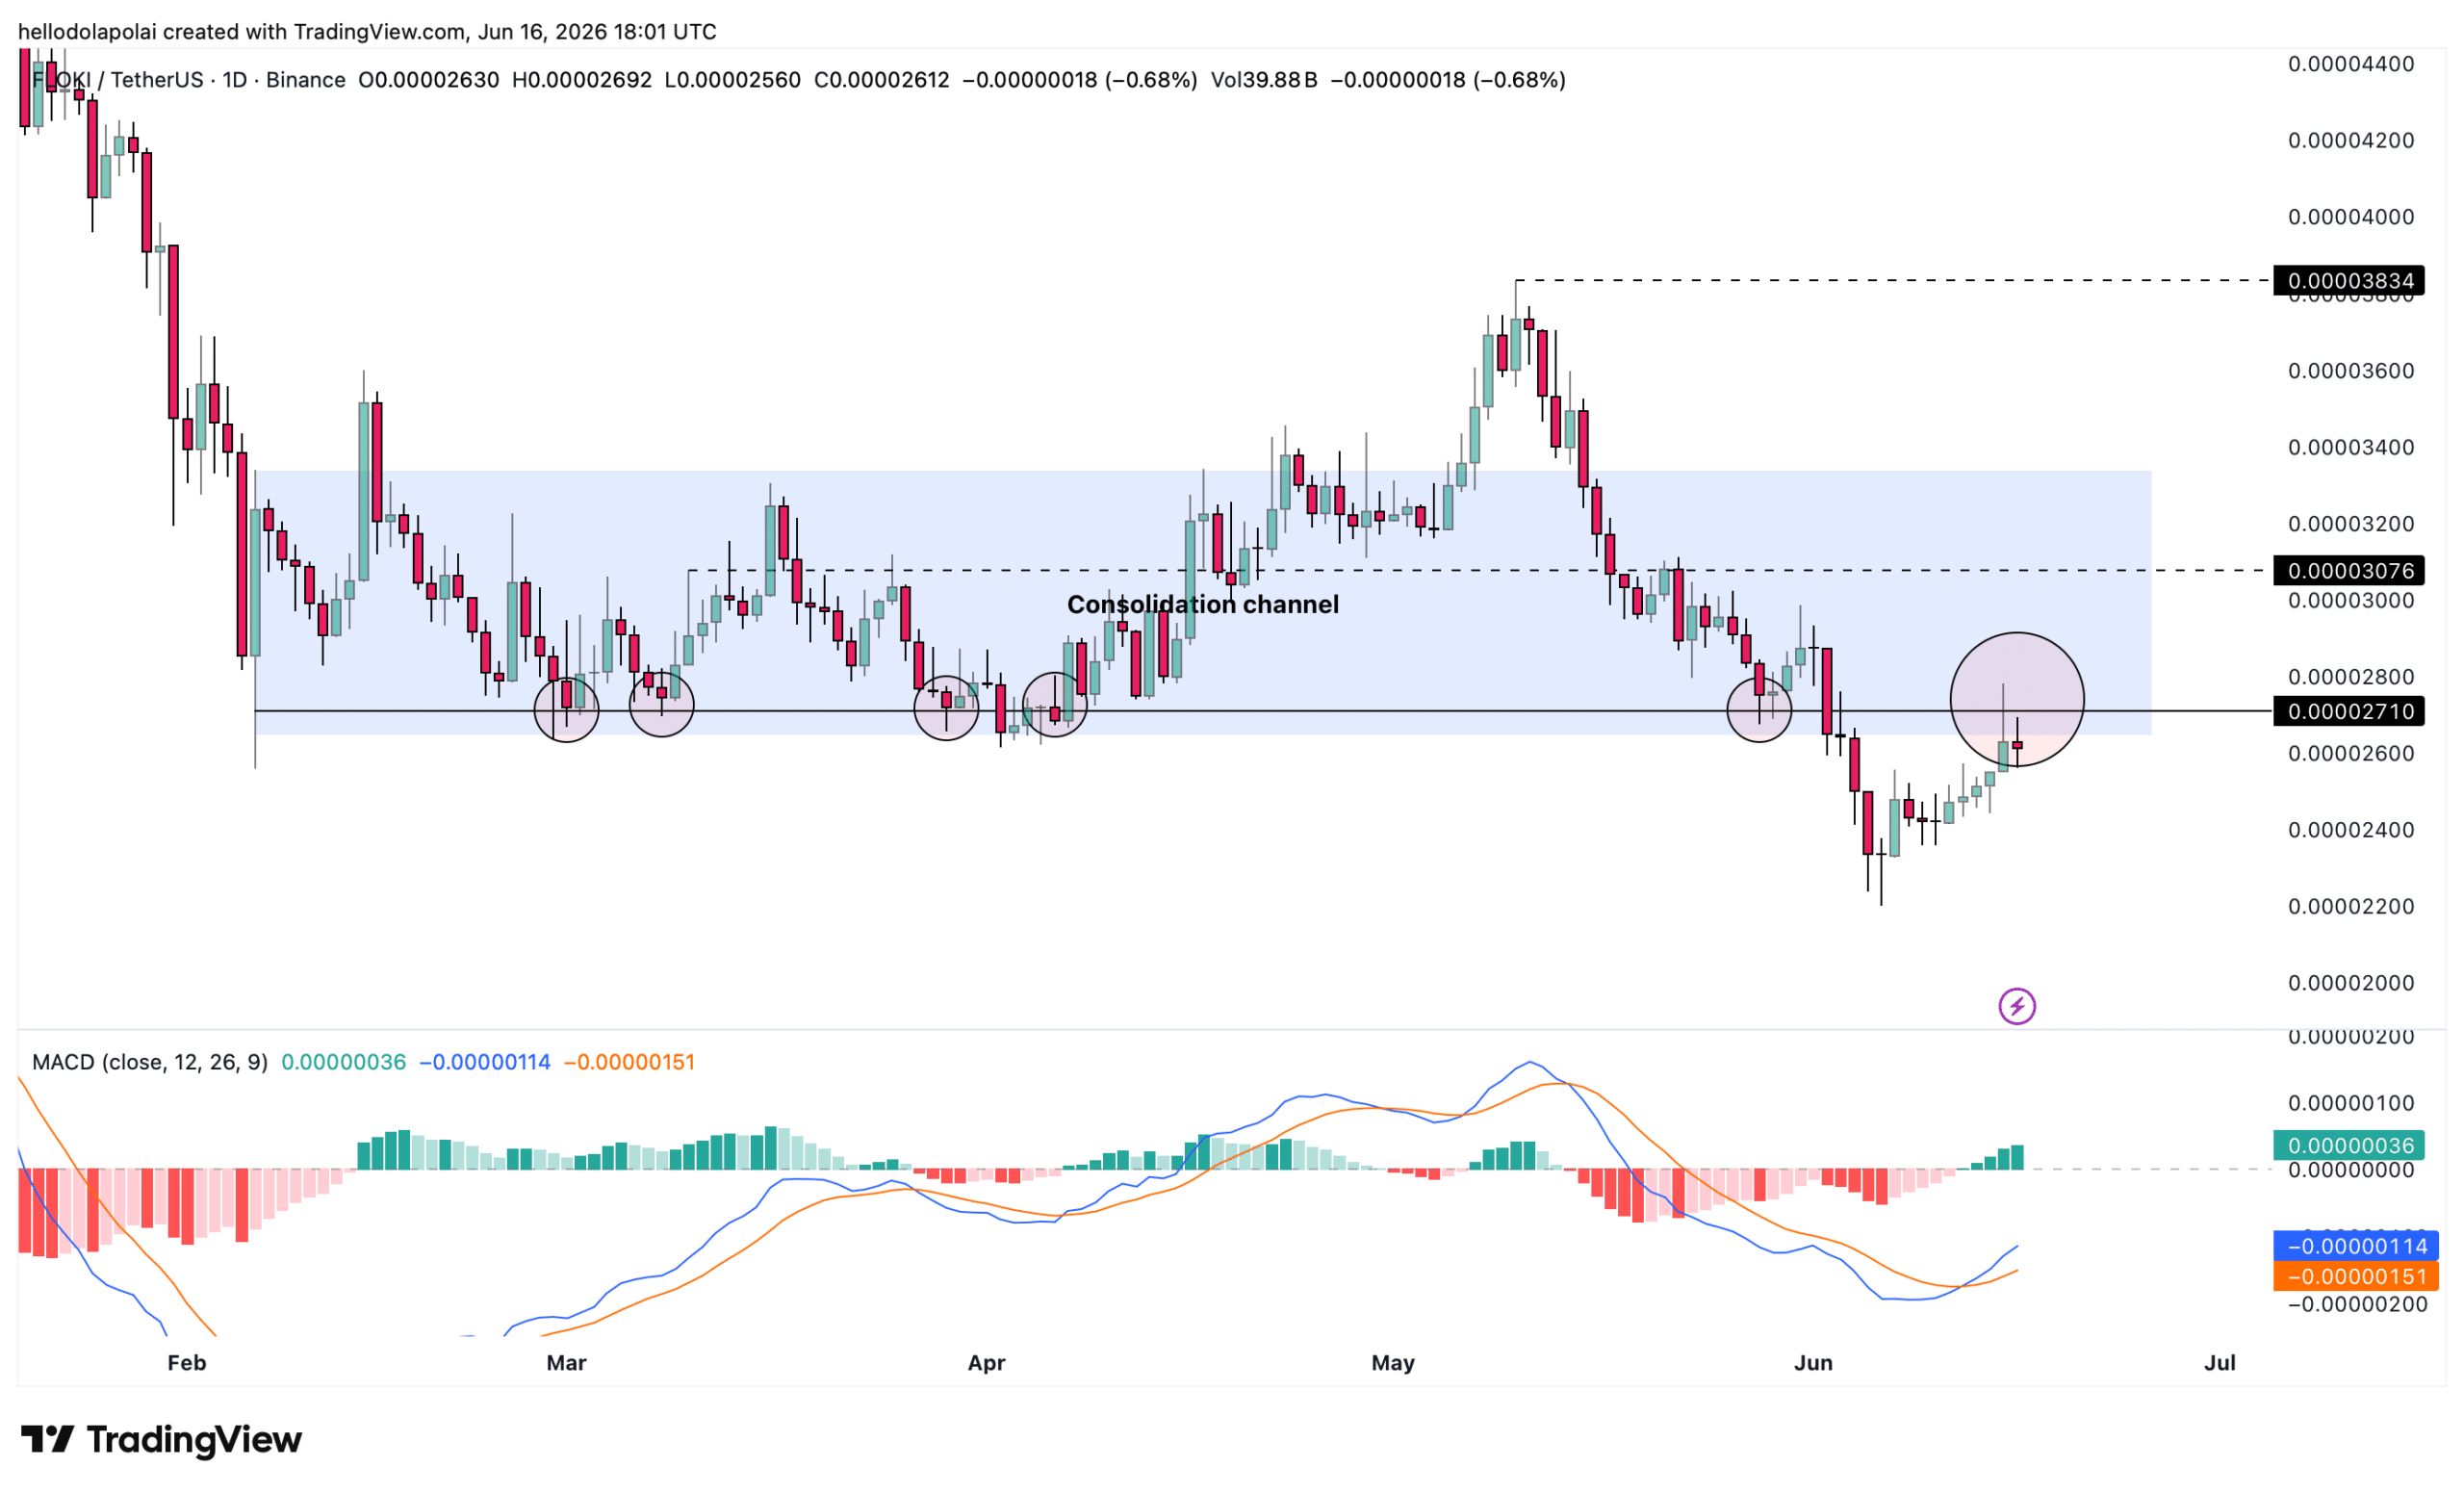
The breakdown happened when the price breached the channel’s support – A level that sparked rallies on five separate occasions. A break like this from a long-running channel usually points to a bearish continuation that carries the same downward pressure forward.
At press time, the price was recovering slightly and testing that breached support, with the same turning into resistance and already rejecting one move higher. In fact, FLOKI was making a second attempt to re-enter the zone. Reclaiming it would allude to a possible bullish recovery.
The Moving Average Convergence Divergence (MACD) indicator flashed a bullish crossover, with the MACD line (blue) crossing above the Signal line (orange). The histogram seemed to back this up too, printing rising green bars that confirmed growing bullish momentum. A re-entry into the zone would confirm that buyers are in control and a surge could follow. On the contrary, failing to reclaim the level would leave FLOKI open to a deeper drop.
The long-term picture seemed to be more mixed though. A longer rally looked possible, but it will depend on one support at $0.00002610. If price breaks below it, the next level is $0.00001524 – The last support before an all-time low.
The asset was trading inside a bullish triangle marked by horizontal support and a descending diagonal resistance – A setup that can position it for a major rally. The target in that case would be $0.00015777, assuming bullish sentiment holds.
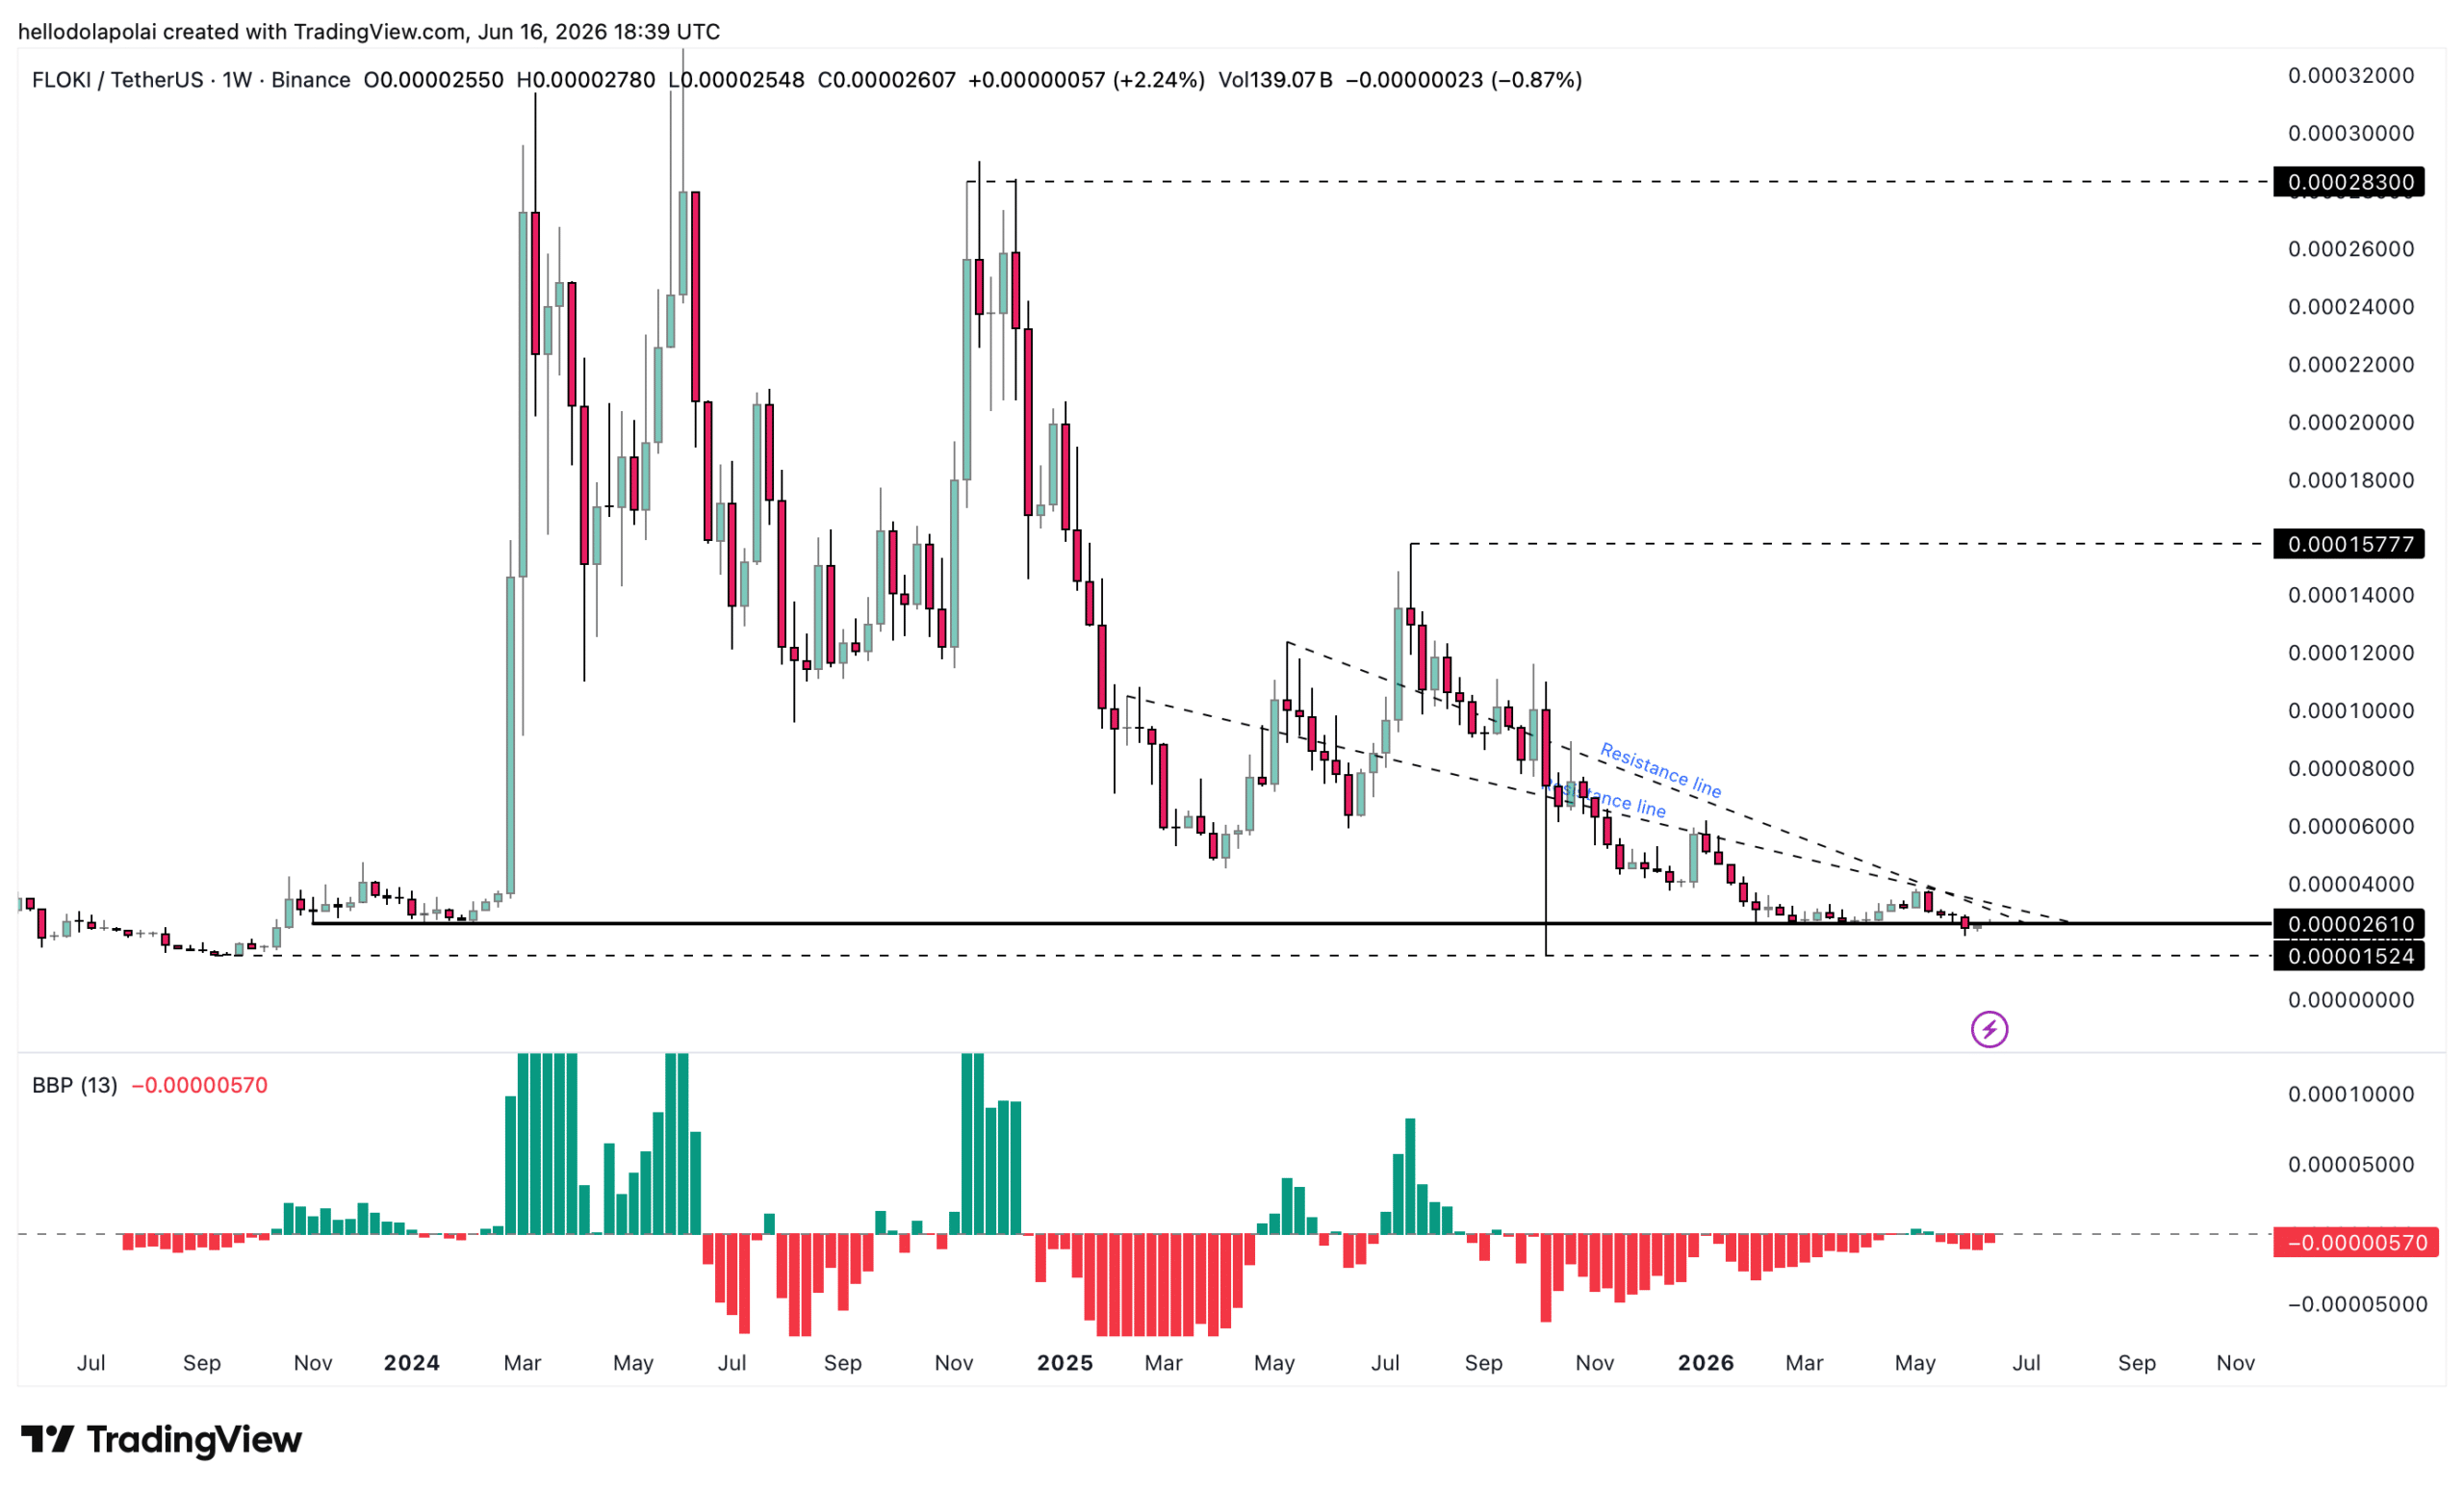
Momentum told us a different story though. The Bull Bear Power (BBP) indicator was printing red bars, repeating the earlier bearish signal and supporting the case for more downside on the charts.