Injective (INJ) is an L1 blockchain created for decentralized finance (DeFi), with infrastructure optimized for trading, derivatives and cross-chain financial applications. While general purpose blockchains are built and later on adapted to financial use cases, Injective was built from the ground up to be on-chain finance at scale.

With its architecture designed for high throughput, low latency, and a fully decentralized order book model, it allows developers to create complex financial applications like decentralized exchanges, perpetual markets, and structured products without the need for centralized intermediaries.

Originally incubated by Binance Labs, Injective launched its native INJ token through a Binance Launchpad sale on 21 October 2020. Since then, the protocol has transcended its derivatives-focused roots and become a more comprehensive financial ecosystem, with a number of financial primitives, such as lending, trading, and real-world asset integration, supported.

Users can seamlessly interact with other networks like Ethereum and Cosmos via Injective’s interoperability layer, facilitating asset transfers and transactions across various blockchain ecosystems. This inter-chain capability has made Injective a versatile layer in the growing multi-chain DeFi ecosystem.

One of the hallmarks of Injective is its decentralized on-chain order book. This sets it apart from systems that rely on automated market makers (AMMs). This model allows for more efficient price discovery, less slippage, and better execution for traders. The protocol’s features have led many to consider it a compelling choice for high-frequency traders and developers creating complex financial applications.

The INJ token is at the heart of the ecosystem and has several uses such as staking, governance, transaction fees, and as collateral. Injective’s consensus is proof-of-stake, which allows token holders to delegate or stake INJ to secure the network and generate rewards.

Governance is completely decentralized, enabling stakeholders to vote on protocol upgrades, parameter changes, and initiatives in the ecosystem. This governance structure allows the network to grow in a way that serves the community’s needs while operating efficiently.

Injective’s tokenomics are based on a robust deflationary mechanism. The total supply is limited to 100 million tokens, and the protocol has a weekly buyback-and-burn feature that burns tokens. Up to 60% of fees generated across decentralized applications on the network are used to purchase INJ from the open market and permanently burn it.  This arrangement directly correlates the amount of tokens supplied with the amount of network activity. So, the more people use a network, the more tokens will be burnt and fewer will be in circulation in the long term.

Injective is continuing to reinforce this deflationary strategy with its ongoing governance efforts and growing ecosystem. The protocol has implemented new steps to mitigate the issuance of tokens but preserve the burn dynamics, further strengthening the protocol’s long-term scarcity. Its supply reduction efforts have already seen millions of INJ tokens burned, highlighting the magnitude of the action.

This continuous decline, along with growing network traffic, is consistent with a pattern where token value is shifting to a greater degree away from speculation towards actual use.

Beyond tokenomics, Injective has continued to expand its ecosystem through infrastructure upgrades and new integrations.  The network is expected to facilitate native USDC and enhanced cross-chain transfer mechanisms, enhancing liquidity and making asset movement across various blockchains easier. Additionally, upgrades aimed at improving Ethereum compatibility through native EVM support are expected to attract more developers and applications. 

Ultimately, Injective has positioned itself as a specialized Layer-1 focused on financial applications, combining scalability, interoperability, and deflationary tokenomics into a unified system.

Sustained adoption, more trading volume, and maintaining its competitive edge in the fast-changing DeFi ecosystem will be crucial to its future expansion.

VIEW MORE

Overview

Market Cap
$499.34M
+1.7%
Volume (24H)
$34.53M
Volume (7D)
$336.34M
+1.2%
Max Supply
Circulating Supply
100,000,000 INJ
All-Time High
$52.62
-90.5%
All-Time Low
$0.657401
+657.6%
(above ATL)

Prediction Analysis

Current Price
$4.99
Sentiment
Bullish
50-Day SMA
$4.91
Price Prediction
$3.03
-39.20%
Fear & Greed Index
200-Day SMA
$4.13
Green Days
12 / last 30 (41.4%)
Volatility
3.31%
Moderate
14-Day RSI
46.72
Neutral

Profit Calculator

Select asset
%
%
Total Profit
$0
(0%)
Total Exit Amount
$0
Total Investment Fee
$0
Total Exit Fee
$0

Injective Price Prediction

Current Price
$4.99
2031
$0.41
2036
$0.03
2041
$0.00
2046
$0.00

Results are based solely on your predicted price change. They are not indicators of future performance and do not take into account different performance scenarios, historical data, or the effect of fees or other charges.

VIEW MORE

Short-Term Injective Price Targets

Date Prediction Change
Aug 03, 2026 $5.24 +5.00%
Aug 04, 2026 $5.50 +10.25%
Aug 05, 2026 $5.78 +15.76%
Aug 06, 2026 $6.07 +21.55%
Aug 07, 2026 $6.37 +27.63%
Aug 08, 2026 $6.69 +34.01%
Aug 09, 2026 $7.02 +40.71%

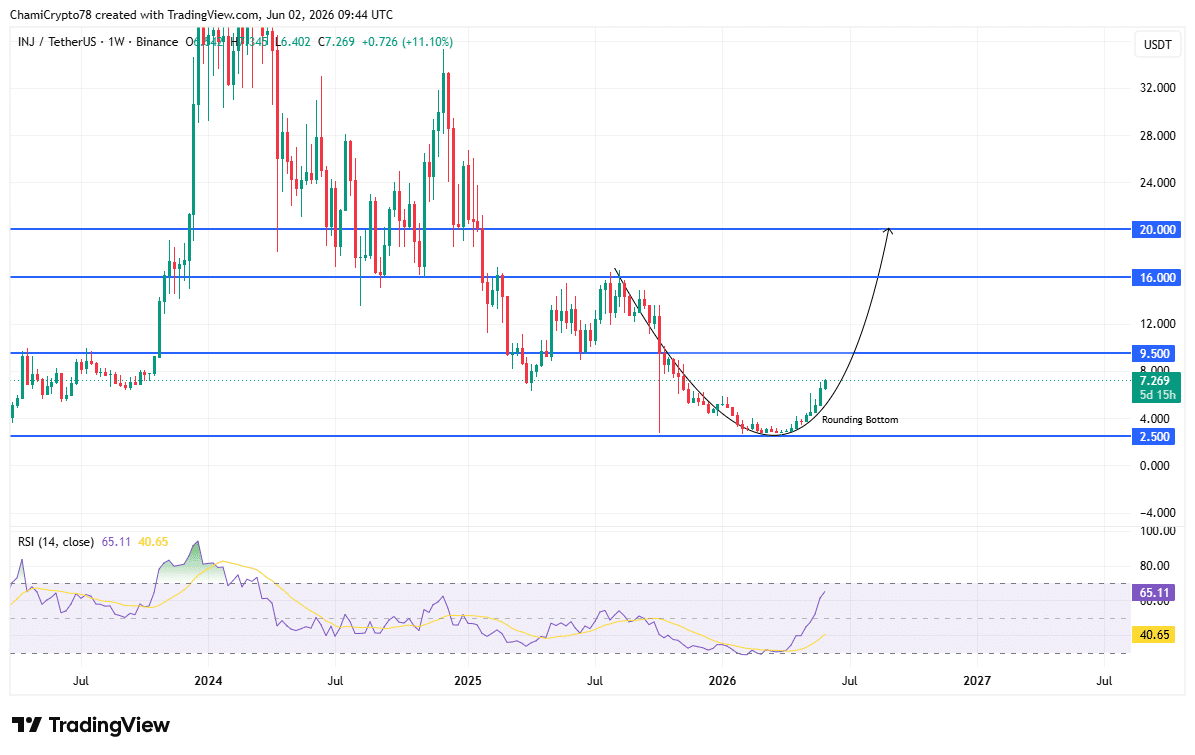
In the short term, INJ appeared to be transitioning out of a prolonged downtrend, supported by the rounding bottom structure visible on the weekly chart. By early June 2026, the price had stabilized above key support levels, indicating that selling pressure was weak with accumulation taking place too. At press time, this setup hinted at a potential move towards the $20-level, aligning with a major resistance zone and the neckline of the broader structure. If buyers maintain control and momentum continues to build, INJ could approach this level in the next few weeks. However, this move would depend on sustained demand and the ability to hold its support levels.

VIEW MORE

Monthly Injective Price Prediction

Jul 31, 2026
$4.86
Aug 2, 2026
$4.98
Highest in Aug
$5.00
Lowest in Aug
$4.82
Overall Performance
Rising

Long-Term Injective Price Prediction

Month Price AVG Price Max Price Change
Aug $7.47 $6.23 $6.23 +49.70%
Sep $11.17 $9.32 $9.32 +123.85%
Oct $16.71 $13.94 $13.94 +234.87%
Nov $24.99 $20.85 $20.85 +400.80%
Dec $37.39 $31.19 $31.19 +649.30%
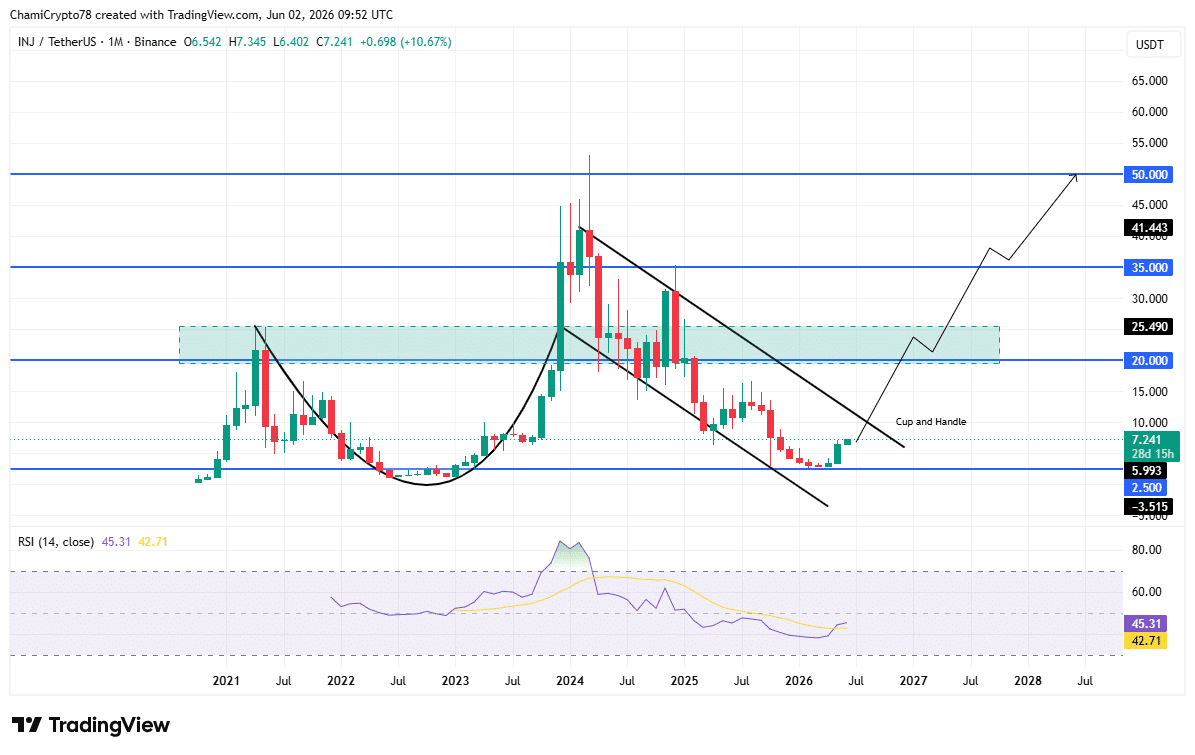
From a long-term perspective, INJ seemed to be developing a cup-and-handle formation on the monthly chart, indicating a larger accumulation phase that could precede a significant breakout. The structure suggested that once the price reclaims and holds above the $20-level, it could transition into a stronger bullish trend. This would open the path towards higher targets, with the next major objective positioned around $50. The gradual recovery in long-term RSI further supported this outlook, reflecting improving market conditions. If the broader structure completes as expected, INJ could sustain a prolonged uptrend driven by both technical and fundamental factors.
VIEW MORE

Historical Price Performance

Year Highest Price Lowest Price
2026 (to date) $7 $3
2025 $26 $4
2024 $52 $15
2023 $43 $1
2022 $9 $1
2021 $22 $4
2020 $5 $1

INJ has recorded significant price fluctuations since its launch, reflecting broader market cycles and evolving investor sentiment. Following its initial release in 2020, the token entered a strong bullish phase during the 2021 market cycle, reaching peak valuations before undergoing a prolonged correction. Throughout 2022 and 2023, the price action remained volatile, with periods of recovery followed by renewed selling pressure. More recently, INJ has transitioned into a consolidation phase, forming key structural patterns that indicate accumulation. This shift could be a sign that the market is stabilizing, with price behavior increasingly reflecting long-term positioning rather than short-term speculative activity.

VIEW MORE

Technical Analysis

In June 2026, INJ appeared to be showing early signs of structural recovery across both the weekly and monthly timeframes, with each chart presenting a distinct bullish formation reflecting different phases of market behavior.

Source: INJ/USDT, TradingView

On the weekly chart, the price developed a clear rounding bottom after an extended downtrend, signaling a gradual transition from distribution to accumulation. This structure also highlighted diminishing selling pressure, with the price stabilizing above the $5.99–$7.24 support region. If buyers continue to defend this zone, the formation might hint at a potential short-term expansion towards higher resistance levels, particularly if momentum holds. 

On the monthly timeframe, a broader cup-and-handle formation was emerging, indicating a long-term accumulation structure that spans multiple market cycles. The cup alluded to a prolonged consolidation phase, while the handle suggested a period of tightening price action before a potential breakout. The neckline near $20 remains the key level for confirming this structure, as a sustained move above it would signal a shift into a stronger bullish phase.

Source: INJ/USDT, TradingView

The RSI readings supported this outlook across both timeframes. At press time, the weekly RSI had rebounded and was trending upwards, reflecting improving short-term strength. Meanwhile, the monthly RSI recovered towards neutral levels – A sign that long-term momentum may be gradually rebuilding.

Guides

How to Read Injective Charts and Predict Price Movements?

Most traders use candlestick charts, as they provide more information than a simple line chart. Traders can view candlesticks that represent the price action of Injective with different granularity – for example, you could choose a 5-minute candlestick chart for extremely short-term price action or choose a weekly candlestick chart to identify long-term trends. 1-hour, 4-hour, and 1-day candlestick charts are among the most popular.

Let’s use a 1-hour candlestick chart as an example of how this type of price chart gives us information about opening and closing prices. The chart is divided into “candles” that give us information about Injective’s price action in 1-hour chunks. Each candlestick will display the asset’s opening price, closing price, as well as the highest and lowest prices reached within that period.

Injective Price Prediction Indicators

Moving averages are among the most popular Injective price prediction tools. As the name suggests, a moving average provides the average closing price over a selected time frame, which is divided into a number of periods of the same length. For example, a 12-day simple moving average is calculated by summing the closing prices over the last 12 days and dividing the result by 12.

In addition to the simple moving average (SMA), traders also use another type of moving average called the exponential moving average (EMA). The EMA gives more weight to recent prices, and therefore reacts more quickly to changes in market conditions.

What Affects the Price of Injective?

Just like with any other asset, the price action of Injective is driven by supply and demand. These dynamics can be influenced by fundamental events such as block reward halvings, hard forks, or new protocol updates. Regulations, adoption by companies and governments, cryptocurrency exchange hacks, and other real-world events can also affect market sentiment.

Technical indicators such as moving averages, RSI, and trading volume are also used by traders to anticipate price movements and identify potential trend reversals.

FAQs on Injective Price Predictions

As of today, Injective (INJ) is trading at $4.99. The current market sentiment is Bullish, with RSI at 46.72 (Neutral) and volatility classified as Moderate.
Based on our technical analysis and projected annual growth rate, Injective could reach $3.03 by 2027. This estimate assumes continued market momentum and adoption trends.
According to our technical analysis indicators, the Injective price prediction is forecasted to reach $0.41459 within the next five years (by 2031). Over the last 30 days, Injective recorded green days 41% of the time.
Based on multiple technical indicators, the current outlook for Injective in 2026 is Bullish. RSI currently sits at 46.72, which indicates Neutral momentum. However, investors should evaluate both technical signals and fundamental developments before making any investment decisions.
Based on long-term projections and historical crypto market cycles, Injective could reach $0.03 within the next decade (by 2036).
While Injective's future value depends on various factors, technical indicators suggest it could experience both bullish and bearish cycles over time. Long-term investors typically monitor RSI levels, moving averages, and broader market sentiment when evaluating INJ's future trajectory.
Disclaimer

AMBCrypto's content is meant to be informational in nature and should not be interpreted as investment advice. Trading, buying or selling cryptocurrencies should be considered a high-risk investment and every reader is advised to do their own research before making any decisions.