
Technical analysis of KITE hinted at a cautiously bullish outlook, with potential for sustained upward movement under the right market structure. On a year-to-date basis, the asset was already up approximately 96% in June 2026, even during a broader bearish phase in the crypto market.
The longer-term structure hinted at a possible continuation rally, with two key demand zones that may serve as critical support levels and potential catalysts for upward movement.
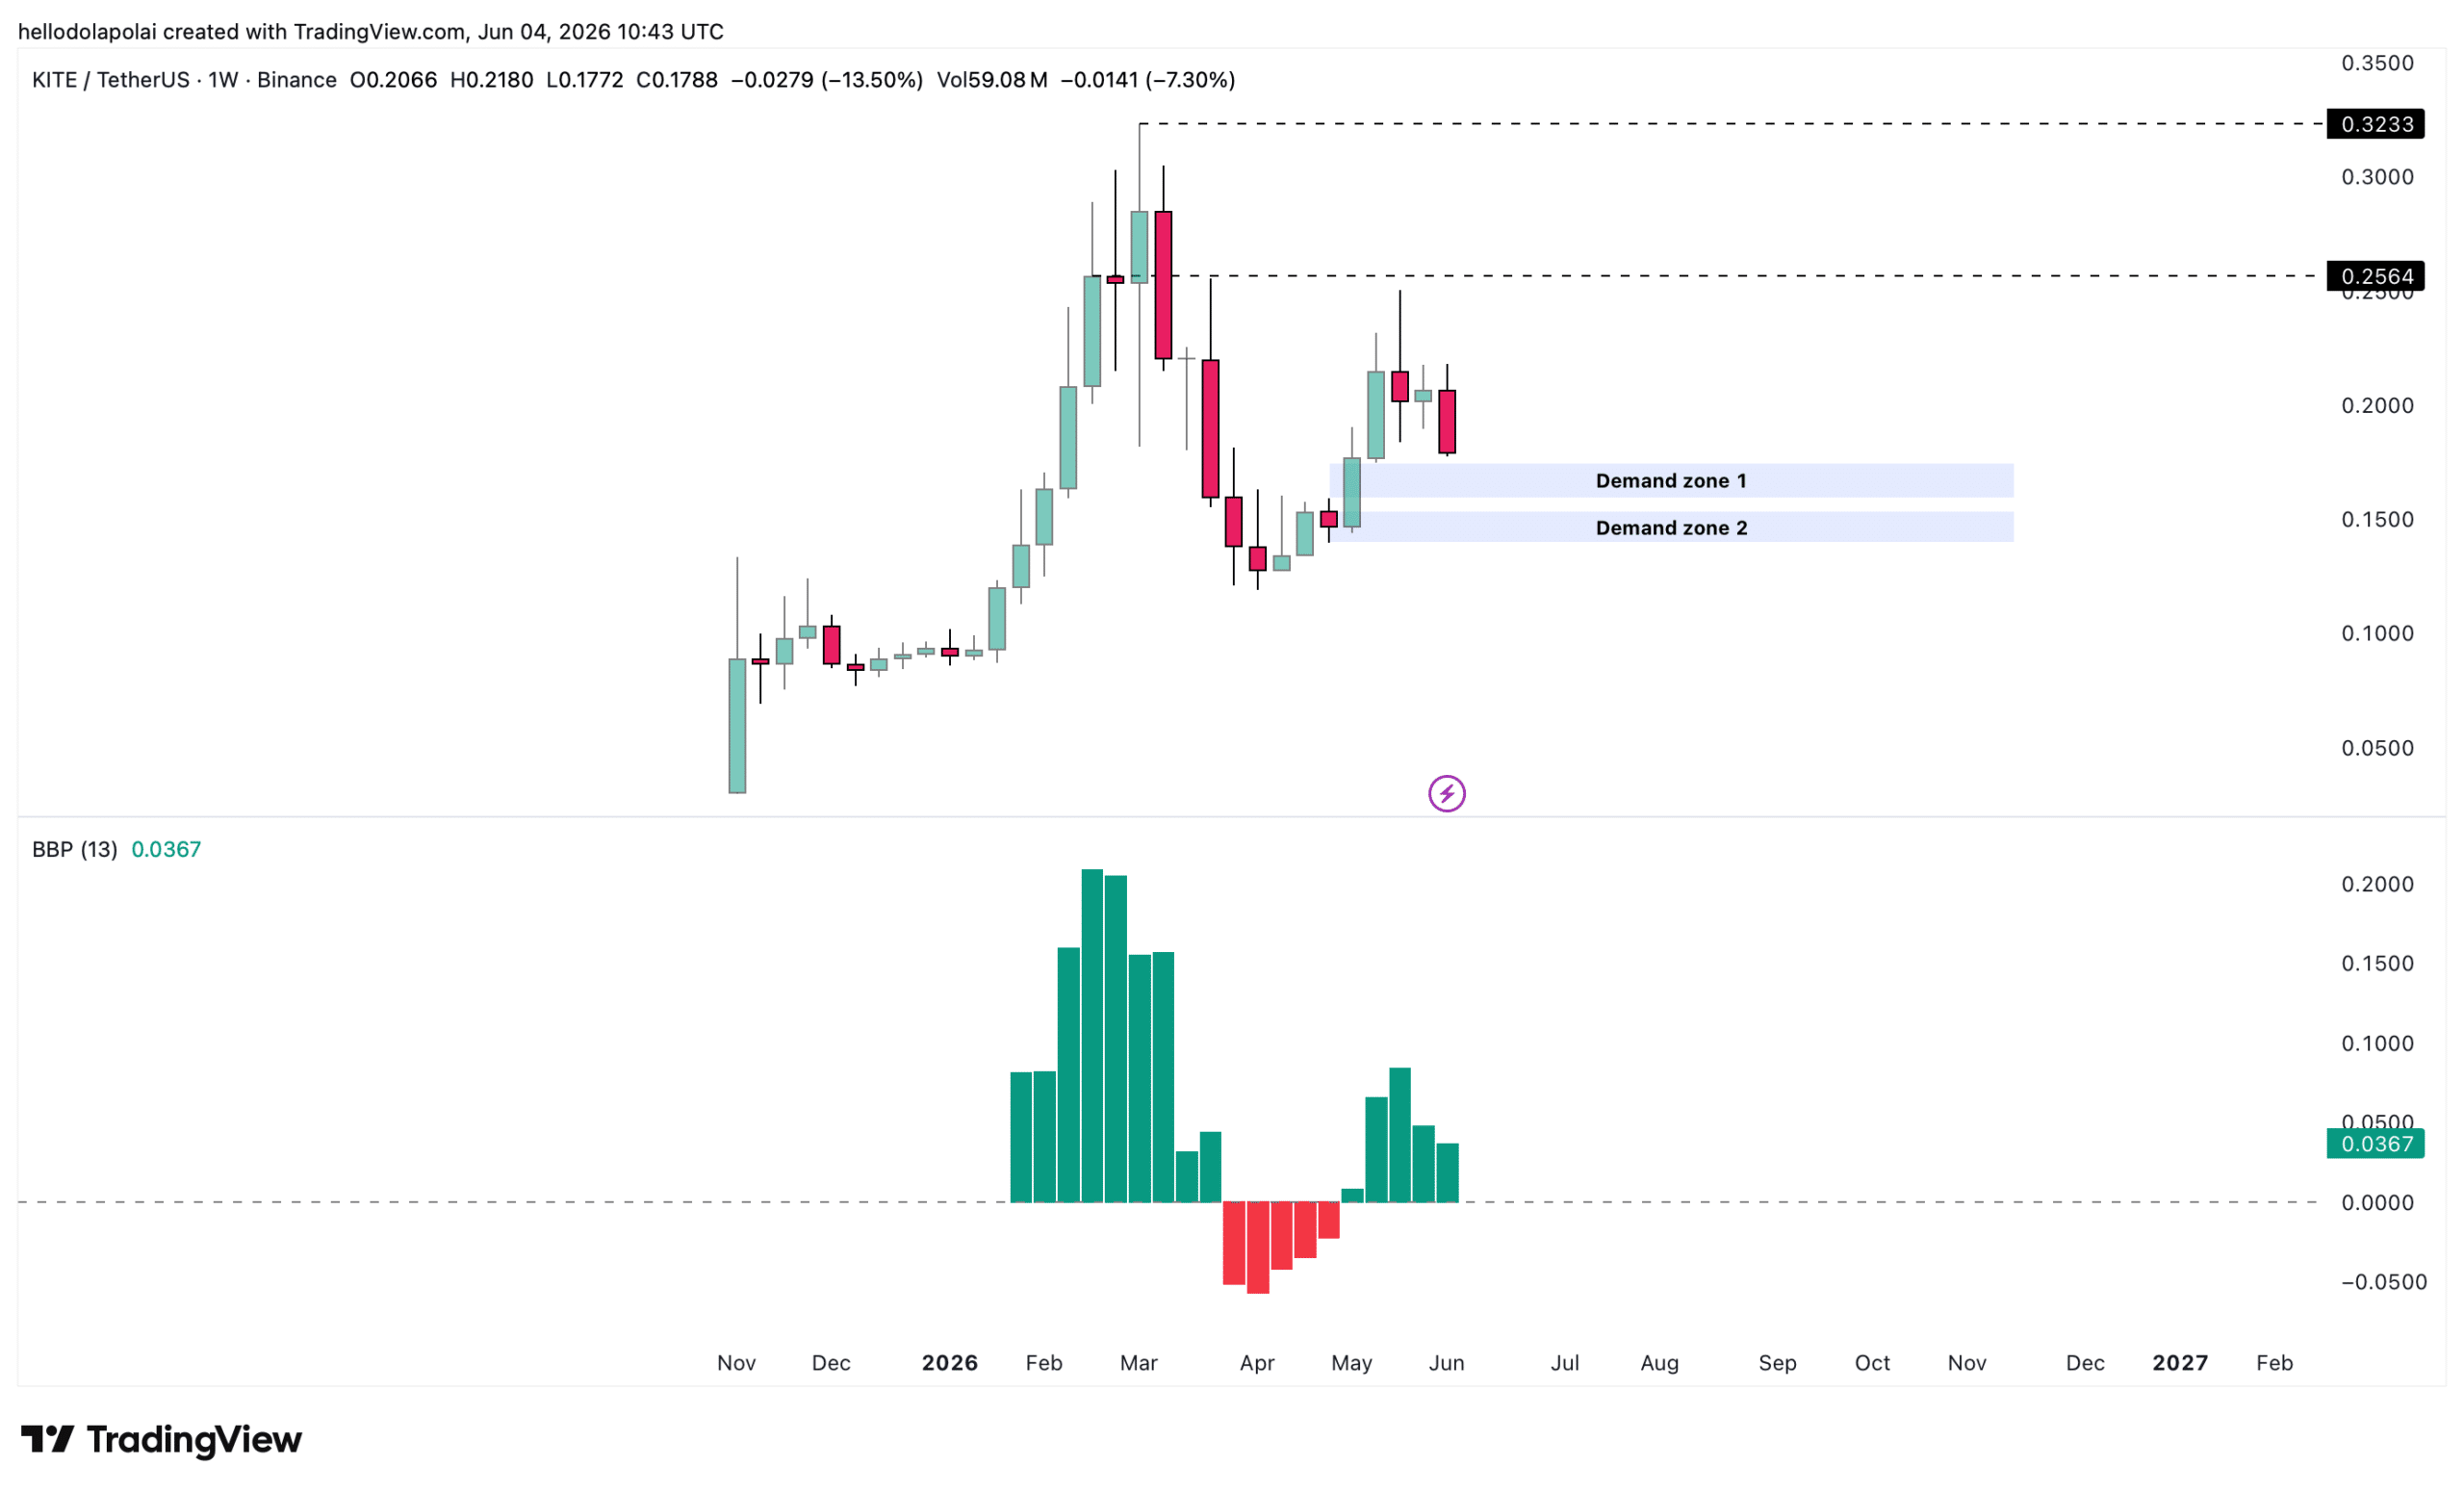
However, the price seemed to be trading below these zones. For a sustained rally to form, a retest of the first demand zone would likely be required. If this level fails to hold, attention will shift to the second demand zone. In either scenario, a successful reaction from these levels could push KITE towards higher targets, with medium- to long-term projections at $0.25 and $0.32, respectively.
The probability of these levels holding can be supported by the Bull-Bear Indicator, which measures dominant market positioning. At the time of writing, it suggested that bullish participants were still in control despite recent corrections.
In the short term, KITE’s price chart highlighted a developing bullish structure, forming a cup-and-handle pattern that typically precedes continuation breakouts. The crypto was trading near the support region of this formation. This could act as a potential launch point for upward movement.
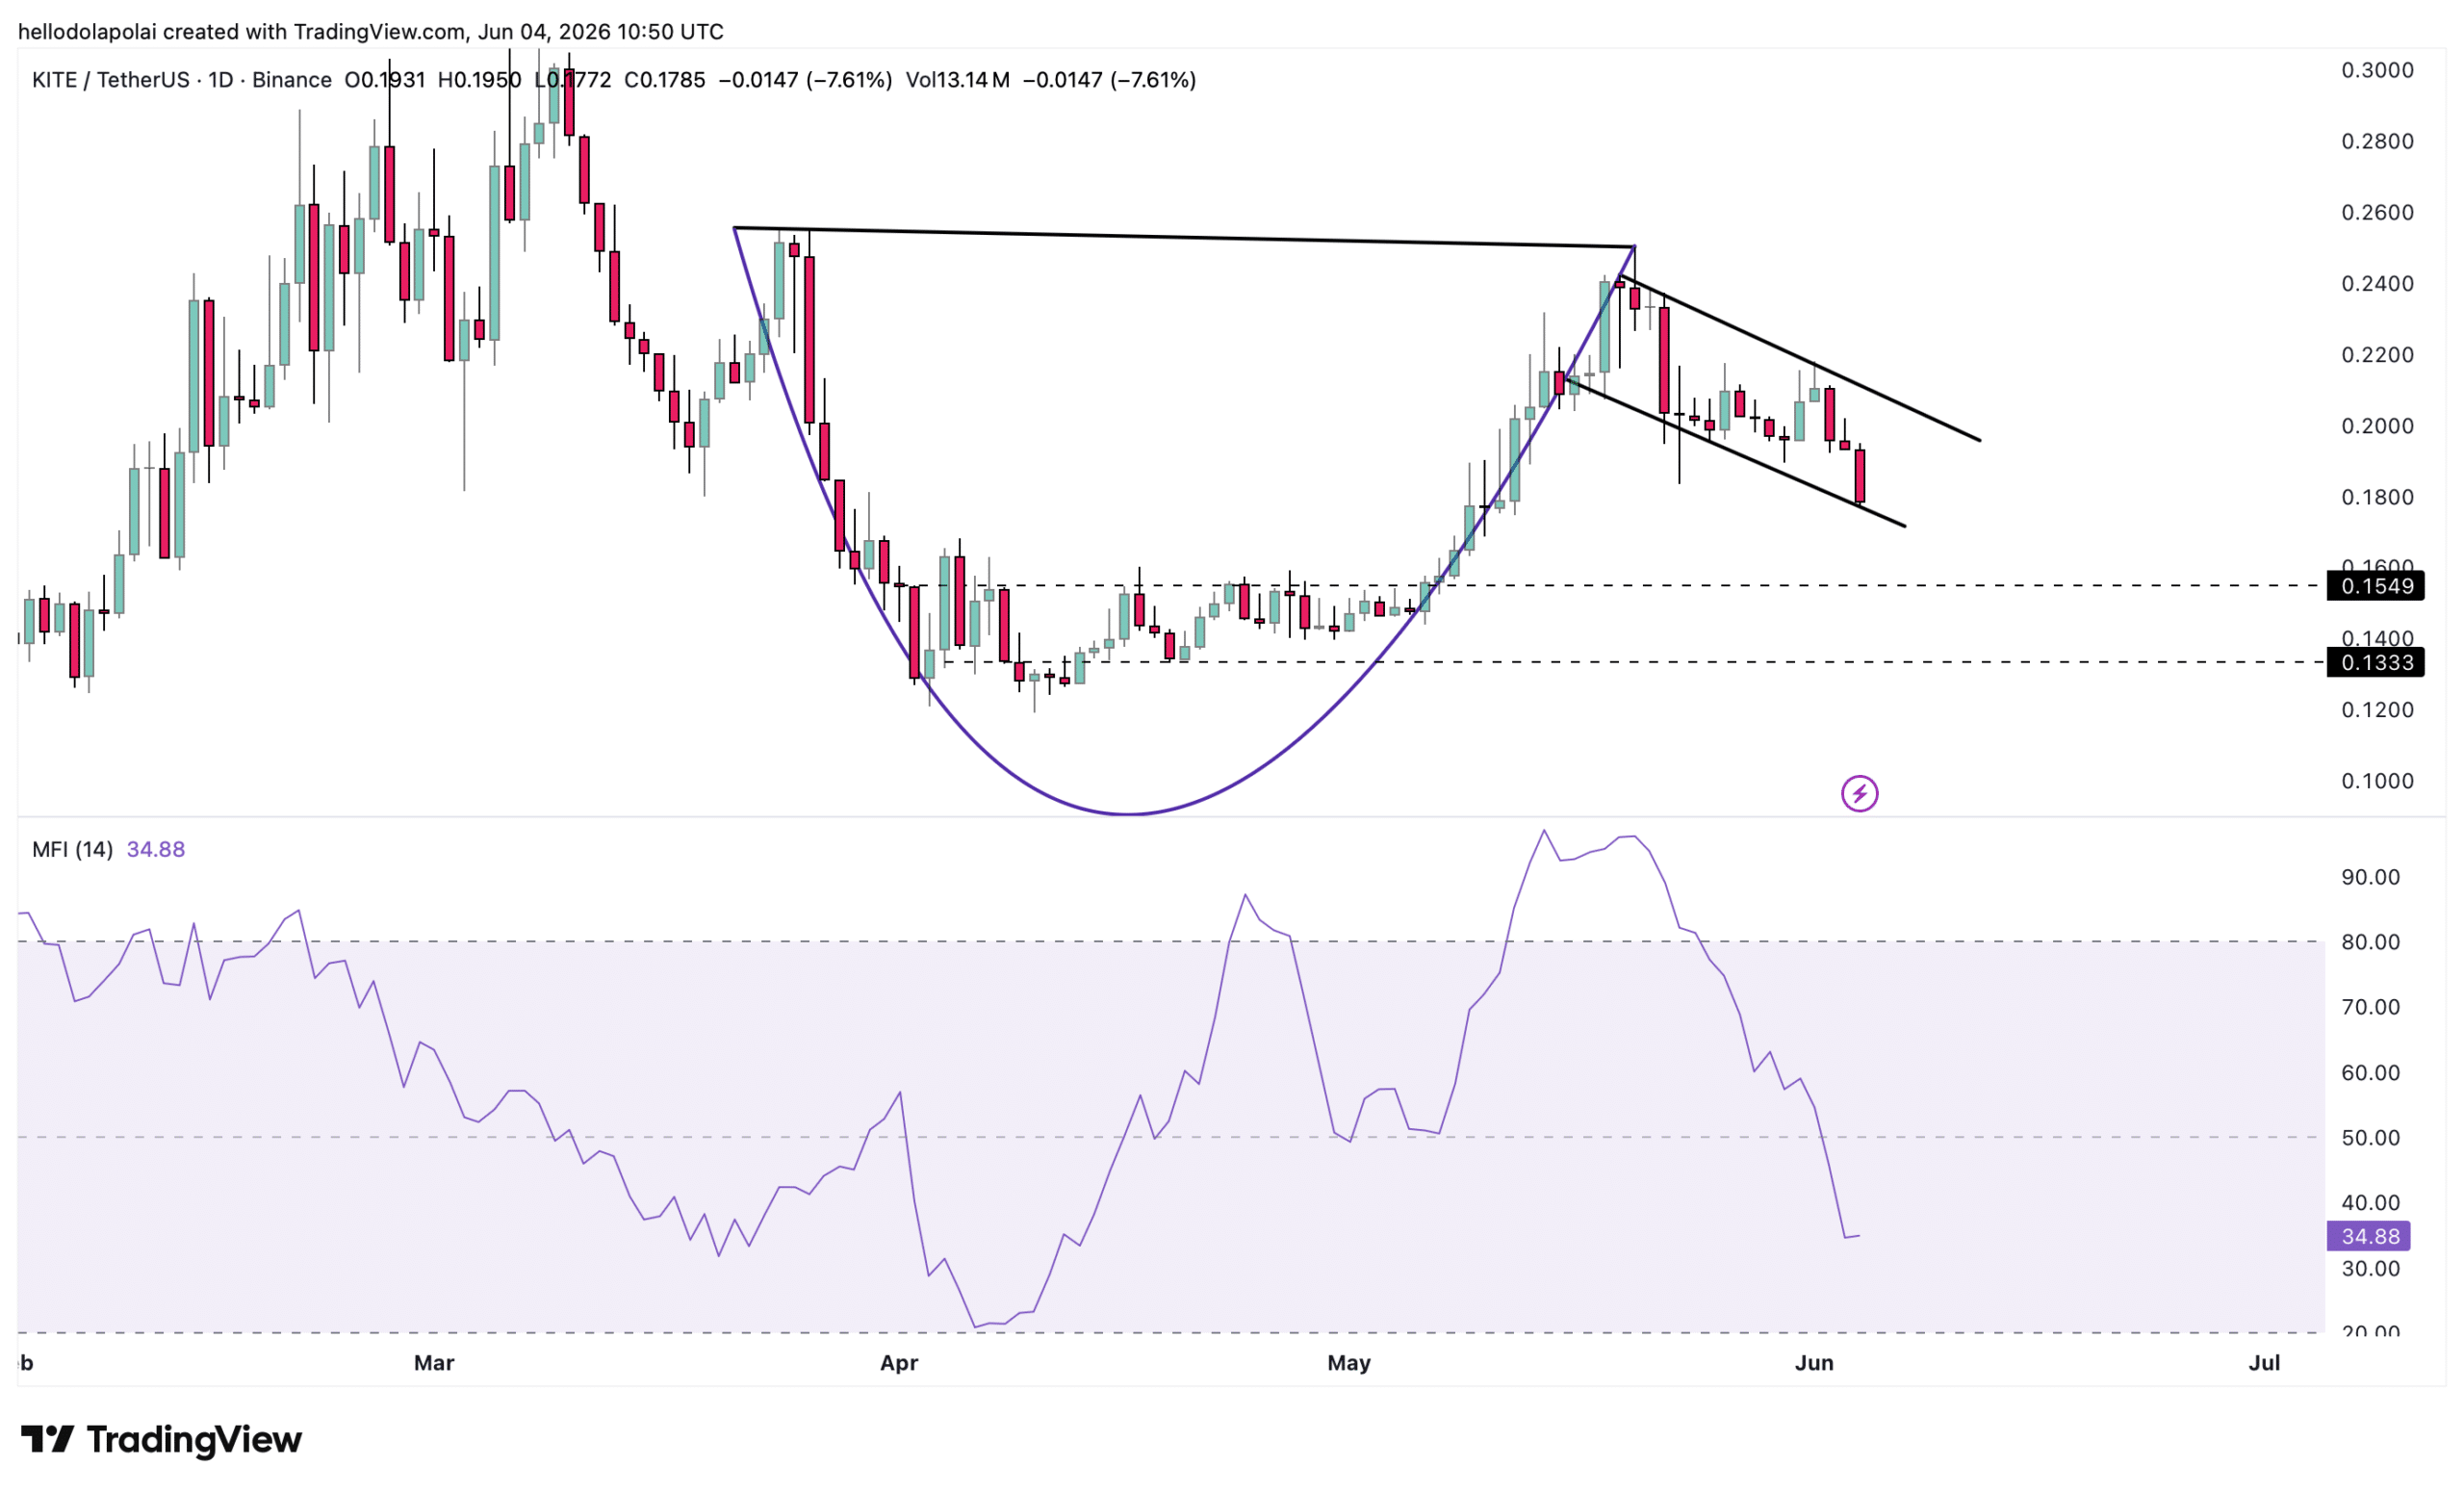
However, the Money Flow Index (MFI) presented a more cautious signal. The indicator, which tracks capital inflows and outflows, had a value of 34.88 within bearish territory. A sustained decline could trigger a retest of lower support between $0.154 and $0.133.