Tezos is a blockchain network that facilitates decentralized finance (DeFi), applications, and NFT projects. Tezos employs a proof-of-stake consensus allowing stakeholders to vote on upgrades and other major decisions.Β 

Arthur Breitman founded Tezos. He had previously worked as an engineer at Google and as a quantitative analyst at Morgan Stanley.Β In 2014, Breitman published a white paper under a pseudonym that outlined the concept behind Tezos.Β 

Breitman and the Switzerland-based Tezos Foundation organized an initial coin offering (ICO) in 2017. The 2017 ICO turned out to be a major success, raising $230 million – The largest sum ever raised at the time.Β 

However, after the ICO, the project faced many challenges, leading to a legal lawsuit. The Tezos Foundation, the Breitmans, and DynamicLedger Solutions settled the lawsuit brought by ICO participants for $25 million.Β 

In light of these problems, the Tezos community created its own foundation, the T2 Foundation – A newly formed foundation aimed at launching the network anyway if the Tezos Foundation failed to do so.Β 

In the end, John Gavers resigned as President, resolving leadership problems. After resolving the governance problems, Tezos launched its beta net, the first step before mainnet, in July 2018. In September, the Mainnet was launched, allowing users to engage in network governance.Β 

After the launch, the Tezos landscape finally began to take shape and blockchain infrastructure development continued.Β In fact, the blockchain has undergone a series of upgrades to keep up with competition in the space.

Firstly, in 2019, the Arthens upgrade introduced improvements to gas costs and smart contract functionality. The upgrade market is the first instance of a blockchain autonomously modifying its own core software via on-chain stakeholders.Β 

In 2021, the protocol underwent a Granada upgrade, which improved block times, making it faster while reducing gas consumption.Β 

In 2023, the chain underwent back-to-back updates, with the Mumbai upgrade going live in March and the Nairobi upgrade in June. The two upgrades revolutionized Tezos’ scalability, cutting block times in half and laying the groundwork for layer-2 scaling. These two upgrades ushered Tezos into an era of high-speed, rollup-centric infrastructure.Β Β 

In February 2024, Tezos conducted its 15th upgrade as Oxford 2 went live. The upgrade focused on layer-2 scalability, refined proof-of-stake (PoS) economics, and smart-contract security features.

In 2025, Tezos activated the Quebec upgrade, which effectively reduced the layer 1 block time to 8 seconds.Β 

These developments have affected the trajectory of Tezos’s native token – XTZ. Tezos’s native token XTZ operates under unique tokenomics.Β 

Here, it’s worth noting that XTZ supply remains uncapped. The token’s supply is infinite, but the circulating supply is 1.08 billion, and the issuance is responsive to staking participation.Β 

The initial token distribution saw 79.5% of the supply allocated to ICO participants, 10% to the Tezos Foundation, 10% to DLS, and 0.41% to early backers.Β 

In 2024, Tezos introduced adaptive issuance and staking as a major proof-of-stake overhaul. Adaptive issuance ties the regular issuance budget to the global staked ratio, nudging staking participation towards 50%. The blockchain’s tokenomics have left XTZ highly inflationary as supply is not declining and could increase further.Β 

Besides its tokenomics, Tezos’s market value has continued to decline too. For instance – Tezos’s Total Value Locked dropped from $199 million 2021 to $25 million – A five-year low.Β 

VIEW MORE

Overview

Market Cap
$258.42M
-1.3%
Volume (24H)
$9.71M
Volume (7D)
$116.70M
+5.0%
Max Supply
Circulating Supply
1,090,162,874 XTZ
All-Time High
$9.12
-97.4%
All-Time Low
$0.200019
+18.6%
(above ATL)

Prediction Analysis

Current Price
$0.24
Sentiment
Bearish
50-Day SMA
$0.26
Price Prediction
$0.09
-60.20%
Fear & Greed Index
200-Day SMA
$0.38
Green Days
12 / last 30 (41.4%)
Volatility
3.91%
Moderate
14-Day RSI
59.39
Neutral

Profit Calculator

Select asset
%
%
Total Profit
$0
(0%)
Total Exit Amount
$0
Total Investment Fee
$0
Total Exit Fee
$0

Tezos Price Prediction

Current Price
$0.24
2031
$0.00
2036
$0.00
2041
$0.00
2046
$0.00

Results are based solely on your predicted price change. They are not indicators of future performance and do not take into account different performance scenarios, historical data, or the effect of fees or other charges.

VIEW MORE

Short-Term Tezos Price Targets

Date Prediction Change
Jul 11, 2026 $0.23 -3.34%
Jul 12, 2026 $0.22 -6.56%
Jul 13, 2026 $0.21 -9.68%
Jul 14, 2026 $0.21 -12.69%
Jul 15, 2026 $0.20 -15.61%
Jul 16, 2026 $0.19 -18.42%
Jul 17, 2026 $0.19 -21.14%

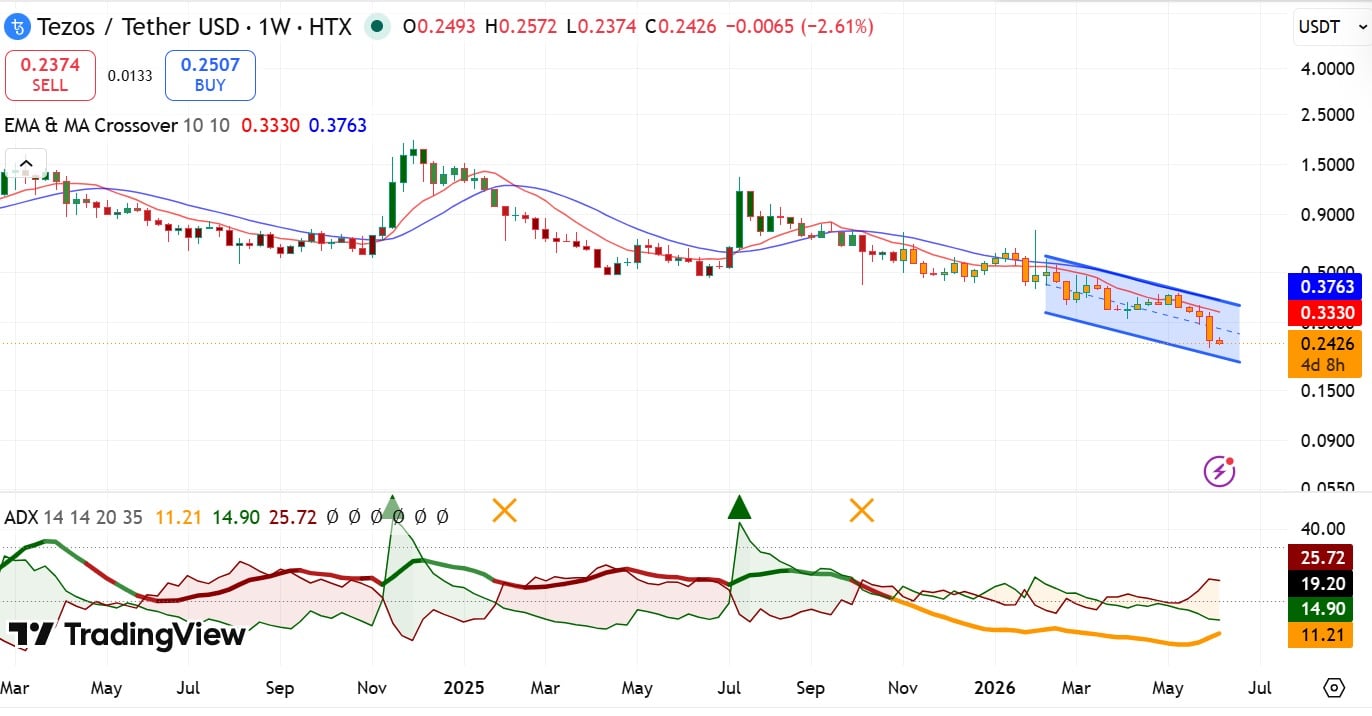
At the time of writing, Tezos was trading at around $0.24, having avoided further slip, and bottomed at $0.23. O Over the past month, XTZ has traded within a downtrend after the attempted rebound failed at $0.40. In fact, the altcoin has traded below its EMA since February and below its MA since mid-May. A prolonged stay below both MA and EMAs meant that the market appeared to be strongly bearish in June 2026. If the weakness persists, we could see a slip below $0.2 in the short term. To invalidate the short-term pressure, the altcoin must climb above its MA at $0.33 and target the EMA at $0.4.

VIEW MORE

Monthly Tezos Price Prediction

Jun 30, 2026
$0.20
Jul 10, 2026
$0.24
Highest in Jul
$0.26
Lowest in Jul
$0.20
Overall Performance
Rising

Long-Term Tezos Price Prediction

Month Price AVG Price Max Price Change
Jul $0.14 $0.19 $0.19 -40.94%
Aug $0.08 $0.11 $0.11 -66.25%
Sep $0.05 $0.06 $0.06 -78.91%
Oct $0.03 $0.04 $0.04 -87.34%
Nov $0.02 $0.02 $0.02 -91.56%
Dec $0.01 $0.01 $0.01 -95.78%
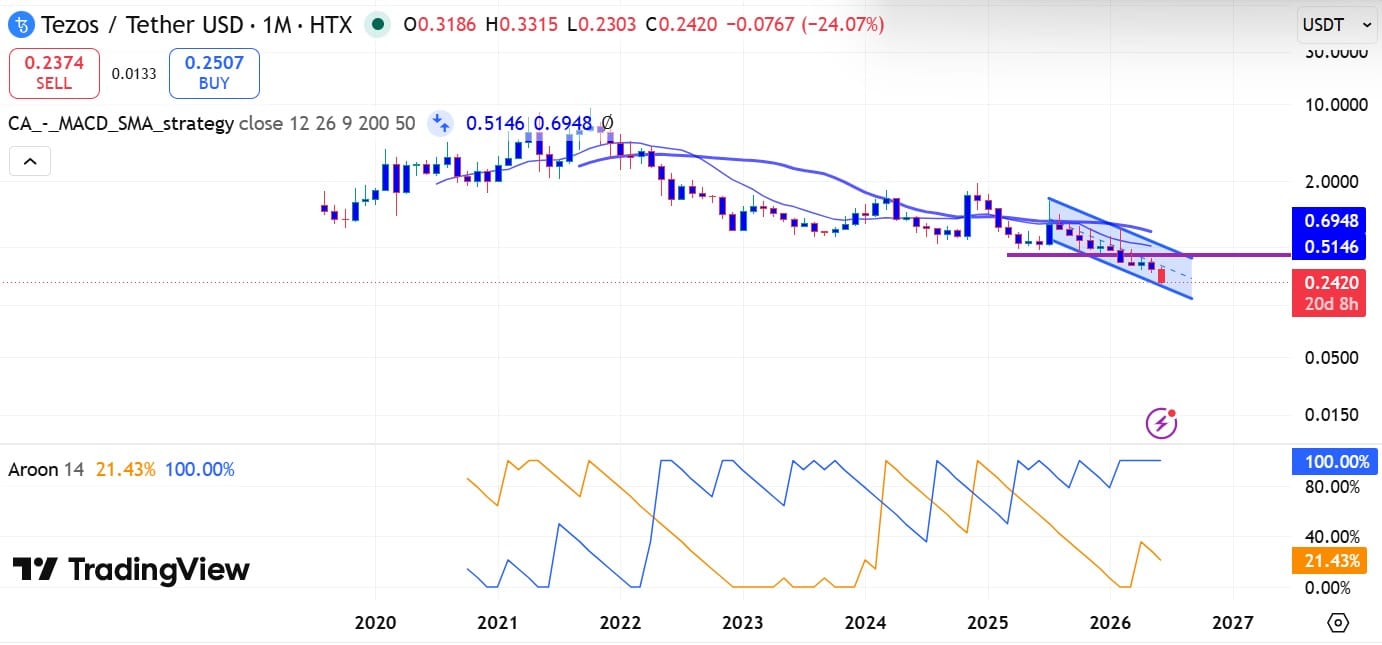
In the long term, Tezos has remained entrenched within a bearish structure. In fact, the altcoin has traded within a downtrend since November 2024, with lower lows. In 2026, the bearish pressure has been extremely strong. XTZ has traded below the MACD-SMA indicator since January, reflecting the trend’s strength. At the same time, the Aroon Down sat extremely above the Up line at press time, confirming the likelihood of the trend’s continuation. At the time of writing, Tezos seemed to be testing $0.24 support - A failure to hold this level will see the altcoin fall below $0.2. On the other hand, to clear this weakness, XTZ needs to flip the $0.43 support and close above the SMA at $0.51 and $0.69, respectively.
VIEW MORE

Historical Price Performance

Year Highest Price Lowest Price
2026 (to date) $1 $0
2025 $1 $0
2024 $2 $1
2023 $1 $1
2022 $5 $1
2021 $9 $2
2020 $4 $1
2019 $2 $0
2018 $3 $0

After falling to a 2019 low of $0.74 in October, Tezos embarked on a strong uptrend. In fact, the altcoin traded within an ascending channel between 2019 and 2021, with higher highs and higher lows accompanied by periodic pullbacks. In 2020, the altcoin rallied through January to a high of $3.9 in mid-February. COVID-19 hit, and the market crashed to $0.94 in mid-March. The COVID dip was short-lived though as the altcoin rebounded shortly to a 2020 high of $4.49 in August. The year ended on a bearish note, with the altcoin hovering around $2. 2021 started with bullish momentum and rallied to an all-time high of $8.4 in May. However, the altcoin crashed heavily to a 2021 low of $2.1. The market rebounded strongly soon after, reaching a new ATH of $9.1 in October. After this rally, the market cooled off, and the year ended under strong pressure. 2022 saw a strong downtrend, falling from $5.3 to a yearly low of $0.7, with XTZ trading in a downtrend throughout the year. 2023 was no different. While it jumped to $1.48, it crashed, reaching a low of $0.61. Towards year-end, bullish momentum strengthened and extended into March 2024, reaching $1.6. The market crashed again until November, when the bull market started, with the altcoin rallying to $1.9. The year ended on a downtrend, with 2025 holding bearish until June, when the price reached $1.3. Since then, Tezos has traded within a descending channel, with 2026 as a whole being bearish for the altcoin.

VIEW MORE

Technical Analysis

In early June 2026, Tezos seemed to be exhibiting structural weakness after spending extended time below key levels. Since breaching the $0.43 support, downward pressure intensified across the board.Β 

At press time, the altcoin was trading below its short- and long-term moving averages. This trajectory revealed strong market weakness with bearish pressure being dominant. On top of that, the negative index (-DI) rose to 25, while the +DI dropped to 14. Under these circumstances, the downtrend seemed to be strong, with the market well positioned for more losses too.Β 

Source: XTZ/USDT, TradingView

Therefore, if prevailing conditions persist, the downtrend will continue, and Tezos is likely to lose the $0.24 support and fall to $0.20 in the short term.Β 

Over the long term too, the structure appeared to be bearish. The Aroon Down on monthly charts sat at around 100%, while the Aroon Up sat at around 21%. This suggested that the downtrend was strong and bearish pressure was dominant. With XTZ also sitting below its SMA, there was further confirmation of the downtrend.Β 

Source: XTZ/USDT, TradingView

Therefore, if the bearishness persists, June will close at lower lows, fall below $0.23, and likely breach the $0.20.Β 

On a positive note, if the crypto market cools down and rebounds, Tezos could also recover. The altcoin has tended to rebound when the overall market has risen. For a bullish reversal, XTZ needs a close above $0.42. In doing so, the altcoin will target $0.51 in July and $0.69 in three to six months. If the year ends on such a positive note, 2027 will be overly bullish and flip $1.Β 

Guides

How to Read Tezos Charts and Predict Price Movements?

Most traders use candlestick charts, as they provide more information than a simple line chart. Traders can view candlesticks that represent the price action of Tezos with different granularity – for example, you could choose a 5-minute candlestick chart for extremely short-term price action or choose a weekly candlestick chart to identify long-term trends. 1-hour, 4-hour, and 1-day candlestick charts are among the most popular.

Let’s use a 1-hour candlestick chart as an example of how this type of price chart gives us information about opening and closing prices. The chart is divided into β€œcandles” that give us information about Tezos’s price action in 1-hour chunks. Each candlestick will display the asset’s opening price, closing price, as well as the highest and lowest prices reached within that period.

Tezos Price Prediction Indicators

Moving averages are among the most popular Tezos price prediction tools. As the name suggests, a moving average provides the average closing price over a selected time frame, which is divided into a number of periods of the same length. For example, a 12-day simple moving average is calculated by summing the closing prices over the last 12 days and dividing the result by 12.

In addition to the simple moving average (SMA), traders also use another type of moving average called the exponential moving average (EMA). The EMA gives more weight to recent prices, and therefore reacts more quickly to changes in market conditions.

What Affects the Price of Tezos?

Just like with any other asset, the price action of Tezos is driven by supply and demand. These dynamics can be influenced by fundamental events such as block reward halvings, hard forks, or new protocol updates. Regulations, adoption by companies and governments, cryptocurrency exchange hacks, and other real-world events can also affect market sentiment.

Technical indicators such as moving averages, RSI, and trading volume are also used by traders to anticipate price movements and identify potential trend reversals.

FAQs on Tezos Price Predictions

As of today, Tezos (XTZ) is trading at $0.237052. The current market sentiment is Bearish, with RSI at 59.39 (Neutral) and volatility classified as Moderate.
Based on our technical analysis and projected annual growth rate, Tezos could reach $0.094347 by 2027. This estimate assumes continued market momentum and adoption trends.
According to our technical analysis indicators, the Tezos price prediction is forecasted to reach $0.002367 within the next five years (by 2031). Over the last 30 days, Tezos recorded green days 41% of the time.
Based on multiple technical indicators, the current outlook for Tezos in 2026 is Bearish. RSI currently sits at 59.39, which indicates Neutral momentum. However, investors should evaluate both technical signals and fundamental developments before making any investment decisions.
Long-term forecasts indicate that Tezos may continue to grow over the next decade if adoption, technology development, and global crypto demand continue to expand.
While Tezos's future value depends on various factors, technical indicators suggest it could experience both bullish and bearish cycles over time. Long-term investors typically monitor RSI levels, moving averages, and broader market sentiment when evaluating XTZ's future trajectory.
Disclaimer

AMBCrypto's content is meant to be informational in nature and should not be interpreted as investment advice. Trading, buying or selling cryptocurrencies should be considered a high-risk investment and every reader is advised to do their own research before making any decisions.