
- Analysis of FET’s 4-hour chart revealed that its accumulation phase began on 6 August
- Indicators and on-chain metrics pointed to bearish dominance over the altcoin
Despite its best efforts, FET has not fully recovered from the broader market downturn and remains stuck in an accumulation phase. How it copes with it will dictate its short-term direction on the price charts.
Typically, during such a phase, the asset’s price neither climbs significantly nor plummets, maintaining a balance. At the time of writing, FET was trading at $0.839, with the crypto down by just over 1% over the past week while its market cap fell by 3%.
In light of FET’s press time status, the looming question is whether it will rally or decline. AMBCrypto thus delved into various metrics to forecast these potential outcomes.
Understanding FET’s accumulation phase
An accumulation phase is marked by defined resistance and support lines that act as constraints, preventing the price from breaking out upwards or downwards. This phase often precedes a directional breakout, driven by an imbalance in buying or selling pressures.
Utilizing Fibonacci retracement lines to determine potential support and resistance zones, AMBCrypto can predict FET’s next movement. However, this is dependent on the imbalance between buyers and sellers.
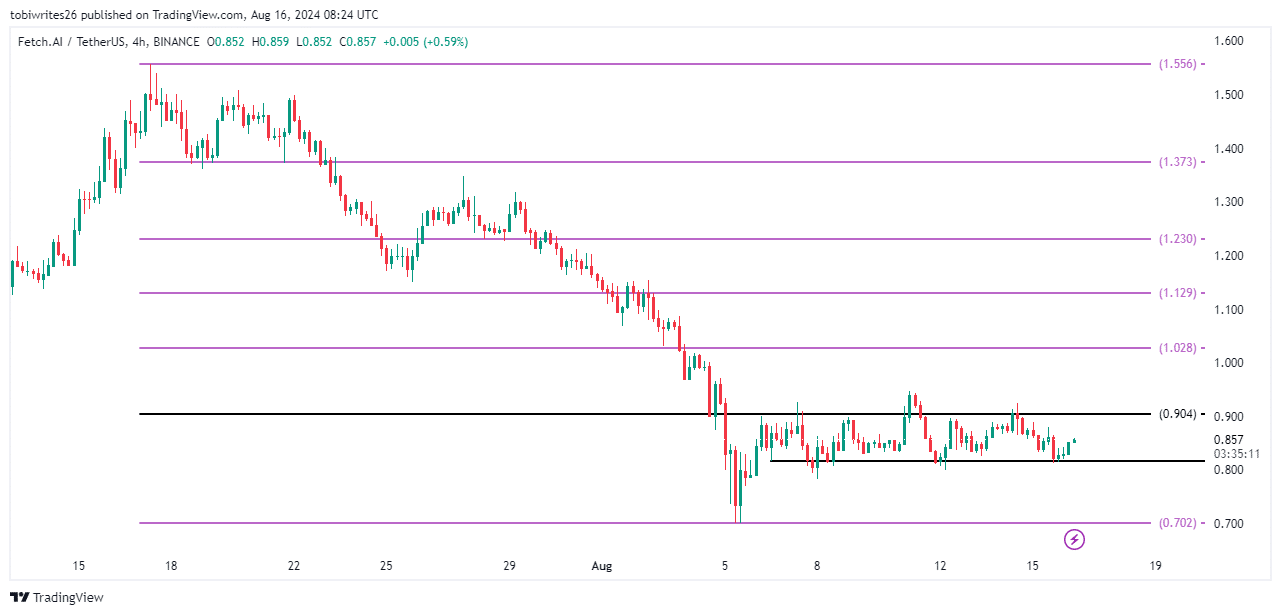
Source: FET/USD, TradingView
Should there be an uptick in buying pressure/imbalance, FET might rally to $1.028. On the flip side, dominant selling pressure could push FET down to $0.702.
Decline to $0.7 appears more imminent for FET
Using the Aroon indicator and Moving Average Convergence Divergence (MACD), AMBCrypto can project a likely decline towards $0.7.
The Aroon indicator consists of two lines: Aroon Up (time since the highest price) and Aroon Down (time since the lowest price). When Aroon Up (orange) is above Aroon Down (blue), it signals an uptrend. On the other hand, when Aroon Down is higher, it indicates a downtrend.
When assessing FET, the Aroon Down was above the Aroon Up, suggesting that there may be impending bearish sentiment in the market.
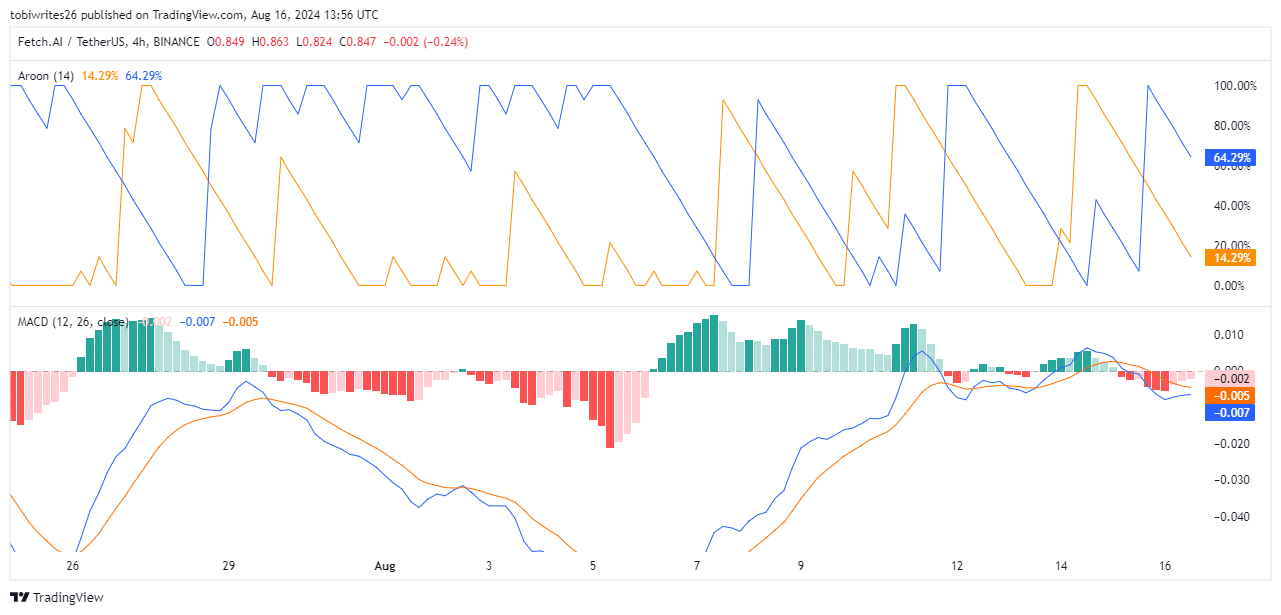
Source: FET/USD, TradingView
Additionally, the MACD, which tracks the difference between two moving averages, was negative at press time. This seemed to reinforce the altcoin’s prevailing bearish outlook too
The combination of Aroon and the MACD’s analysis supported the likelihood of FET facing a downward adjustment due to a hike in selling pressure.
FET’s daily active addresses fall
When a token faces a drop in daily active addresses, it signifies reduced trading and participation, generally leading to a price decline on the charts. In FET’s case, data from Santiment revealed a consistent drop in daily active addresses over the last 24 hours – A sign of declining market interest.
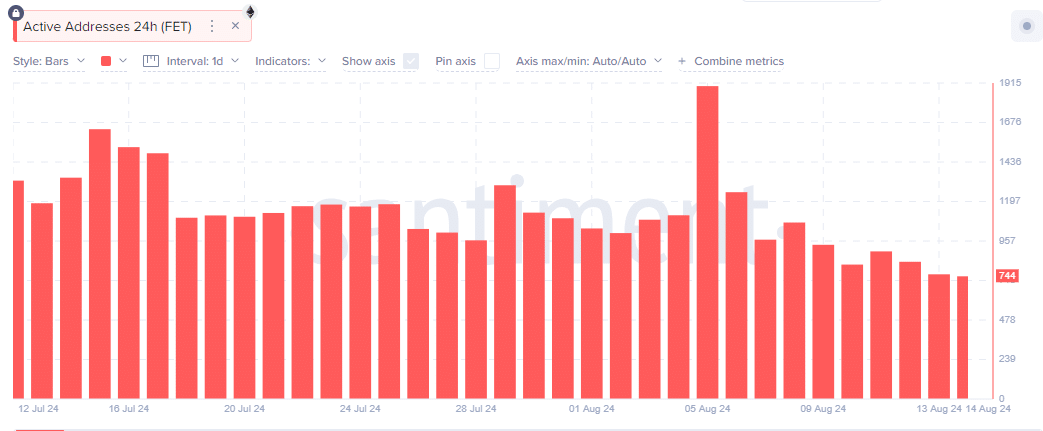
Source: Santiment
The fall in active participation often correlates with reduced interest from retail traders. This is thus likely to fuel a short-term depreciation in FET’s price.