
- LINK was bullish, but buyer exhaustion has set in
- LINK could break through support at $6.755 on a price correction
Chainlink [LINK] was one of the altcoins to rally mid-week after BTC regained the $16K level. Interestingly, LINK lost the $6.725 mark when BTC lost the $16.41K mark. Although both did witness some recovery later. In other news, LINK seems to be approaching its Chainlink Staking v0.1, set for 6 December.
At press time, LINK was trading at $6.902, up about 2% in the last 24 hours. However, a price-volume divergence could prevent a further uptrend. This meant that a price correction could be imminent.
If the bulls fail to prevail, LINK could break the current support at $6.755. New support at the 50% Fibonacci retracement level could be possible if the current support witnesses a breach.
Read Chainlink’s [LINK] price prediction 2023-2024
LINK is stuck inside the 78.6% and 61.8% Fibonacci pocket; can the bulls prevail?
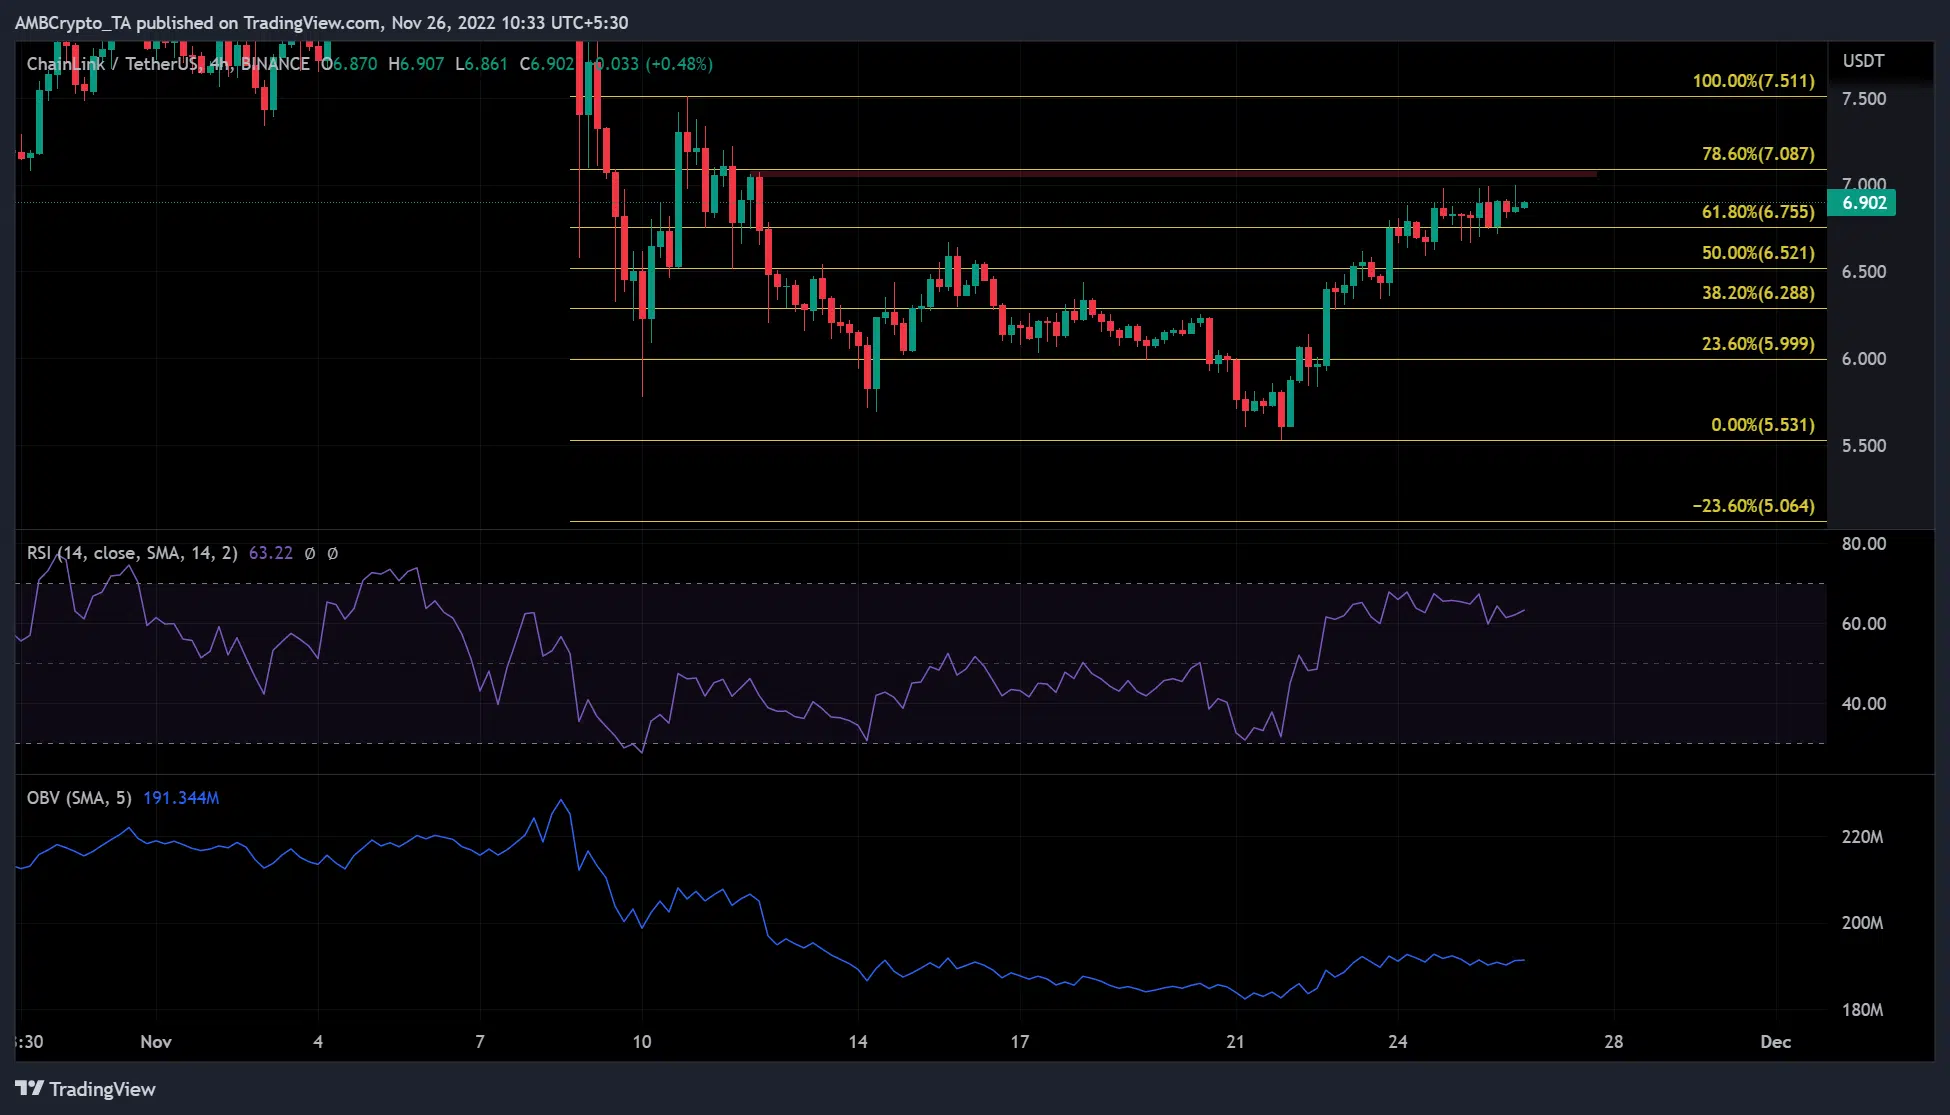
Source: TradingView
At press time, LINK was trading between $6.755 and $7.087, a key pocket between the 61.8% and 78.6% Fib levels. A bearish order block was to be seen, especially along the 78.6% Fib level. Can the bulls get their act together and move higher?
Technical indicators on the lower time frame (four-hour chart) disagree. The Relative Strength Index (RSI) moved sideways below the overbought entry line. It indicated the exhaustion of buyers, a weakness that could provide sellers with a favorable opportunity.
Furthermore, the On-Balance Volume (OBV) stood flat after a handful of higher highs. It indicated stagnation in volume after the recent rally and could undermine additional buying pressure. Therefore, these indicators support the inclination that the bulls of LINK might not succeed in breaking the bearish order blockage at the 78.6% Fibonacci retracement level ($7.087).
Thus, a weakening market structure could cause LINK to break the current support at $6.755 and fall toward $6.521.
A bearish order breaker with a session close above $7.087 would invalidate the above inclination.
Short-term LINK holders counting losses
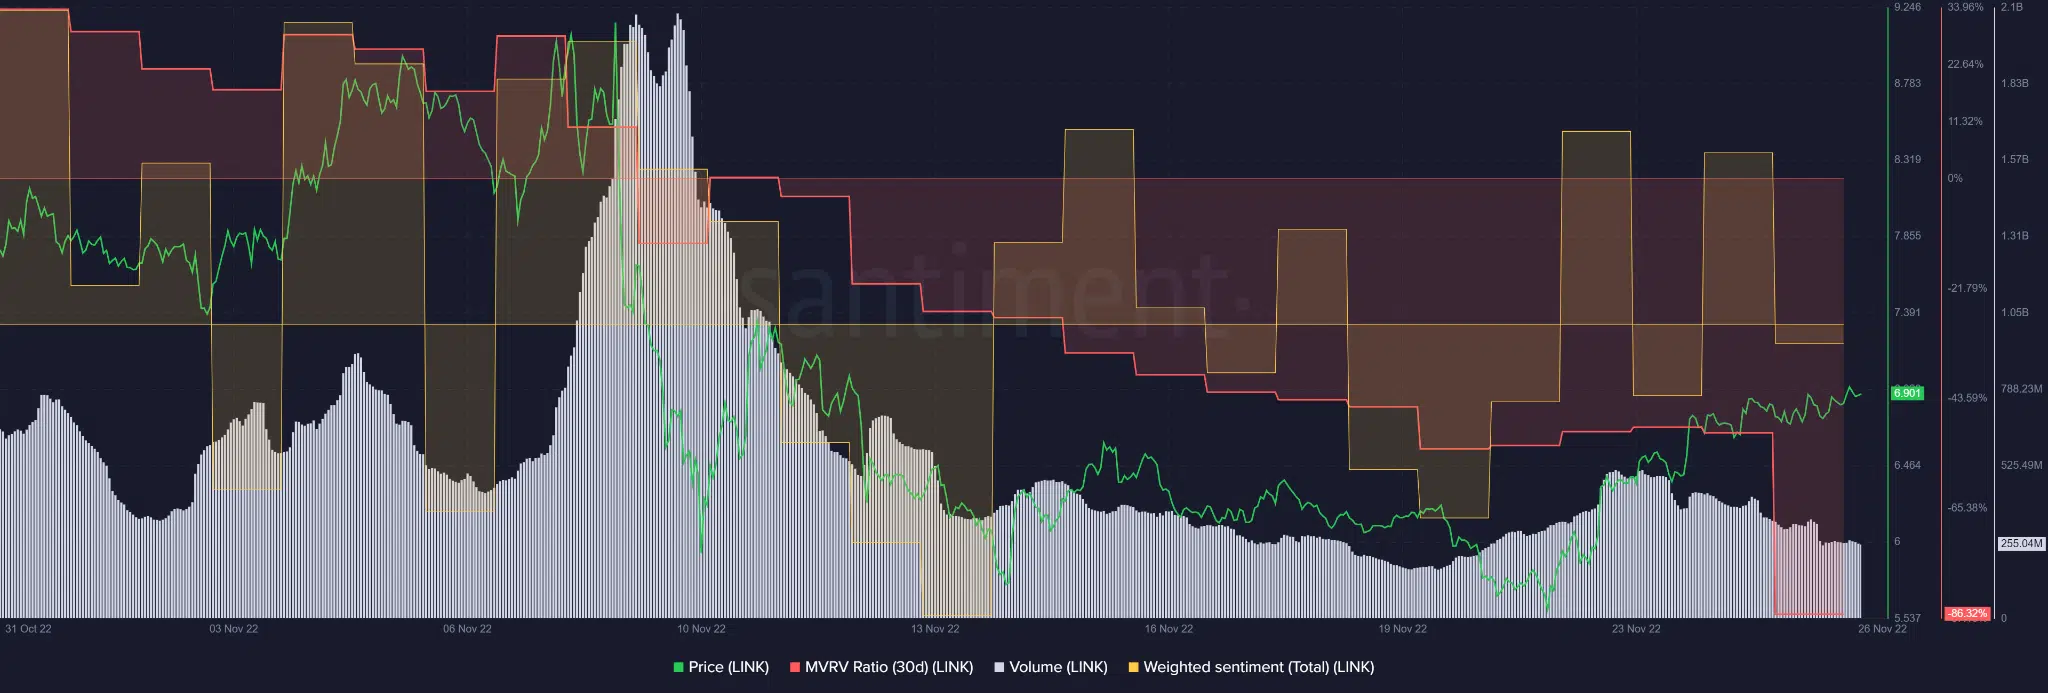
Source: Santiment
An analysis of Santiment data showed that short-term holders of LINK could be an unfortunate bunch. With the 30-day Market Value to Realized Value (MVRV) on the negative side, short-term holders have posted losses since 10 November.
A deeper nosedive into negative territory at the time of publication of the data indicated that these holders continue to face excessive losses. Interestingly, long-term LINK holders posted massive gains of over 700%.
Another interesting development was the negative sentiment at the time of writing. This could undermine the continued uptrend. The price-volume divergence further reinforced the above trend. Trading volumes have declined as prices have risen, possibly indicating an imminent price reversal.
However, BTC’s uptrend may also be driving LINK’s uptrend. Therefore, LINK investors should add BTC to their watch list.


![Why Chainlink [LINK] and Polygon [MATIC] are more similar than you realise](https://ambcrypto.com/wp-content/uploads/2024/04/Chainlink_and_Polygon-1-400x240.webp)