Analysis
Ripple weakens – When will bulls see reprieve?
XRP’s extended pullback could ease at a key demand zone if BTC doesn’t crack below $27k.

Disclaimer: The information presented does not constitute financial, investment, trading, or other types of advice and is solely the writer’s opinion.
- XRP reversed its gains from the second leg of recovery.
- The long-term price trend flipped negative.
Ripple [XRP] sellers gained more market leverage at the end of September. Sellers pushed XRP below $0.513 from $0.548. The drop saw sellers accrue over 6% of shorting gains based on the press time value of $0.507.
Is your portfolio green? Check out the
XRP Profit CalculatorMeanwhile, Bitcoin [BTC] faltered at the range-high of $28.3k, further emboldening XRP sellers.
The focus now shifts to whether BTC can defend the mid-range near $27.1k to confirm whether a rebound or pullback extension is likely.
What’s XRP’s possible short-term price projection?
In a previous XRP price analysis, AMBCrypto projected that the daily bearish order block (OB) at $0.54 could derail bullish efforts. The prediction was validated, tipping sellers to gain more edge on the lower timeframe.
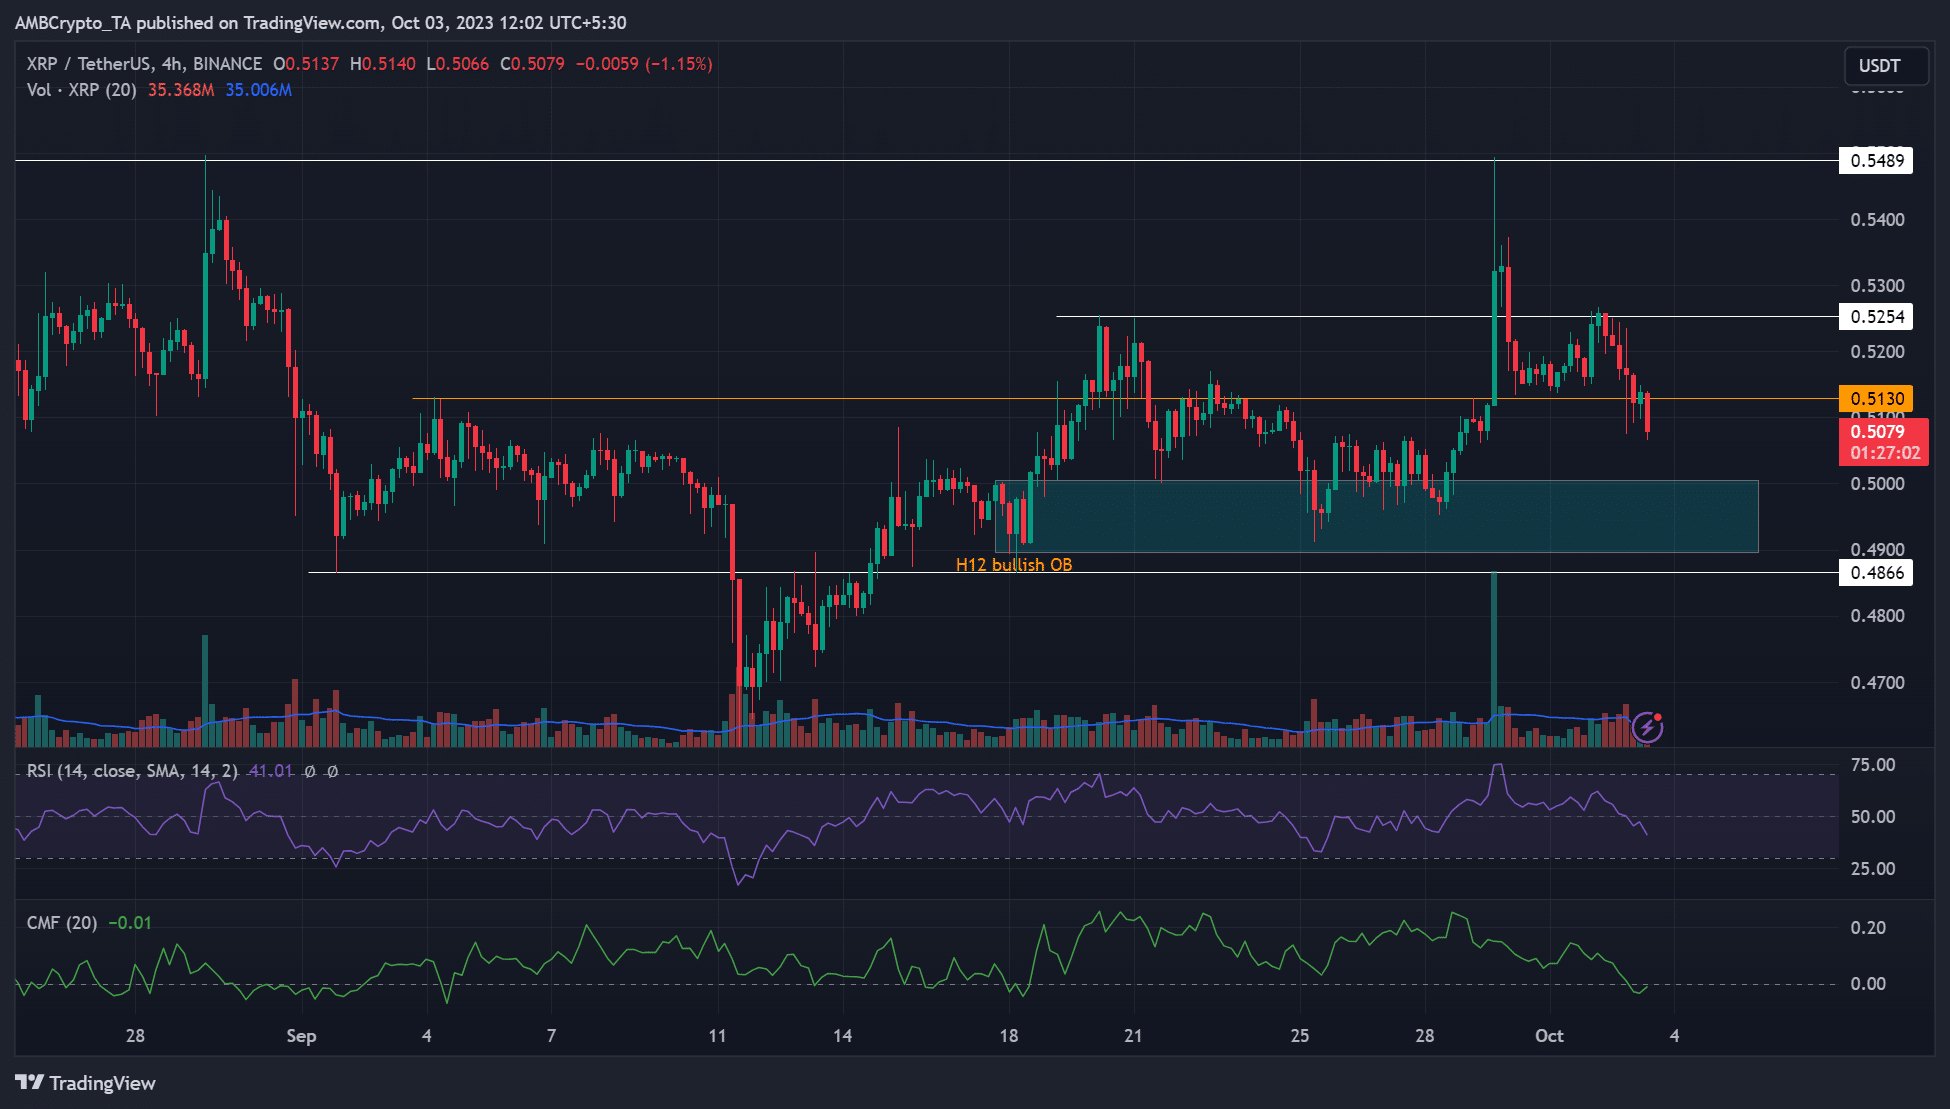
In the 4-hour timeframe, the extended pullback breached the $0.5130 level. The move could encourage sellers to extend gains to the H12 bullish OB of $0.489 – $0.500 (cyan).
So, if XRP fails to reclaim $0.513, near-term bulls could mark the bullish OB of $0.489 – $0.500 (cyan) as the key interest level. The next target levels to watch are $0.513 and $0.525 in the short term if the pullback extends to the bullish OB.
Meanwhile, the RSI retreated below the 50 mark, underscoring the extended selling pressure witnessed in the past few days.
Similarly, the CMF retreated southwards and cracked the zero threshold, denoting substantial capital outflows over the same period.
XRP’s long-term price trend flipped negative
The extended price drop weakened the XRP market further, flipping the long-term price trend to a negative, as shown by the Accumulative Swing Index (ASI). ASI tracks the strength of price swings, and the negative value meant that long-term price action was in a downtrend as of press time.
How much are 1,10,100 XRPs worth today?
However, the fluctuating CVD (Cumulative Volume Delta) in the past few days showed neither sellers nor buyers had market leverage.
In addition, with the muted demand shown by the eased Open Interest rates, traders can track BTC movement for risk mitigation.


