- The breakdown from the up channel and failure to sustain the above key EMAs suggested that the bears are currently in control.
- Traders should watch for a close above the 20-day and 50-day EMAs to confirm a potential bullish reversal.
RUNE saw a substantial recovery after rebounding from the $2.9 support level. However, this recovery was short-lived as the price failed to sustain above the 20-day and 50-day Exponential Moving Averages (EMAs).
This failure has led to a breakdown from the recent up-channel, causing a series of red candles that pulled the price below the $3.89 resistance.
At the time of writing, RUNE traded at approximately $3.86, slightly up by around 1.4% in the last 24 hours. The price action suggested that the altcoin is struggling to maintain its momentum, with the 20-day EMA ($3.96) and 50-day EMA ($4.01) acting as significant resistance levels.
Thorchain bulls provoked a break above trendline resistance
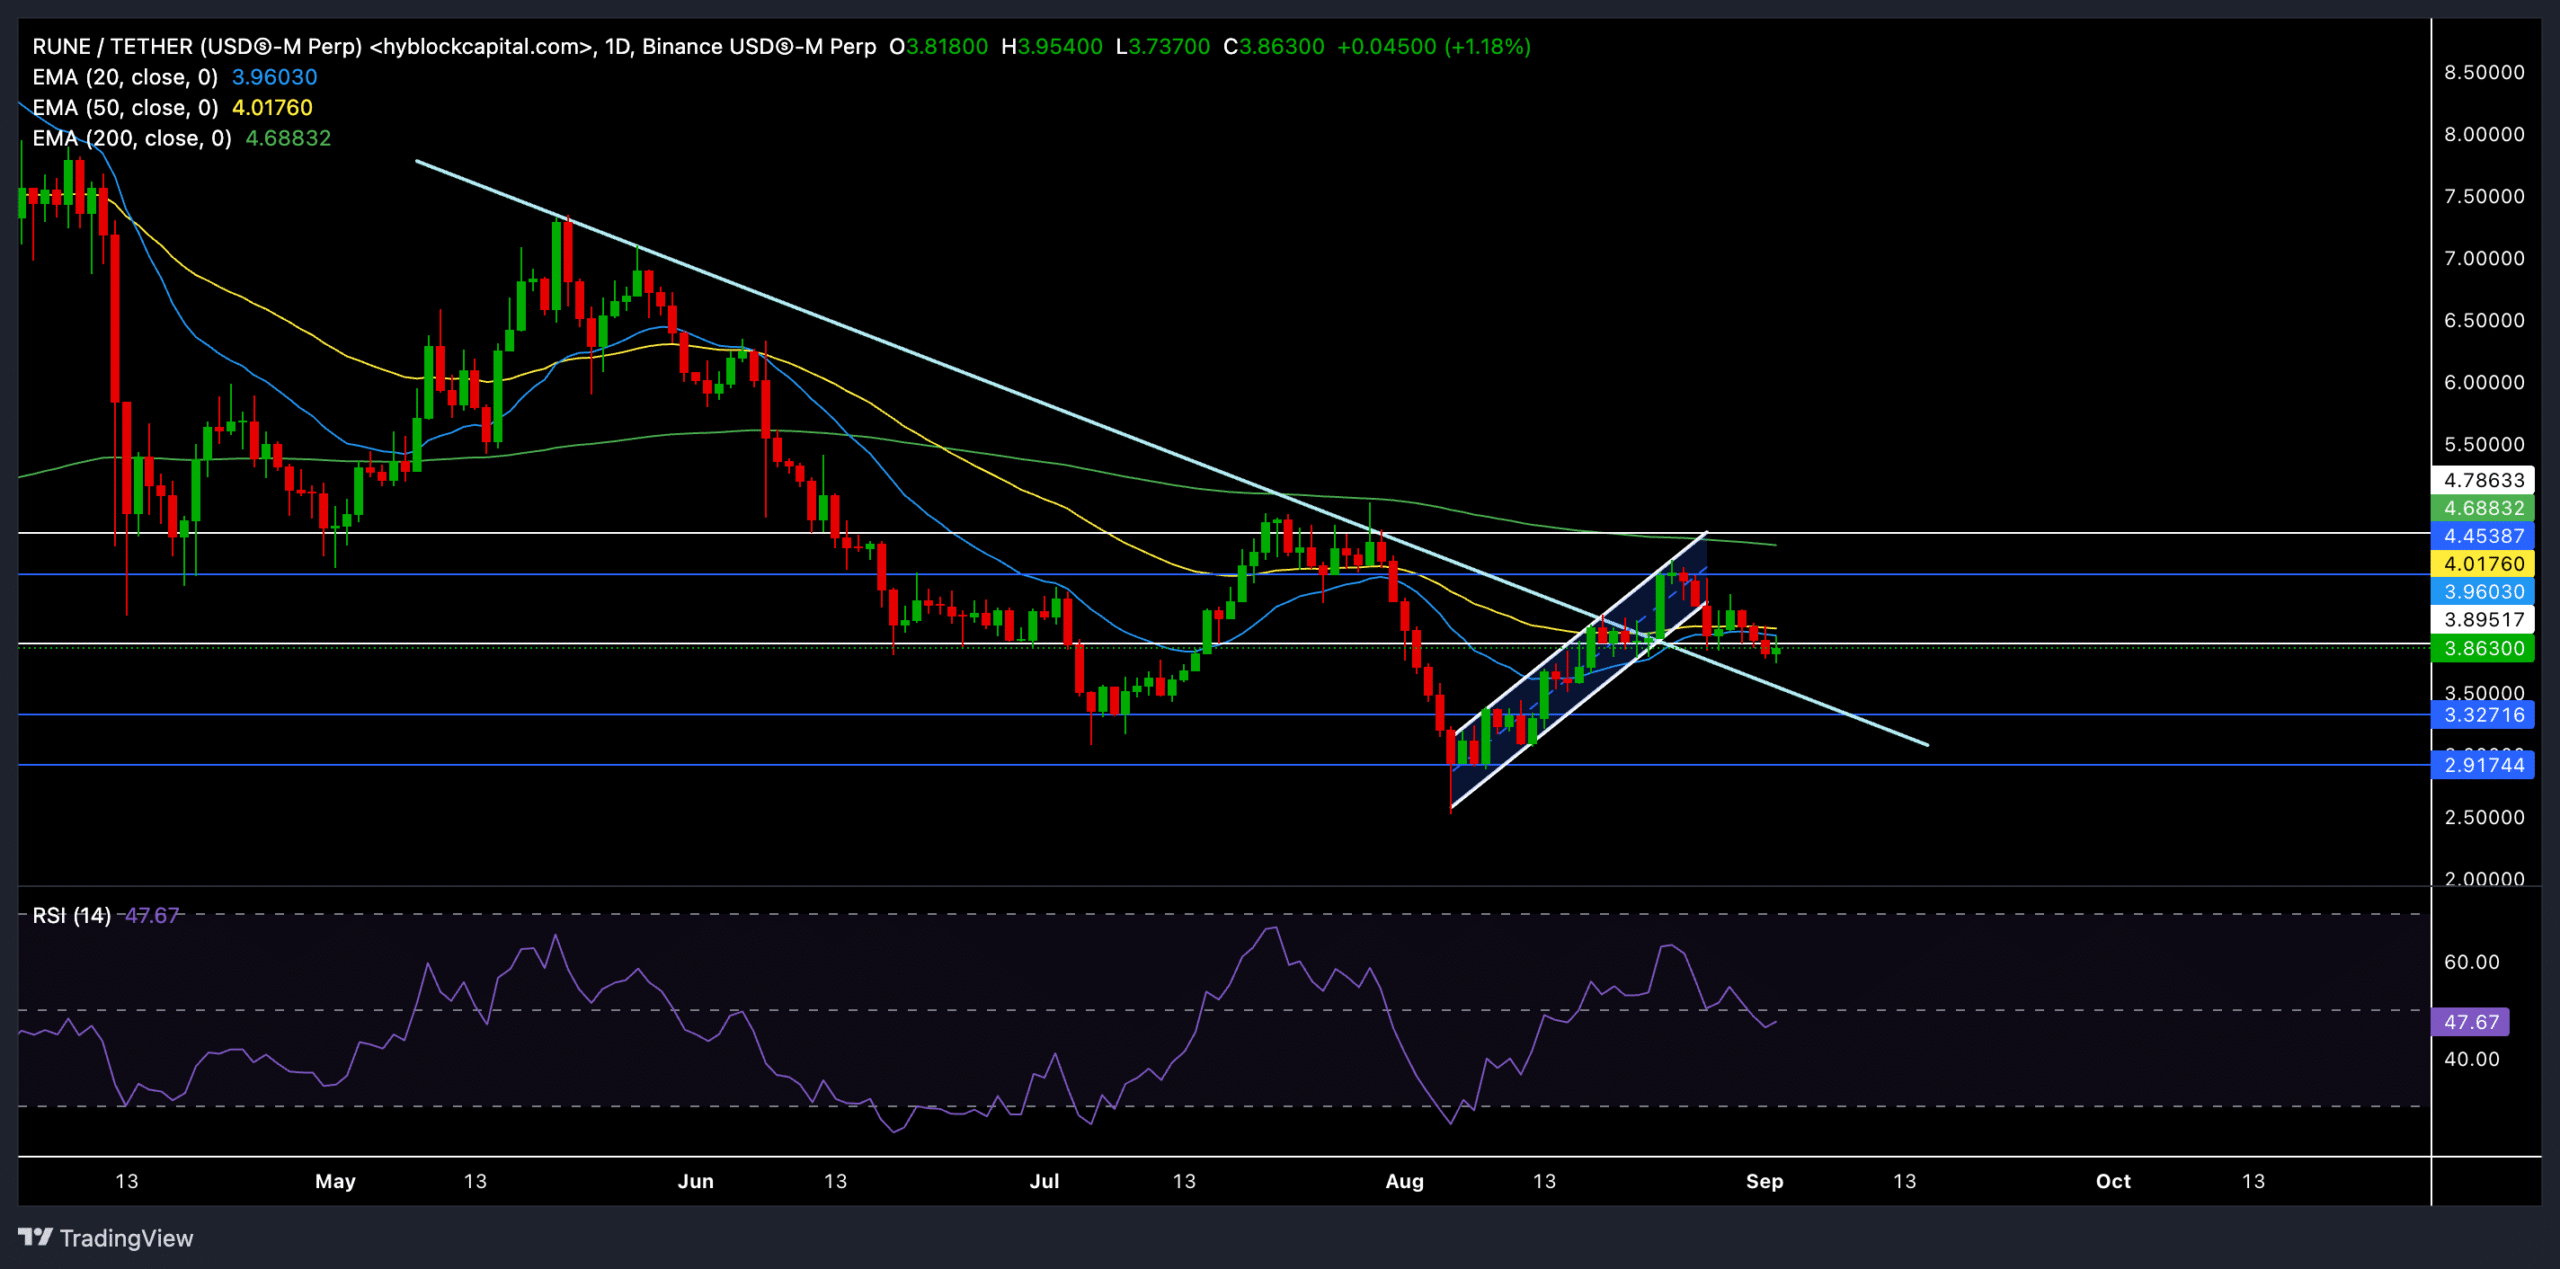
Source: TradingView, RUNE/USDT
The daily chart revealed RUNE had flipped its long-term trendline resistance into support. If the price manages to close above the 20-day and 50-day EMAs, this could potentially act as a strong foundation for a bullish reversal.
However, the recent breakdown from the up channel raises concerns about more downside risks.
The key levels to watch are resistance at $4.01 (50-day EMA) and $4.68 (200-day EMA) and support levels at $3.50 and $3.32.
Failure to hold the $3.5 support level could lead to a rather extended downtrend. In this case, the sellers would look to retest the lower support zones around $3.32 and $2.91.
On the other hand, a successful close above the 50-day EMA could pave the way for a retest of the $4.68 level and potentially higher if bullish momentum picks up.
The Relative Strength Index (RSI) currently hovered around 47.67, indicating a neutral sentiment in the market. However, the RSI was on a downtrend and suggested that the bearish momentum might continue unless there is a strong reversal.
Derivates data revealed THIS

Source: Coinglass
In the derivatives market, the long/short ratio on Binance is 0.5992, indicating more short positions than long ones. This further supports the bearish sentiment.
Realistic or not, here’s THOR’s market cap in BTC’s terms
However, it’s worth noting that the open interest was relatively unchanged (+0.26%), suggesting that traders were cautious and waiting for a clear direction.
As always, it is crucial to monitor Bitcoin’s movement and the overall market sentiment, as this will likely influence RUNE’s price action.