
In its constant endeavor to break the constraints of its 4-hour 50 EMA, Bitcoin has been on a bumpy ride whilst failing to improve the broader sentiment.
As a result, RUNE, Axie Infinity, and The Graph continued to show sluggish tendencies while struggling to sustainably uplift the bull momentum. After plunging towards their multi-month lows on 1 May, these altcoins have found their grounds, but what lies ahead of us?
RUNE
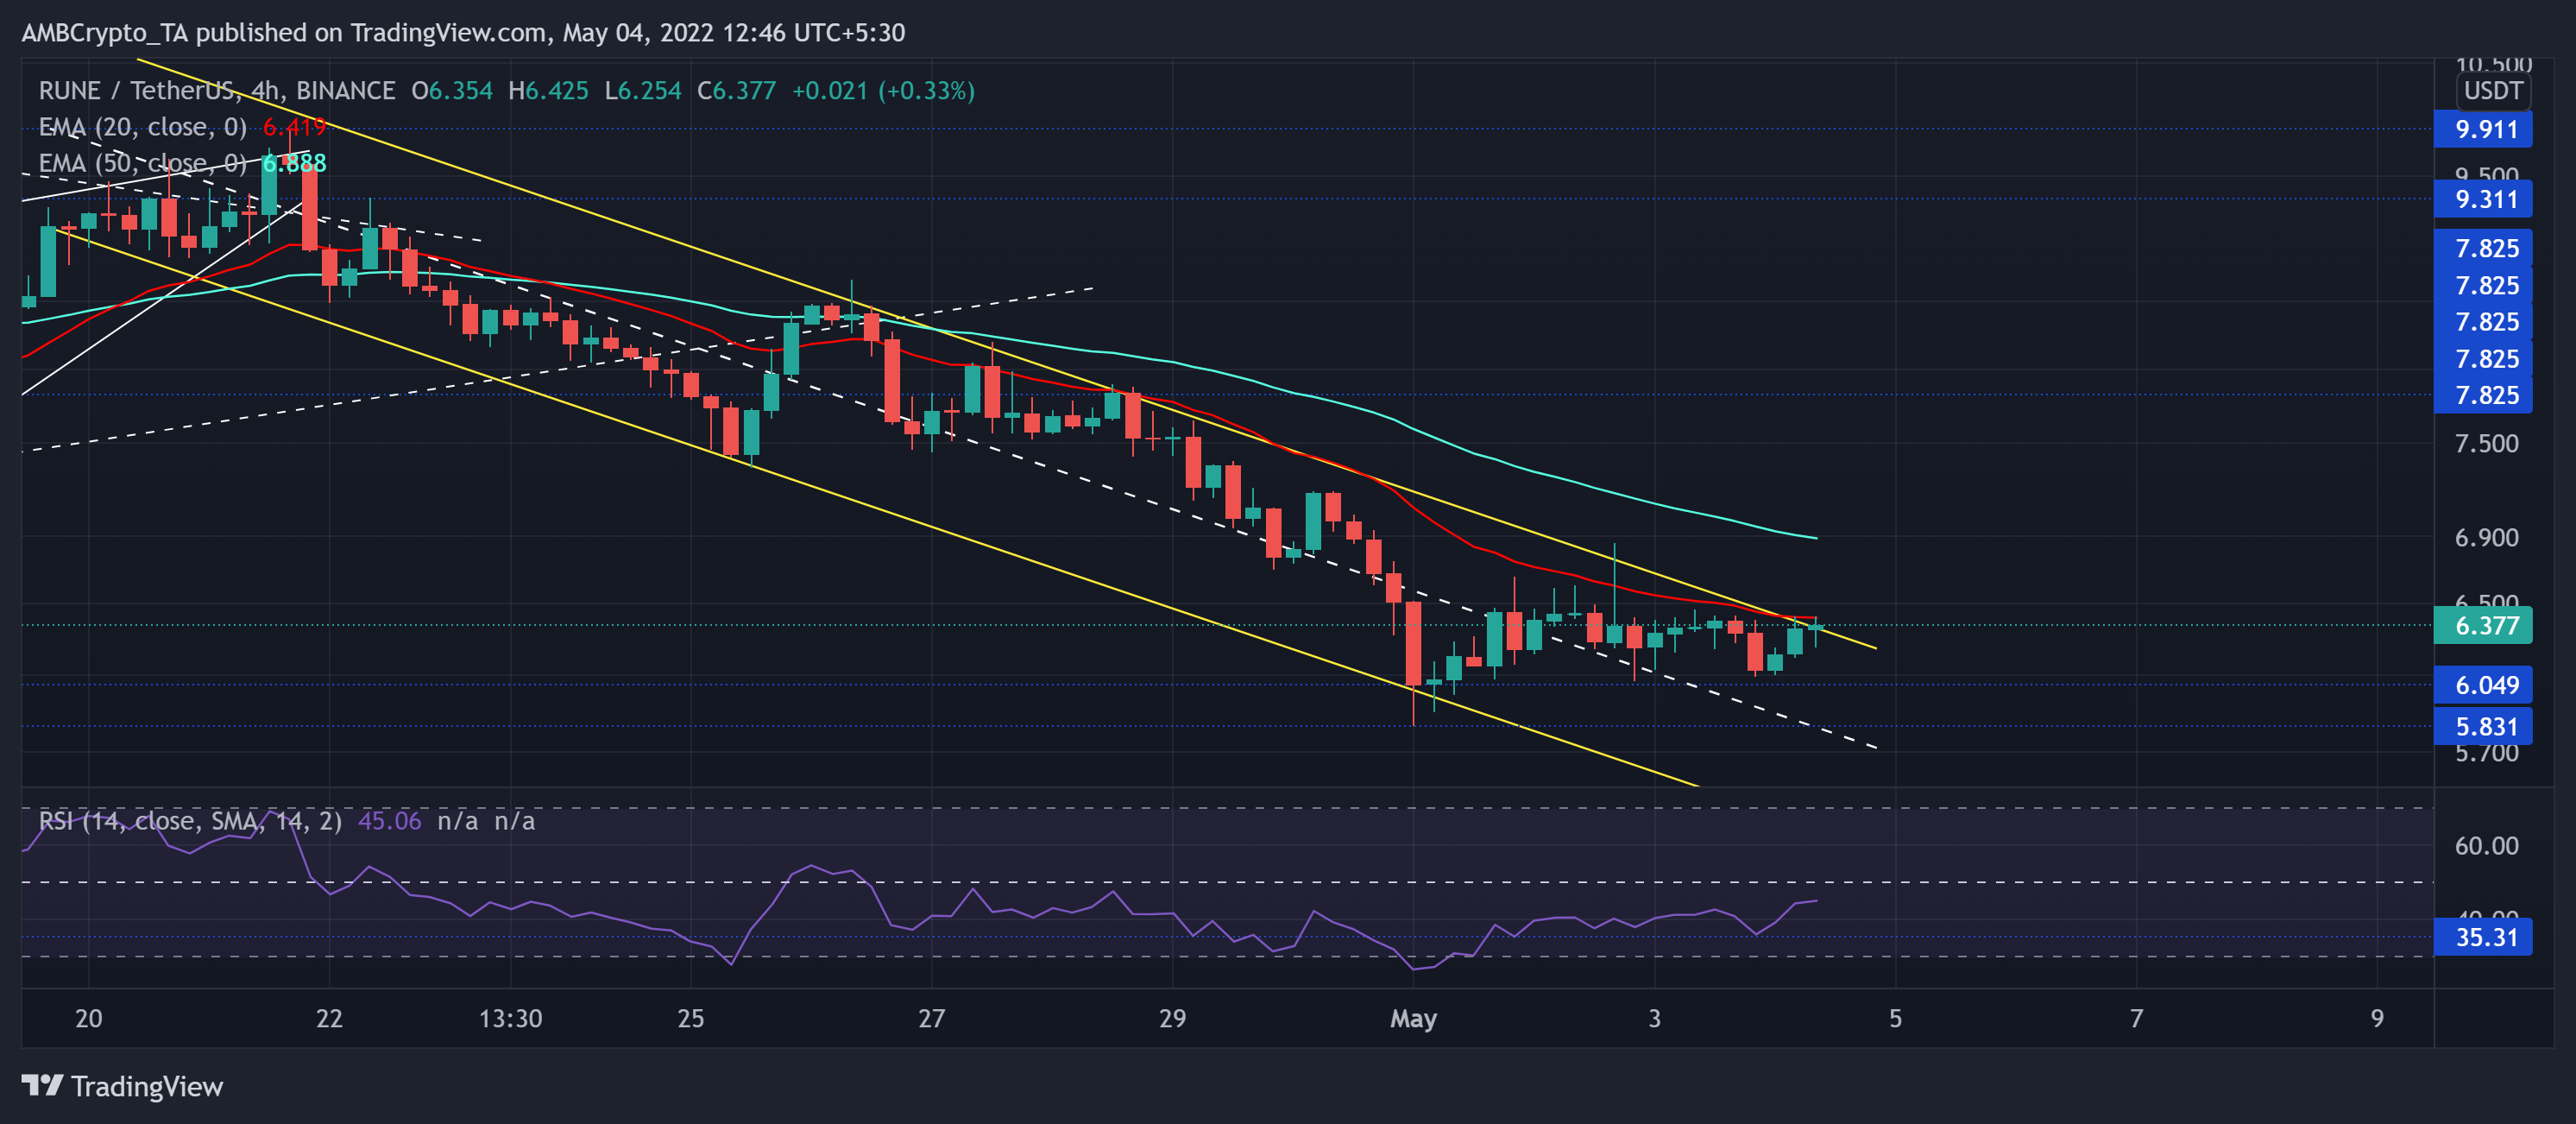
Source: TradingView, RUNE/USDT
RUNE rebounded on its northward track after rising from its late February lows. The trendline resistance (previous support) (white, dashed) supported the alt’s growth but struggled to hold its grounds after the recent down-channel (yellow) devaluation.
As the profit-taking phase initiated, RUNE’s plummet marked an over 41% retracement toward its seven-week low on 1 May. While the 20 EMA (red) continued to reject recent rallies, a close above the current pattern could open doorways for a 50 EMA retest.
At press time, RUNE traded at $6.377. The RSI‘s lift from the 35-level set a strong foundation for challenging its midline. Unless the buyers gather more force to push for higher prices, toppling the equilibrium would continue to be an onerous task.
Axie Infinity (AXS)
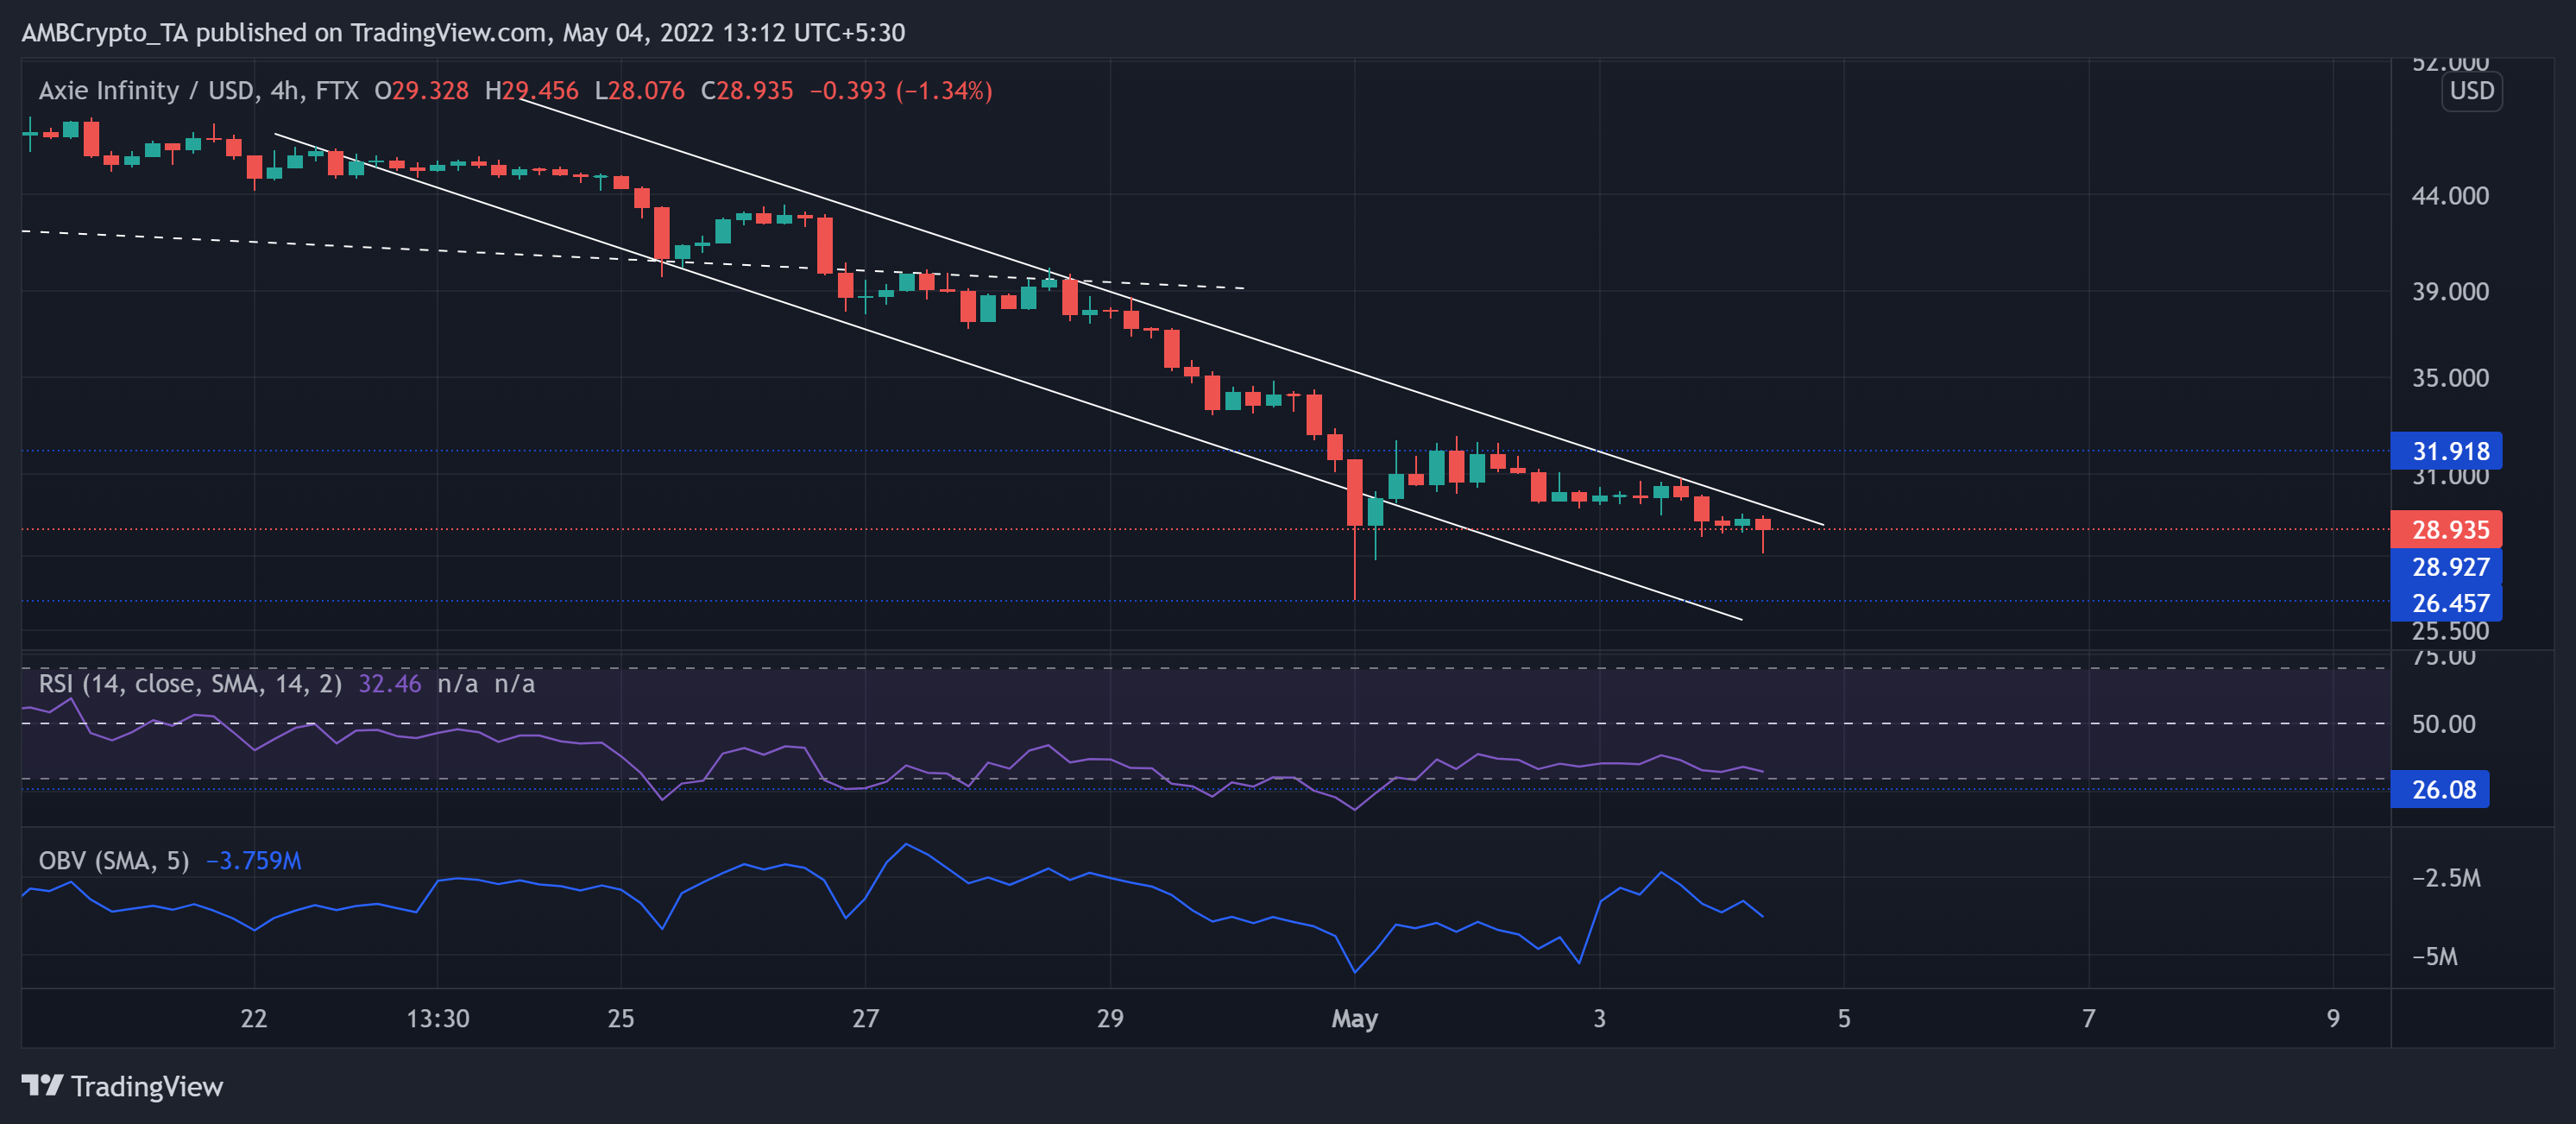
Source: TradingView, AXS/USD
Since its ATH last year, AXS has formed consistent lower highs and troughs. A falling wedge and multiple descending channels mapped out this course in the 4-hour timeframe. The recent 64.95% drop (from 2 April) pulled AXS all the way until $26.495 on 18 April.
In their efforts to double-down on the sell-off, the sellers managed to flip the three-month trendline support to resistance (white, dashed). The $28.9-mark floor would now be vital to hold on to and prevent an extended fall.
At press time, AXS traded at $28.935. The RSI’s reading echoed the one-sided selling dominance. The 26-30 RSI support range could propel a short-term revival in the coming times. Furthermore, the OBV saw higher peaks while affirming a bullish divergence with the price.
The Graph (GRT)
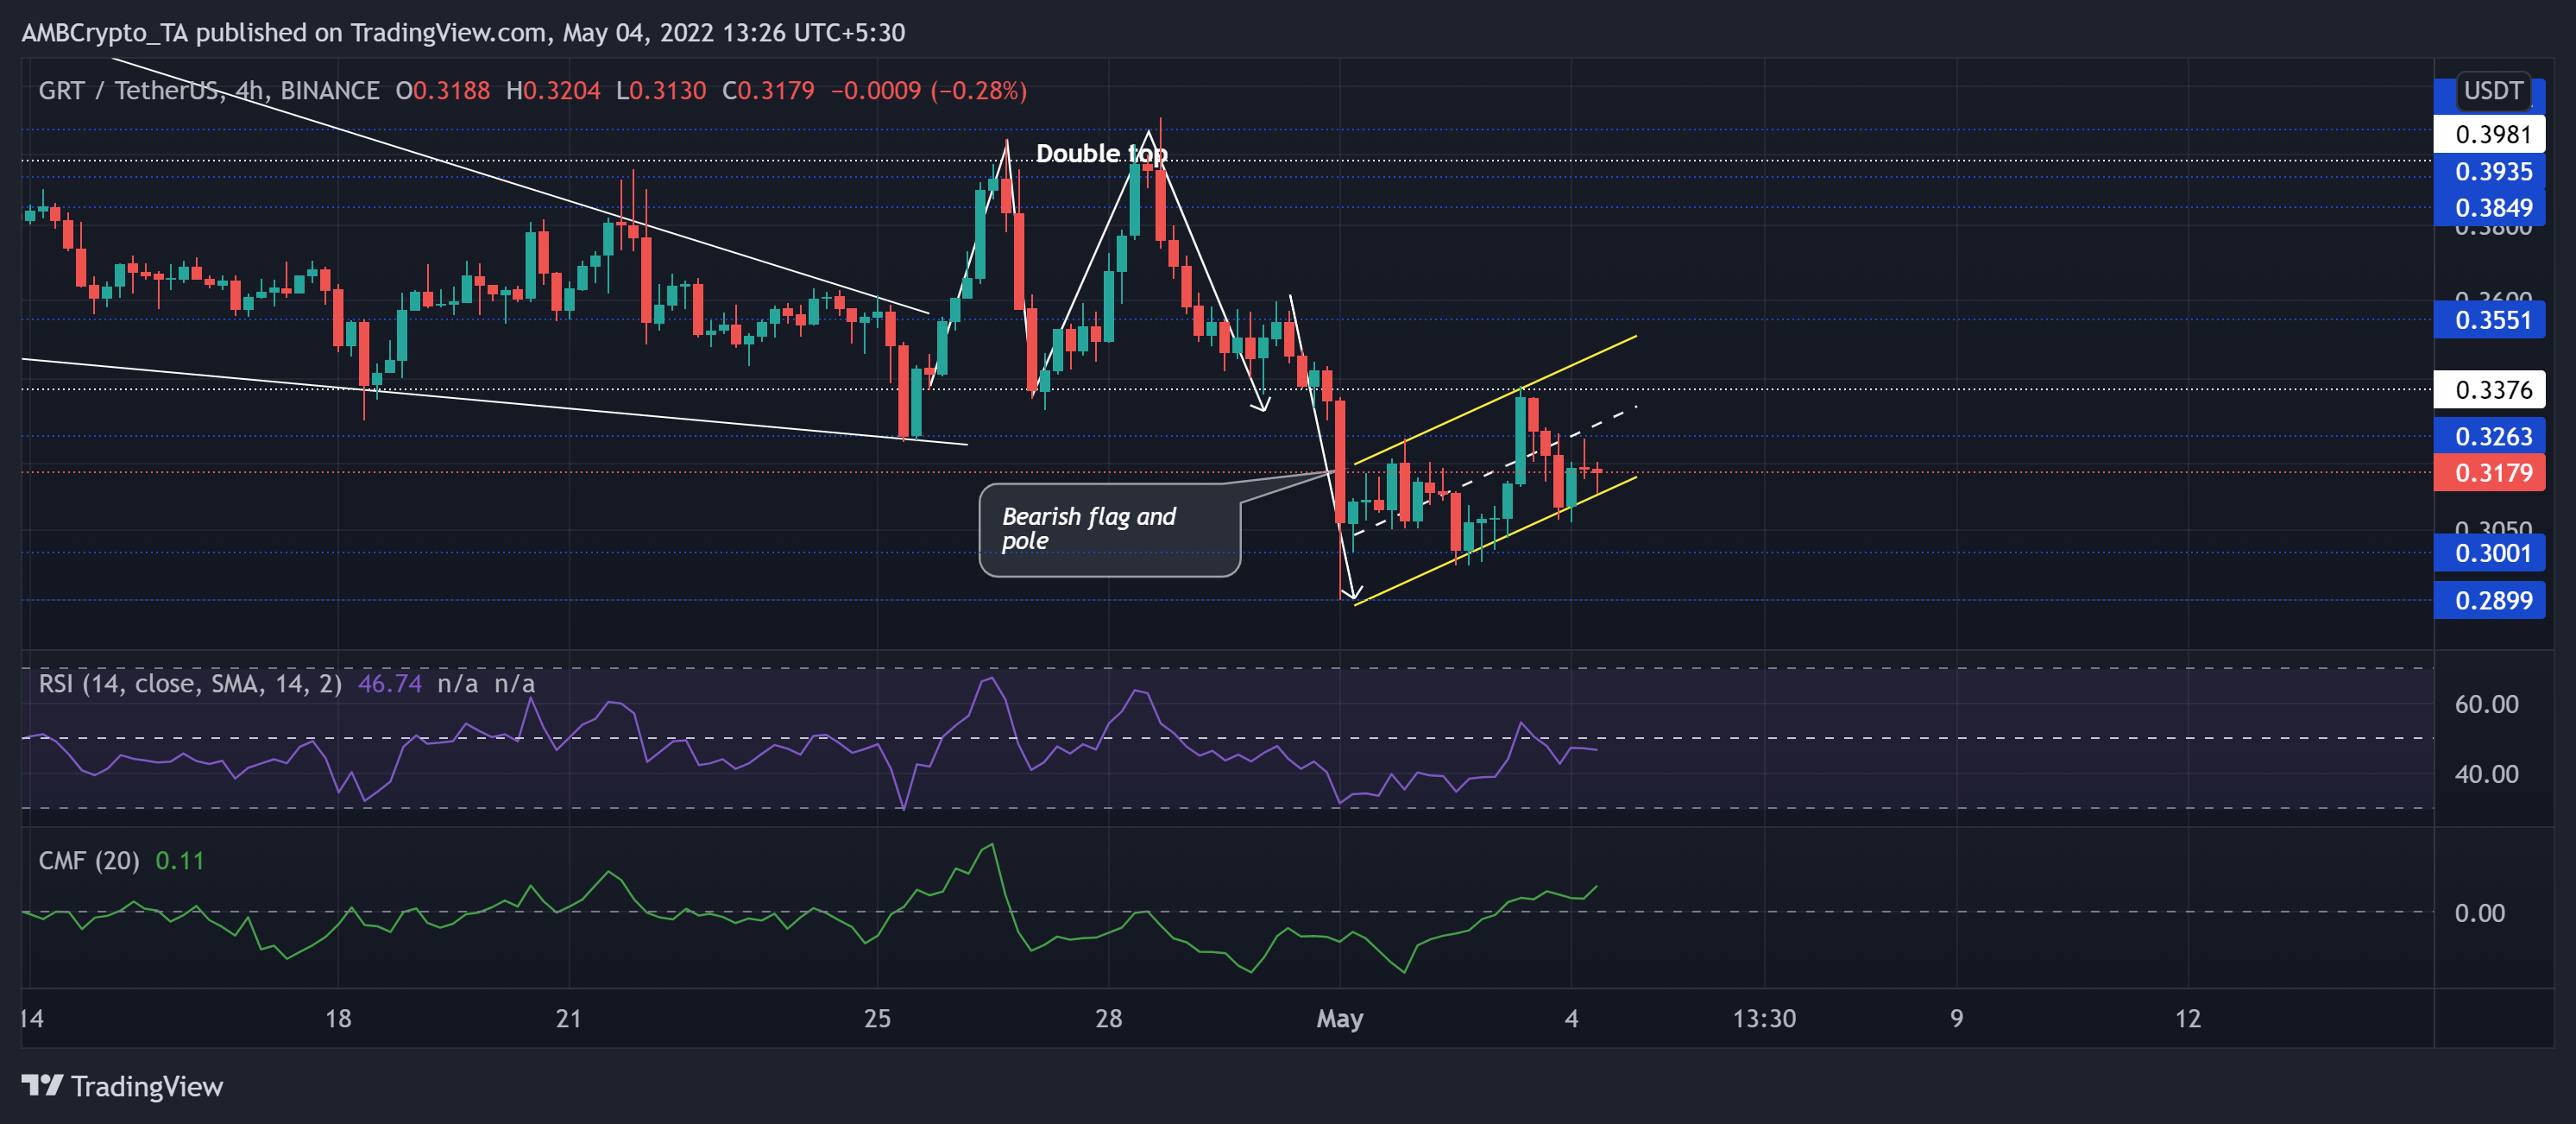
Source: TradingView, GRT/USDT
After lowering from the $0.5 resistance, GRT witnessed multiple drawdowns on its chart. The recent bloodbath plunged GRT below the $0.39 mark while forming a double top with a $0.33 neckline. This selling spree discounted the altcoin by 47.11% and brought it to the $0.29 baseline.
Meanwhile, the bulls responded by propelling an up-channel recovery from its 15-month-low on 1 May. Thus, forming a bearish flag and pole in the 4-hour timeframe.
At press time, GRT was trading at $0.3179, down by 1.6% in the last 24 hours. The RSI continued to illustrate a slight selling edge while struggling to conquer the 50-mark. Nevertheless, the CMF managed to find a spot above the zero-line while favoring the buyers.


![Why Chainlink [LINK] and Polygon [MATIC] are more similar than you realise](https://ambcrypto.com/wp-content/uploads/2024/04/Chainlink_and_Polygon-1-400x240.webp)

