RUNE trades at a key level but here’s why a move to $3 may occur
The Open Interest (OI) began to climb again on the one-hour chart as RUNE prices also ascended. This was a sign of bullish conviction in the futures market.

Disclaimer: The information presented does not constitute financial, investment, trading, or other types of advice and is solely the writer’s opinion.
- RUNE was in an intense uptrend and things might not slow down much in the coming weeks
- A retracement to $2.3 could be ideal but bullish strength might not allow it
THORChain [RUNE] gained just over 81% in price within the past ten days. Trade volume has grown in recent days, and technical analysis showed that the next significant resistance region was at $3.
How much are 1, 10, or 100 THOR worth today?
The latest surge was just one move in the uptrend that RUNE has surfed since early August. The strong gains came alongside Bitcoin [BTC] although not in lockstep like other altcoins.
The retest of the $1 zone in August supercharged the long-term bulls
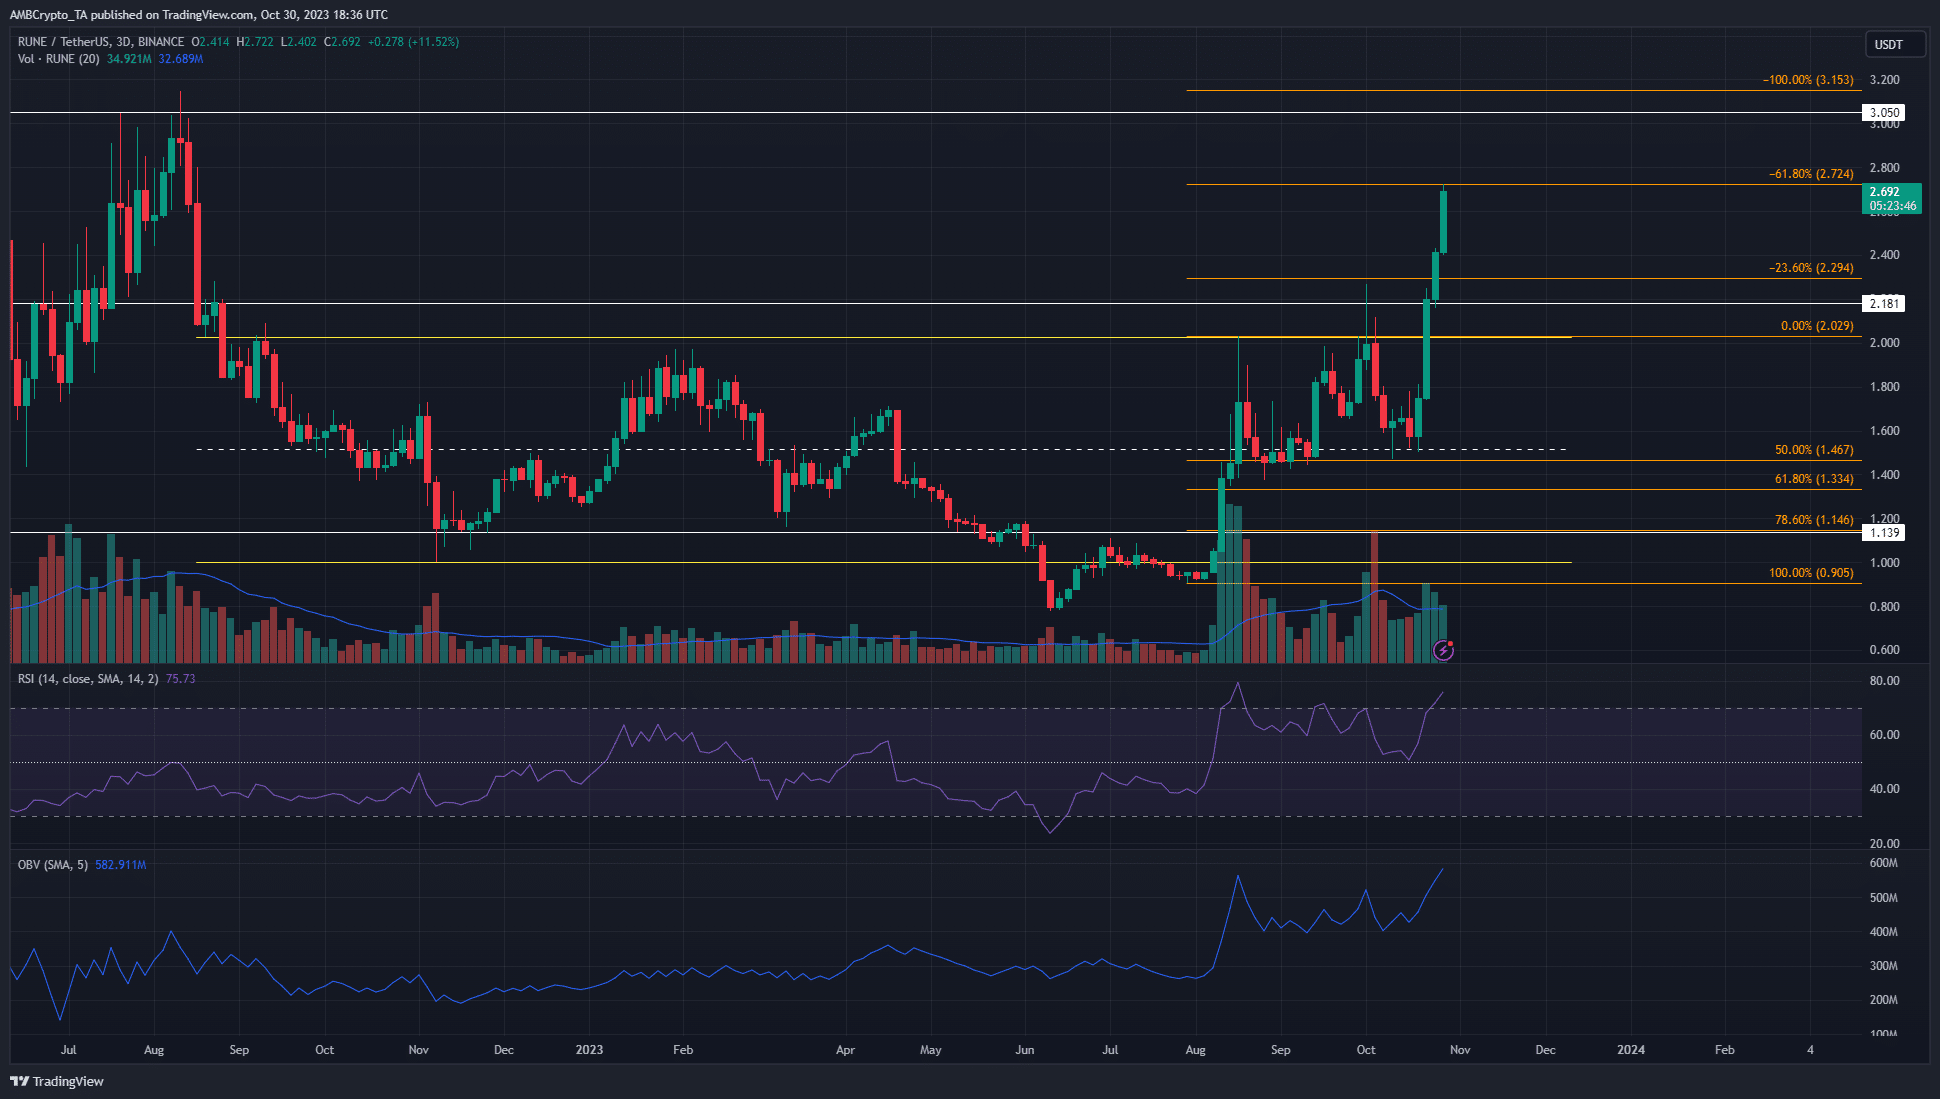
Since 8 November 2022, RUNE has traded within a range that extended from $1 to $2. From late April to mid-June RUNE was in a downtrend even on the daily timeframe and dropped below $1 to reach $0.782.
Late in June and again in early August the same $1 level was retested as support. This also saw a bullish structure break on the D3 chart. The buying volume since then has been phenomenal and was reflected in the On-Balance Volume (OBV). This indicator continued to rise.
The Relative Strength Index (RSI) on the three-day chart was also above 70 to signal strong bullish momentum on the higher timeframe chart. The Fibonacci levels showed $2.72 and $3.15 were the next resistance levels to watch out for. Traders might not be justified in taking short positions on RUNE yet unless they’re based on the hourly or lower timeframes.
The steady spot CVD trend was another factor in favor of the bulls
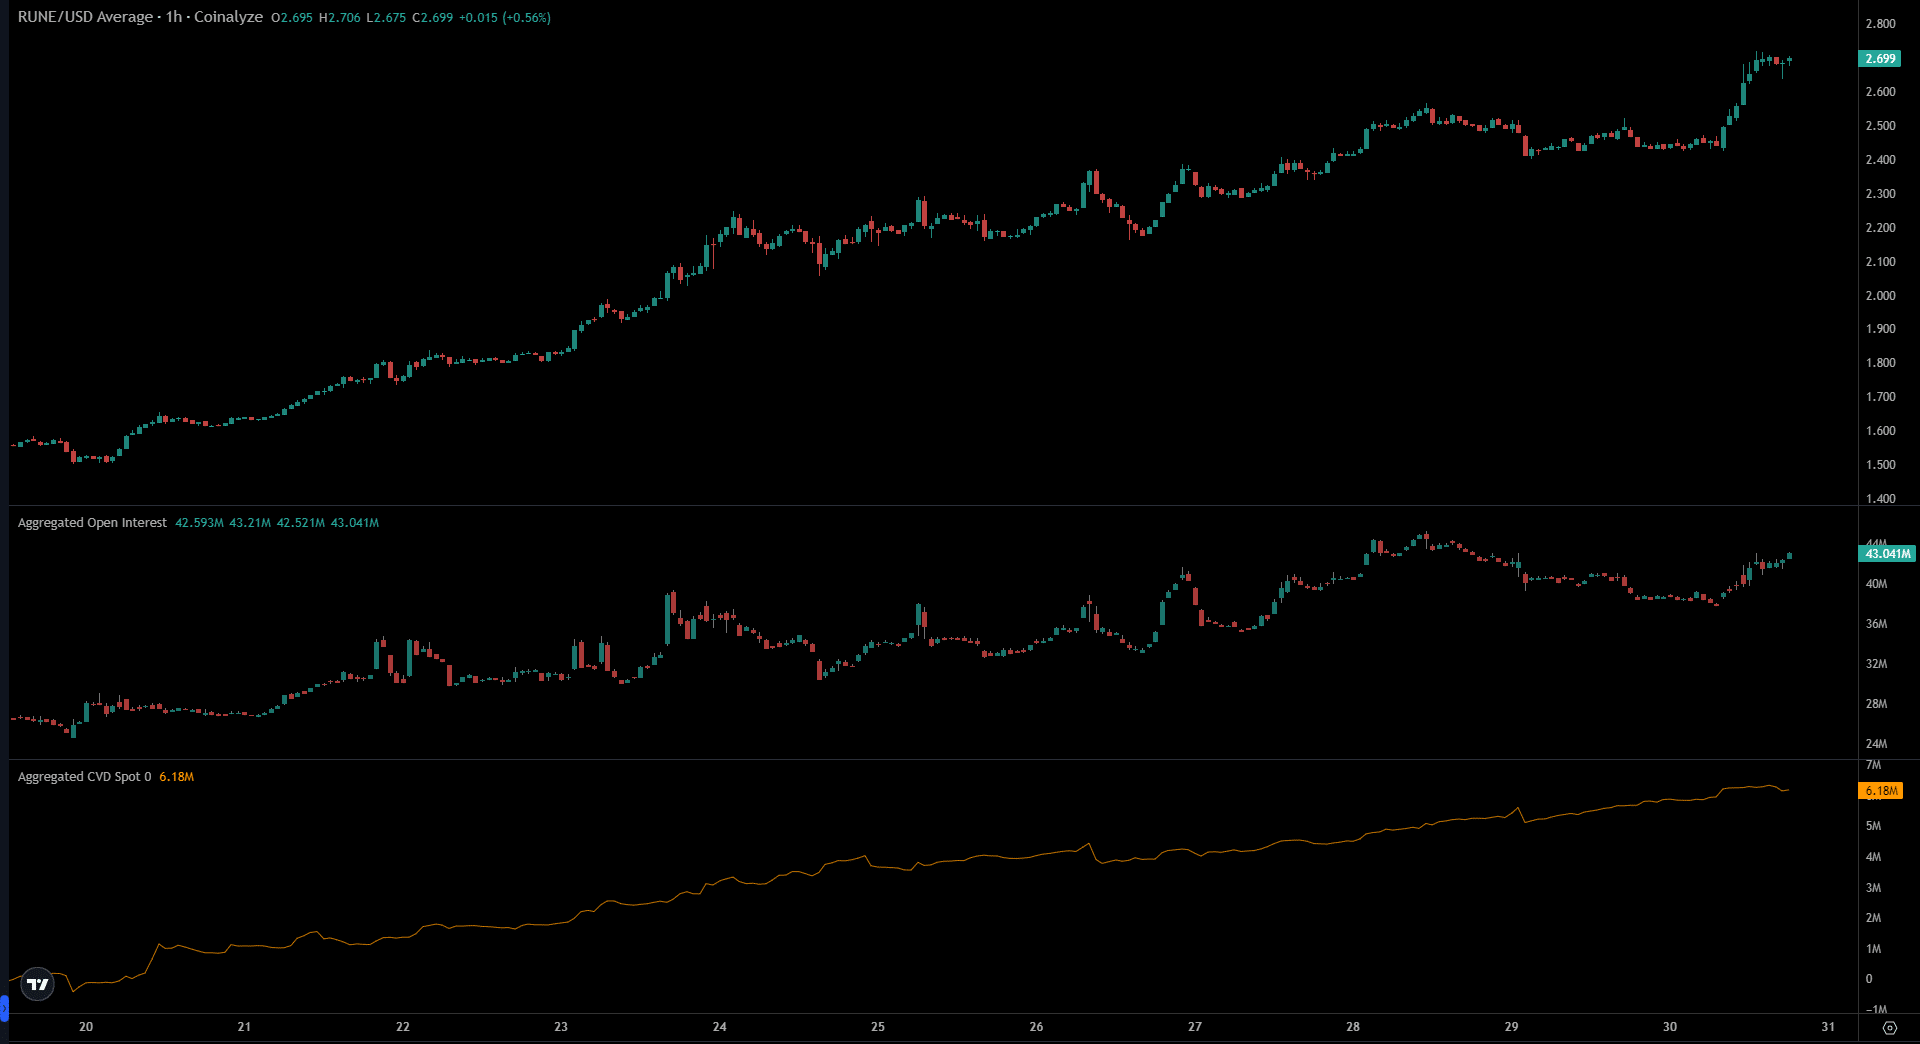
The Open Interest (OI) began to climb again on the one-hour chart as RUNE prices also ascended. This was a sign of bullish conviction in the futures market. The spot Cumulative Volume Delta (CVD) was also in a steady uptrend and highlighted the demand behind RUNE.
Realistic or not, here’s THOR’s market cap in BTC’s terms
Above $3, the $3.8 and $5 levels were the next significant resistance levels. In particular, the $3.7-$4.2 stretch, which saw consolidation in January and February 2022, could offer trading opportunities.