
Disclaimer: The findings of the following analysis are the sole opinions of the writer and should not be considered investment advice.
Bitcoin [BTC] paddled hard to stay above the $19.8k mark over the previous day. The efforts of the bulls were rewarded in recent hours as BTC saw a small surge past the $21k level.
Resistance lies at $23.3k next, and a Bitcoin move higher could usher in near-term gains for the altcoin market. The Sandbox had some strength in recent hours as the price climbed past the $0.89 mark. Yet, a zone of tough resistance was ahead for SAND at $0.97.
SAND- 1 Hour Chart
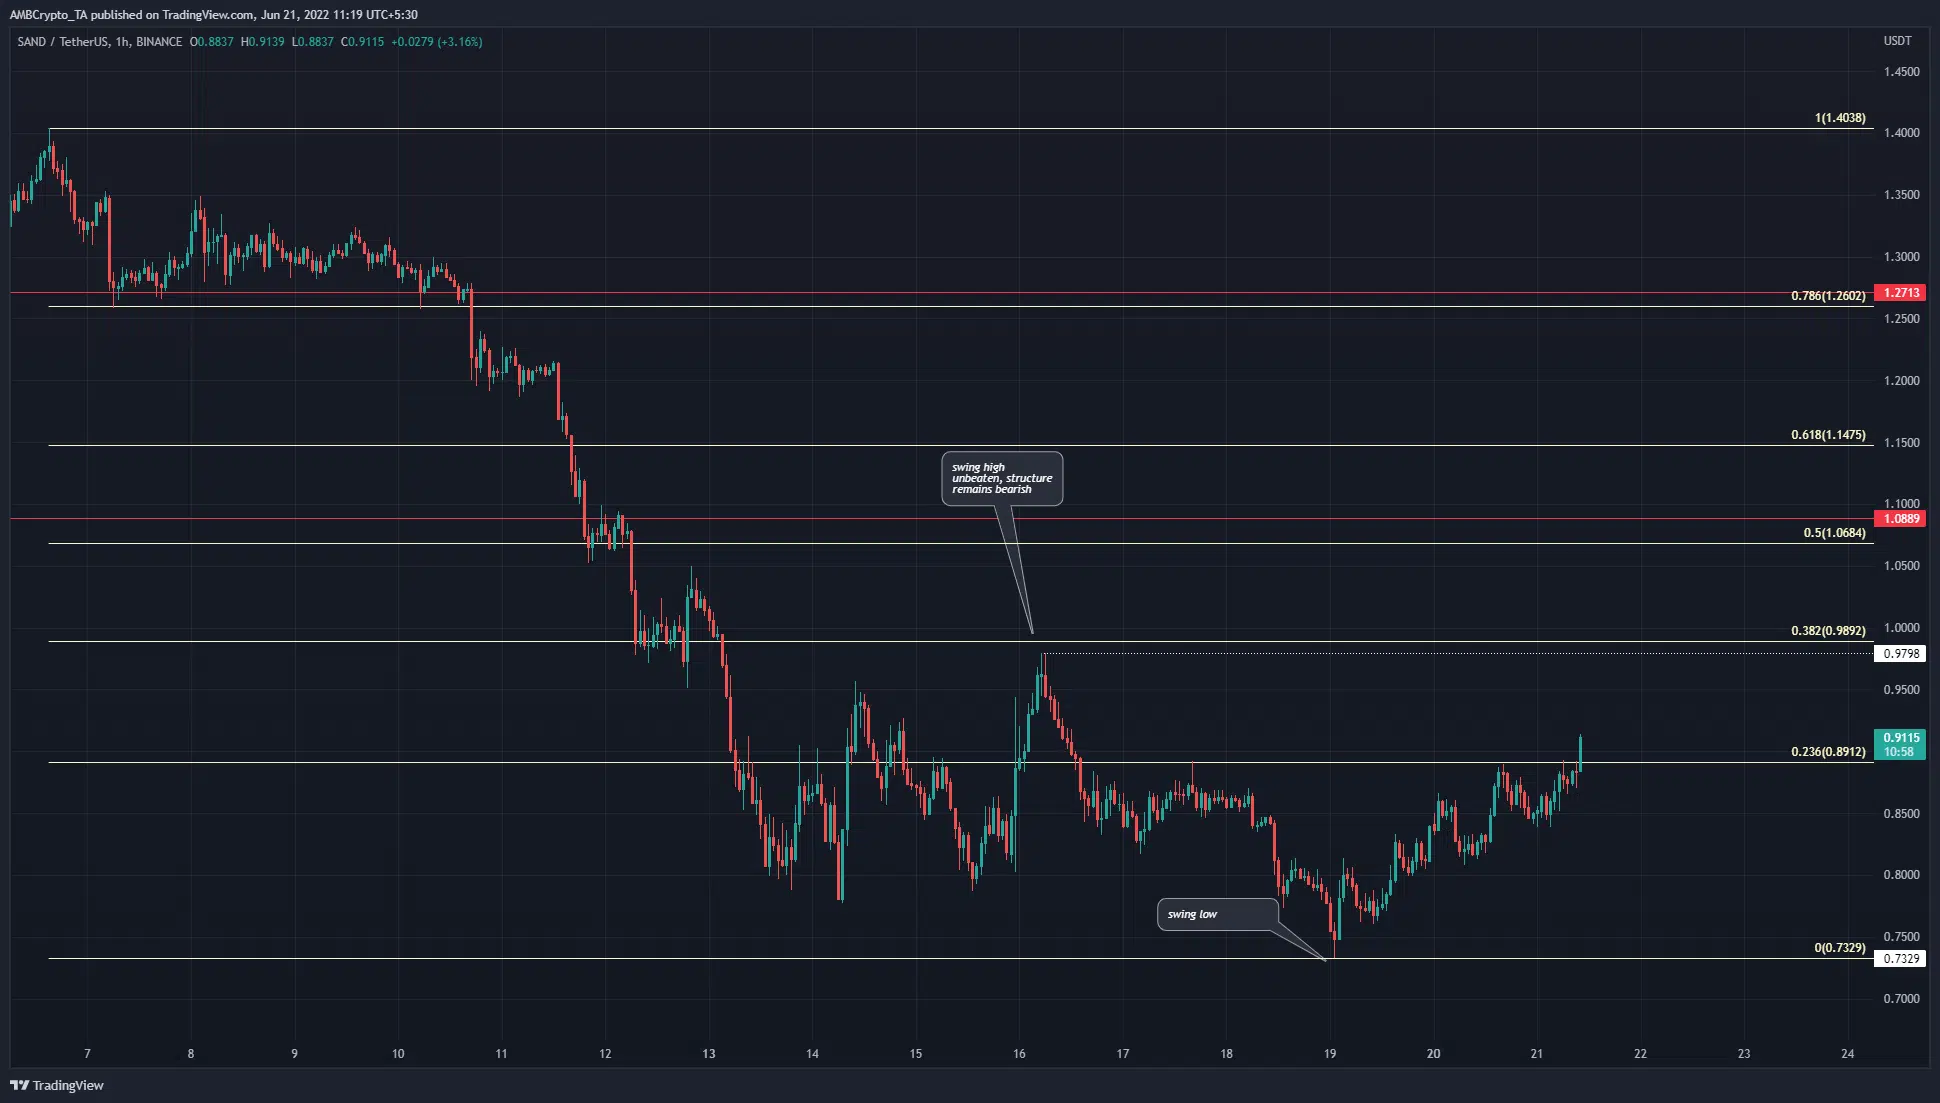
Source: SAND/USDT on TradingView
The Fibonacci retracement levels (pale yellow) were plotted based on SAND’s move from $1.4 to $0.73 over the past two weeks. They showed the 23.6% and 38.2% retracement levels to be at $0.89 and $0.98 respectively.
These levels are strong resistance levels. $0.89 has been beaten at press time. However, the $0.97 (dotted white) represents a local high. It was a lower high on the chart in the recent downtrend. At press time, the market structure was bearish.
Yet, the $0.89 was beaten and the $0.97 remained to be beaten, in order to flip the short-term bias to bullish. On the other hand, the $0.96-$1 region has offered stiff resistance to the price in the past week. Therefore, rejection can not be ruled out either.
Rationale
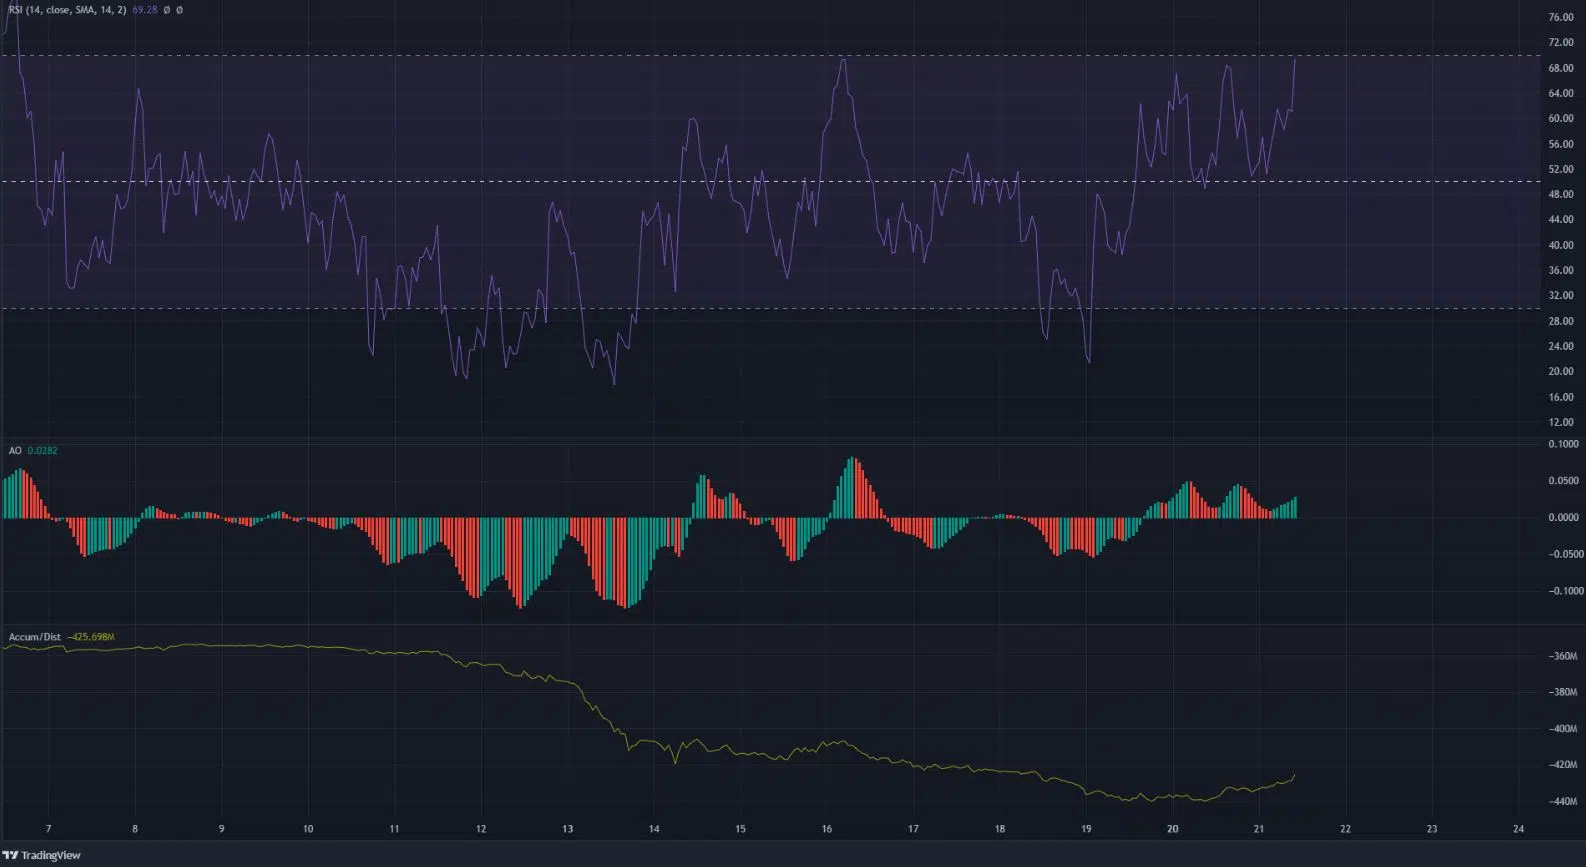
Source: SAND/USDT on TradingView
On the hourly timeframe, the momentum indicators showed bullish momentum. The RSI was above neutral 50 and has defended the neutral 50 line as support. This indicated that the buyers have the upper hand. Similarly, the Awesome Oscillator has also managed to remain above the zero line to show upward impetus.
However, the A/D line was worrisome for the buyers. The indicator has been headed lower and lower in recent days. Despite the surging price, there was no upward spike in the A/D. The inference here was that buying volume has not been significant. Hence, the SAND move toward $0.97 could face rejection and a leg downward in the coming days.
Conclusion
Even though the lower timeframe indicators signaled bullish momentum, there was a lack of demand for SAND in the past few days. Unless demand arrived, a true uptrend might not materialize.
The $1 level is also a psychological resistance. Patience was necessary, and if SAND managed to flip $1 to support, then the upward momentum can likely be sustained. Else, a reversal back toward $0.8-$0.75 could be on the cards.
![Why Chainlink [LINK] and Polygon [MATIC] are more similar than you realise](https://ambcrypto.com/wp-content/uploads/2024/04/Chainlink_and_Polygon-1-400x240.webp)