SAND is not mirroring the rest of the market and here’s the reason why

Following a month-long decline and the hawkish remarks made by Fed Chair Jerome Powell, crypto-investors finally saw some relief over the last 10 days on the back of the market’s appreciation.
According to CoinGecko, the global cryptocurrency market capitalization has grown by 9% over the last 30 days. The past week saw the price of “failed” coins like LUNC and LUNA rally by 235% and 96%, respectively. Assets such as HNT, ATOM, ETC, EOS, and GRT have all recorded double-digit gains of >10% in the last seven days too.
Worth pointing out, however, that Metaverse tokens seem to have missed out on a lot of that growth. ApeCoin’s APE rallied by a mere 7% over the week, Sandbox’s SAND saw 6% gains, while Decentraland’s MANA hiked by just 2%.
Ergo, it would seem that investors’ attention has shifted from highly volatile metaverse-linked assets to more secure assets like stablecoins.
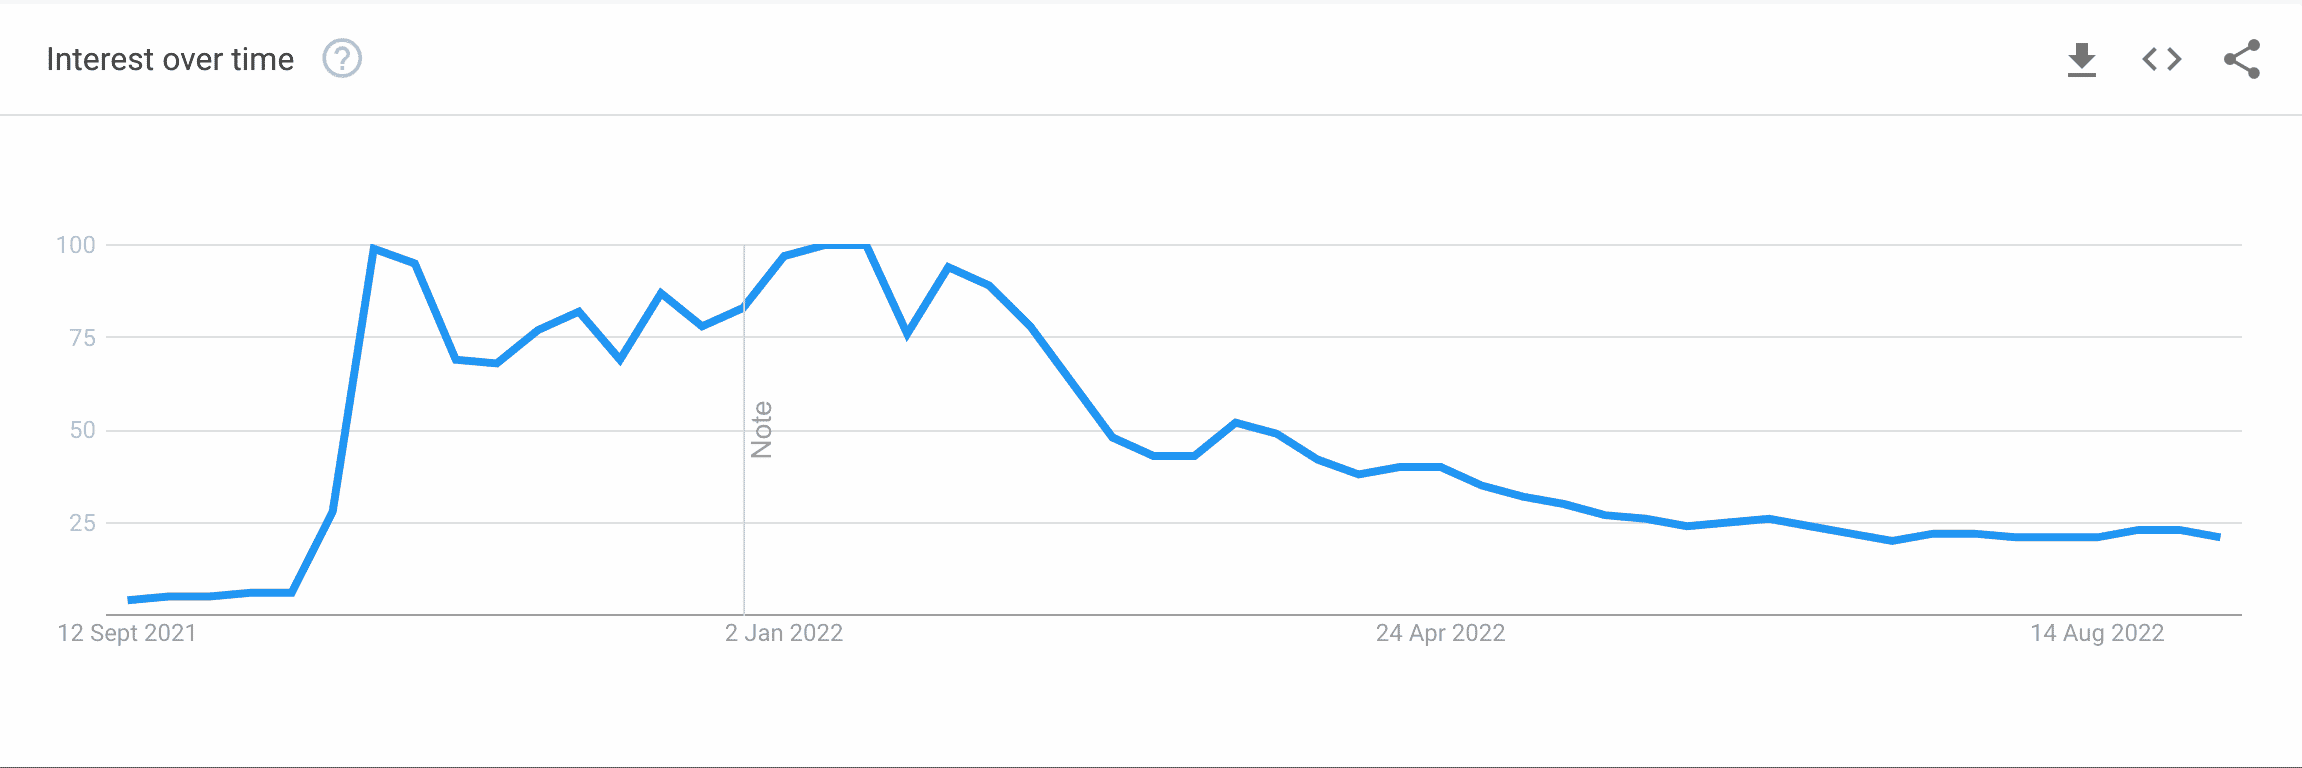
A simple Google Trends search reveals that interest in Metaverse-related activities has dropped significantly over the past few months. Hence, the failure of Metaverse-linked crypto-assets to see any major price growth over the past few weeks can be explained.
SAND holders should know that…
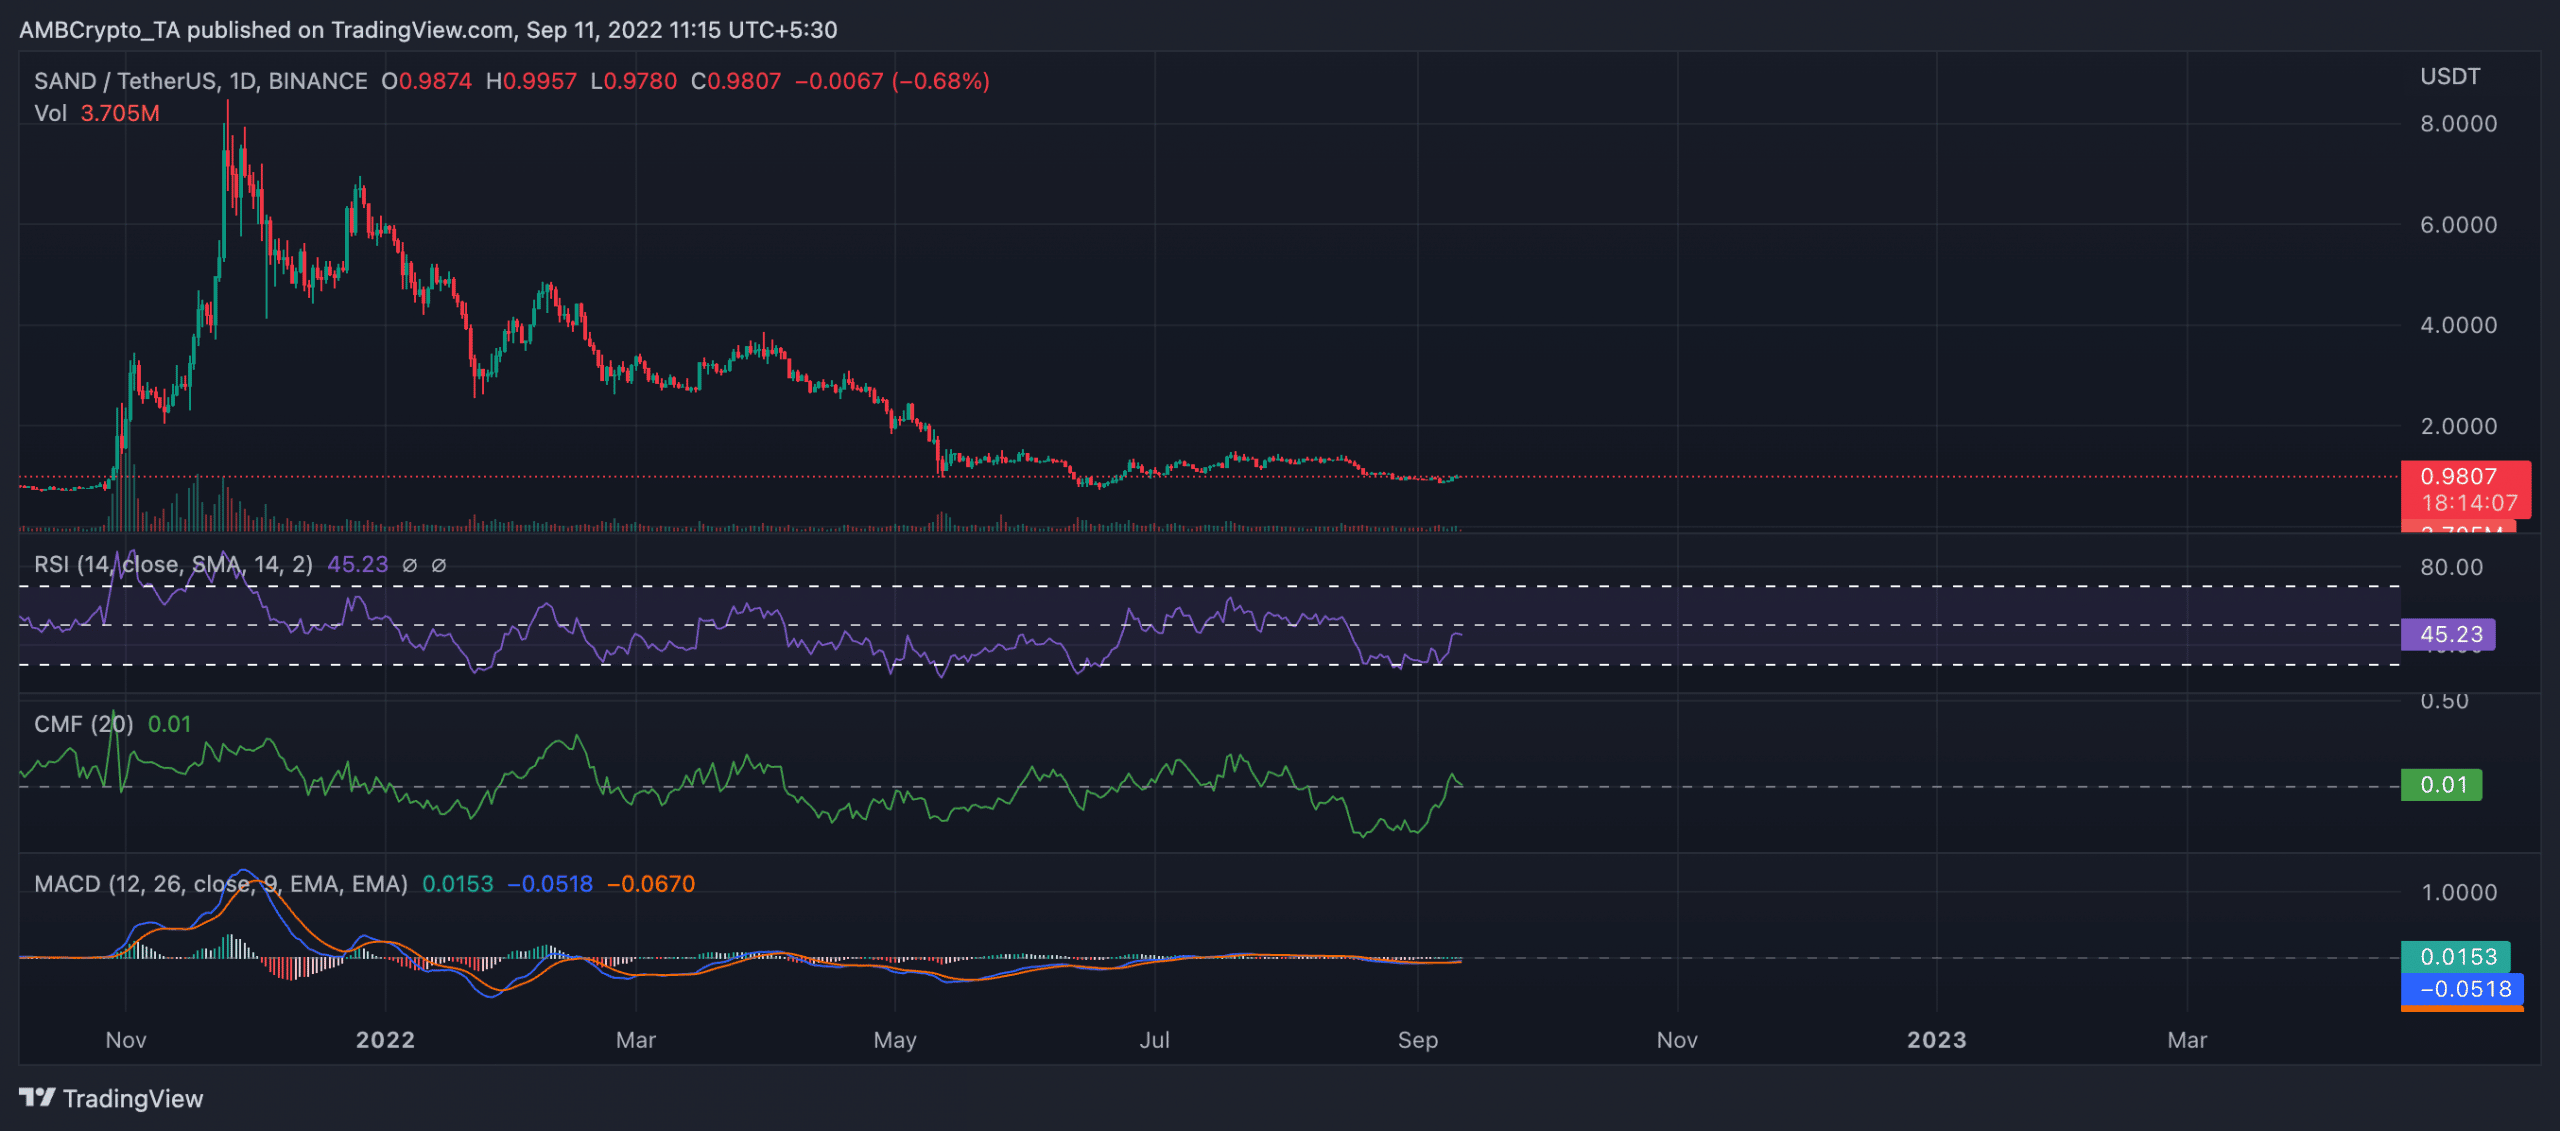
According to CoinMarketCap, SAND was trading at $0.983 at press time. Ranked 40th by market cap, its price appreciated by 1% over the last 24 hours. Trading in a tight range since the middle of August, the Metaverse token traded around its October 2021 price level. It was also 88% shy of its all-time high of $8.44 clinched last November.
On the daily chart, a look at the token’s Moving Average Convergence Divergence (MACD) revealed the commencement of a new bull cycle on 4 September. However, this cannot be taken as an indication of SAND’s performance as it merely follows the trajectory of the general cryptocurrency market.
A look at indicators like Chaikin Money Flow (CMF) and Relative Strength Index (RSI) provides a clearer outlook. At 0.01 in a downtrend, SAND’s CMF was positioned south, showing a waning interest in SAND accumulation. Also, the asset’s RSI rested below the 50-neutral region at a flat 45, indicating that the buyers were beginning to tire out.
SAND on the chain
It is trite that the price performance of a cryptocurrency asset is highly linked to growth on its network. For SAND, not much traction was seen on that front.
According to data from Santiment, daily active addresses that transacted SAND have declined steadily since 25 August. The same had a reading of 268 addresses, at press time. New addresses on the network also dropped by 67% within the same period.

With a possible decline coming, the road ahead may be rough for SAND holders as a majority of investors may distribute the Metaverse token and scamper for safety in the hands of more stable assets.


