SAND’s ‘historical tendency of reversing’ has these near-term effects

Disclaimer: The findings of the following analysis are the sole opinions of the writer and should not be considered investment advice
As SAND approached the $4.8-mark, it repeated its historical tendency of reversing. As a result, the alt descended in a two-week-long down-channel (white) while struggling to break above the $3.3-mark.
Now, SAND is looking to revive from the $2.8-zone towards its immediate resistance around the $2.9-$3 range before continuing its long-term downtrend. At press time, SAND traded at $2.92, down by 2.69% in the last 24 hours.
SAND 4-hour Chart
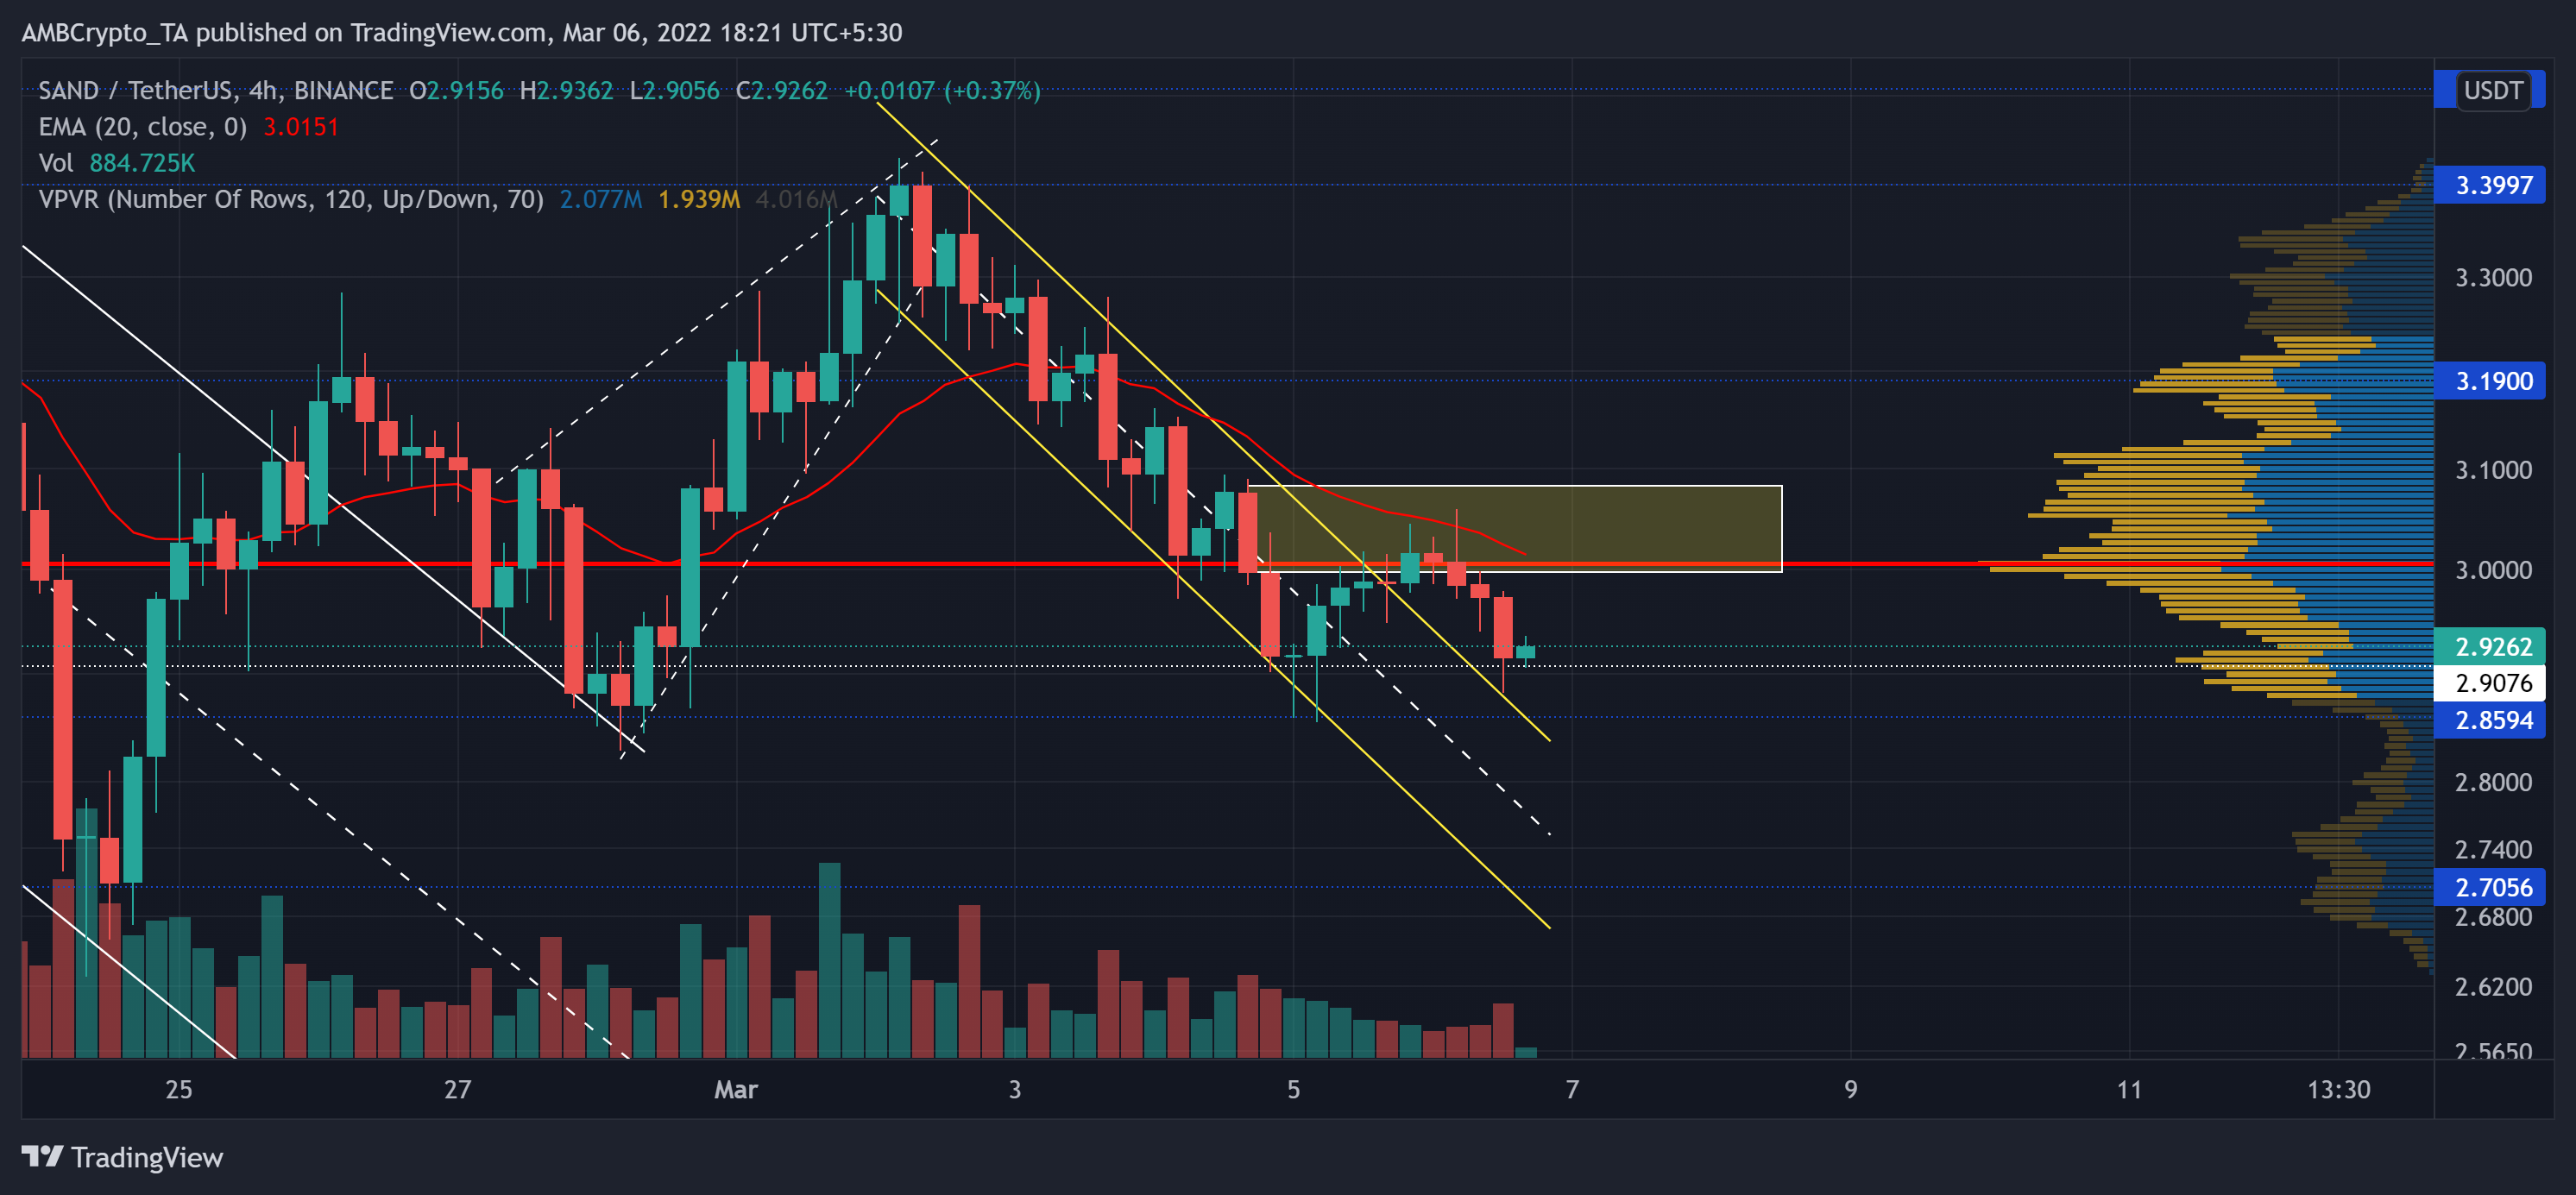
The previous uptrend saw exceptional gains as the altcoin touched the $4.8-resistance. However, as the bears started to gain momentum, they propelled a steep downturn towards its long-term $2.7-$2.8 support range.
Meanwhile, SAND noted a 45.7% decline (from 9 February) as it touched its January lows on 24 February. Since then, the alt has registered impressive gains as it broke out of its long-term down-channel. However, as the $3.3-resistance offered a trigger point for the bears, SAND fell below its Point of Control (POC, red) and affirmed a bearish edge.
From here on, the bulls seem adamant about keeping the $2.8-support intact. Thus, a revival towards the $2.9-level followed by its POC could be likely. The 20 EMA (red) would continue to pose a strong barrier for the bulls in their recovery attempt. Also, with the overall volumes decreasing in the last few days, the trend has become fragile. In order for the bulls to trigger a trend-altering rally, they still need to infuse volumes.
Rationale
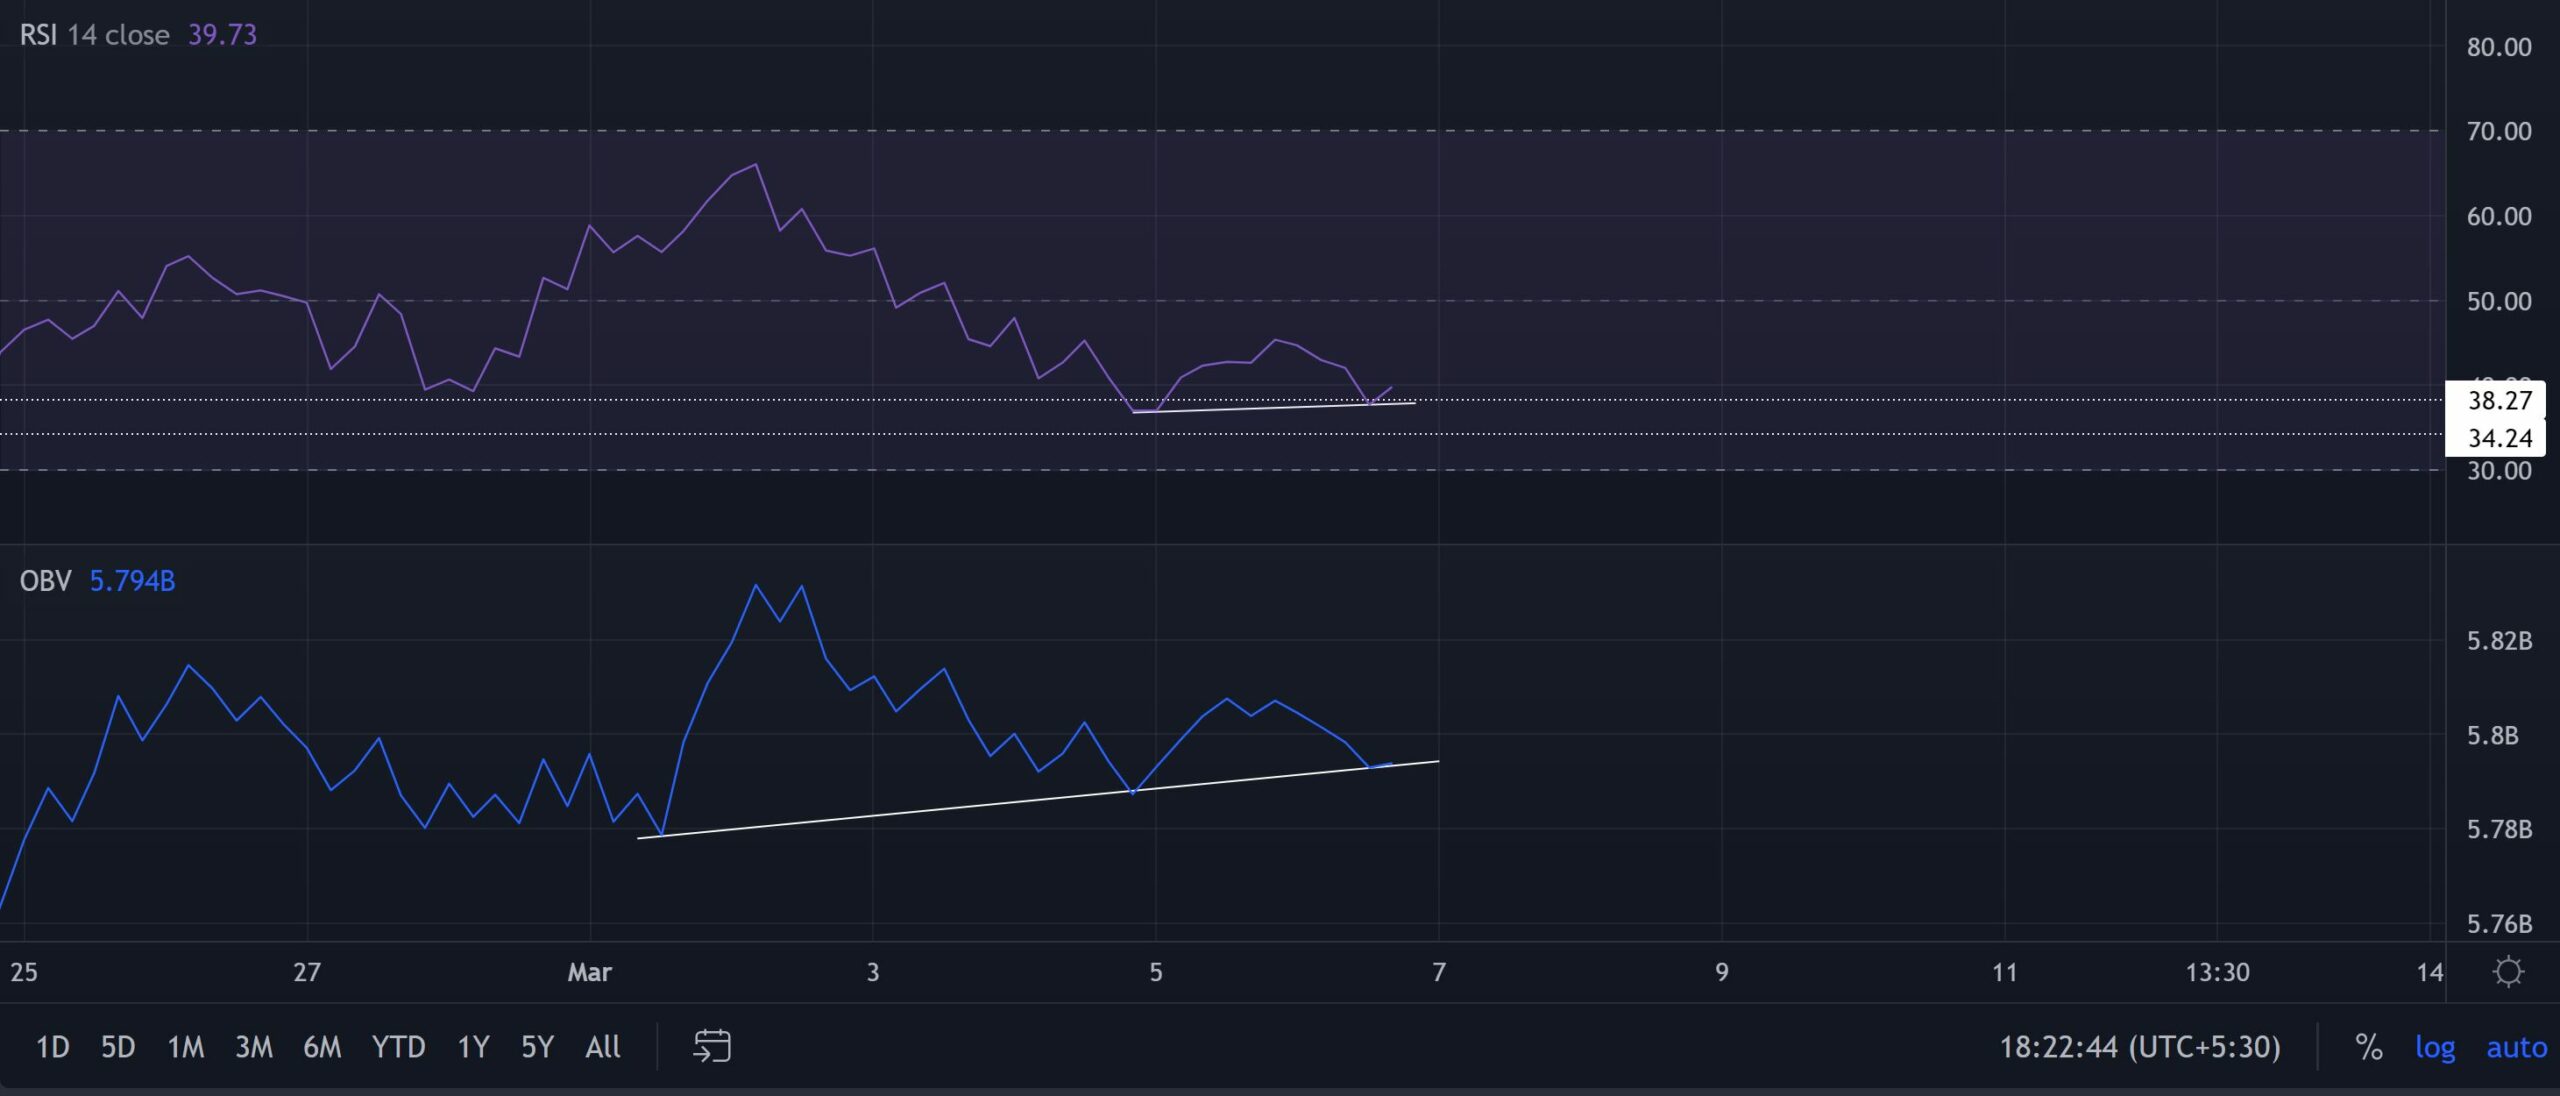
As the price kept testing the $2.9 support, the RSI saw a higher trough. This was a sign of bullish tendencies in the near term. As it revived from the 38-support, the bulls adhered to the trendline support (white).
Moreover, the OBV and price saw a bullish divergence over the last five days. The price kept declining while the OBV was on an uptrend, reaffirming the near-term increasing bullish comeback possibility.
Conclusion
While the readings on the RSI and OBV potentially hint at stalling the sell-off situation, SAND will eye a retest of its POC/supply zone before falling back into its long-term trend. Besides, the alt shares a staggering 80% 30-day correlation with the king coin. Ergo, keeping an eye on Bitcoin’s movement would be vital to complement these technical factors.