Shiba Inu
Shiba Inu – All you need to know about SHIB’s latest breakout odds
Shiba Inu may be on the verge of a breakout. A new high for the memecoin soon?
- Shiba Inu seemed to be approaching the resistance of a bullish pattern
- However, a key technical indicator raised a red flag
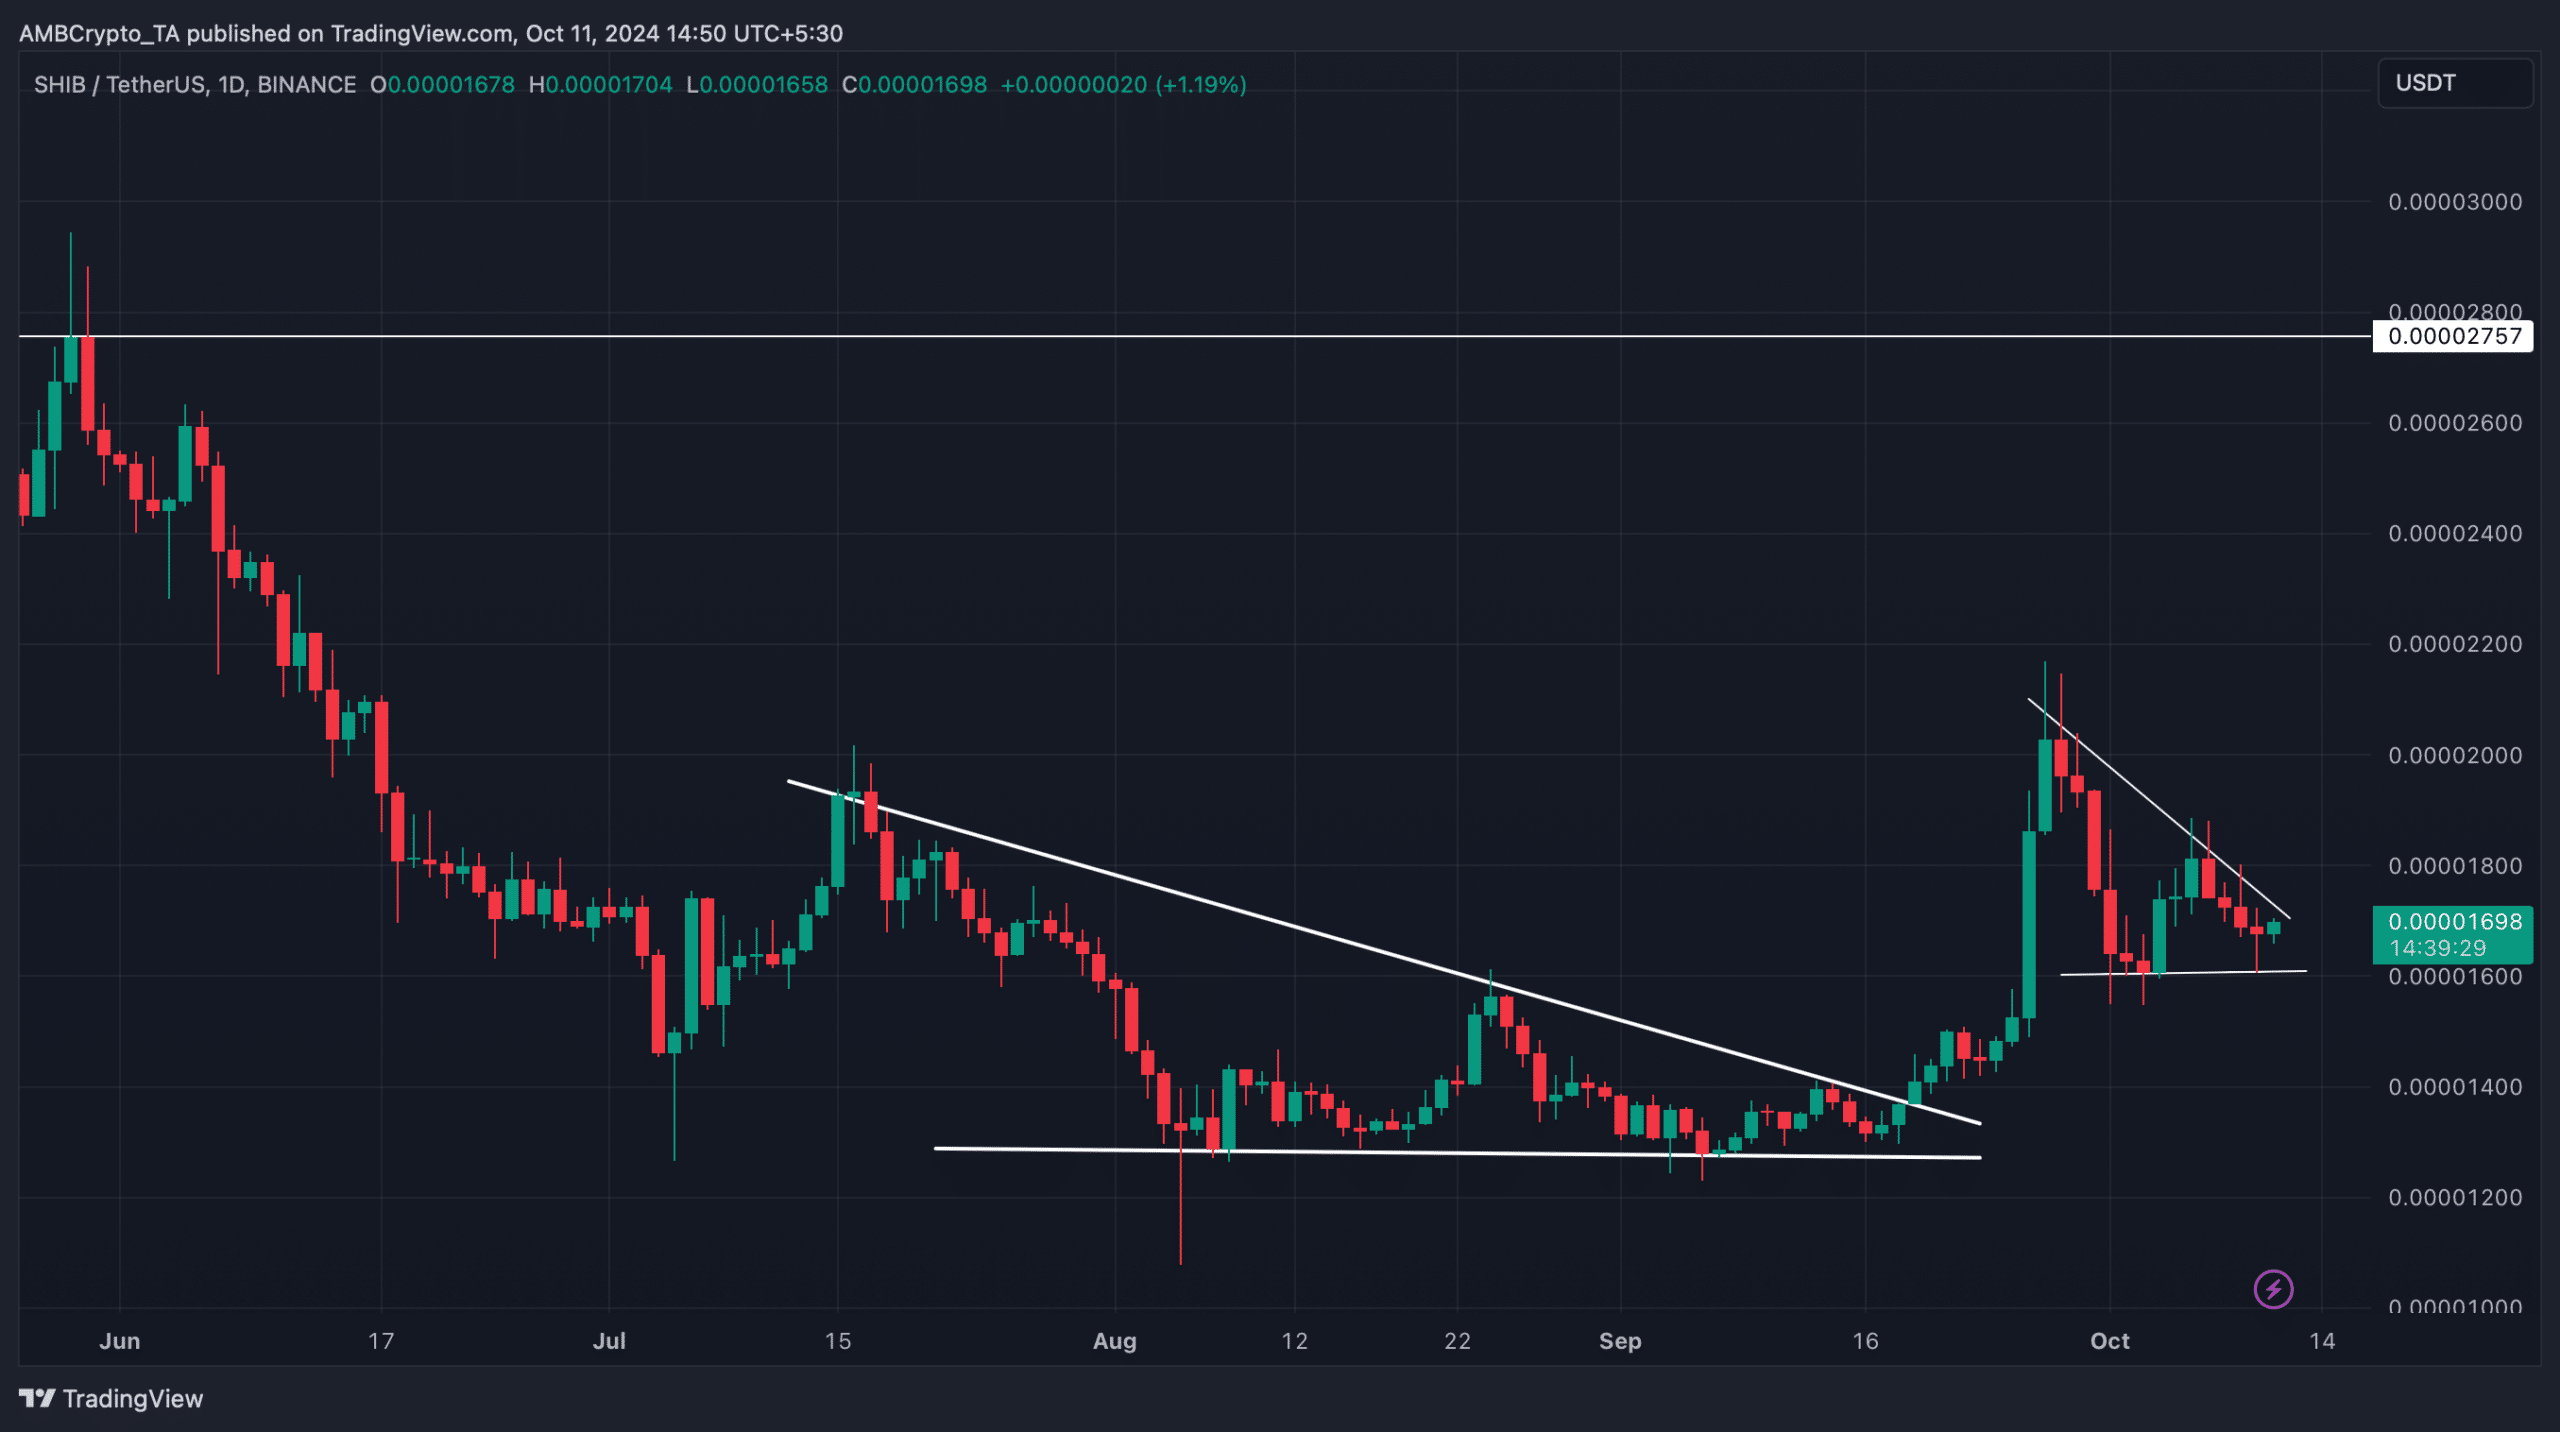
Last month, Shiba Inu [SHIB] broke above a bullish pattern, allowing it to register promising gains on the charts. The world’s second-largest memecoin has once again been consolidating inside a bull pattern over the last few days.
If SHIB manages to repeat history, then investors might see SHIB touch high ground.
Shiba Inu’s double breakout
As mentioned previously, Shiba Inu made a bullish exit from a descending triangle pattern on 18 September. After the breakout, the memecoin recorded a promising rally and touched $0.000020. However, at that point, the memecoin witnessed a correction.
However, there was more to the story as SHIB once again entered a similar pattern.
At the time of writing, it was testing the resistance of the bull pattern. A breakout above that level could result in a massive rally. And, this could push SHIB to $0.000027 in the coming days or weeks.
Source: TradingView
Will SHIB break out again?
AMBCrypto then planned to dive deeper into the memecoin’s state to better understand the odds of a bullish breakout. According to CoinMarketCap, SHIB’s price has already shown positives on its price charts, as both its daily and weekly charts were green.
The better news was that while the memecoin’s price increased, its trading volume also surged by over 19%. Whenever the trading volume rises amidst a price uptrend, it hints at a sustained price hike. Therefore, it’s worth looking at on-chain metrics too.
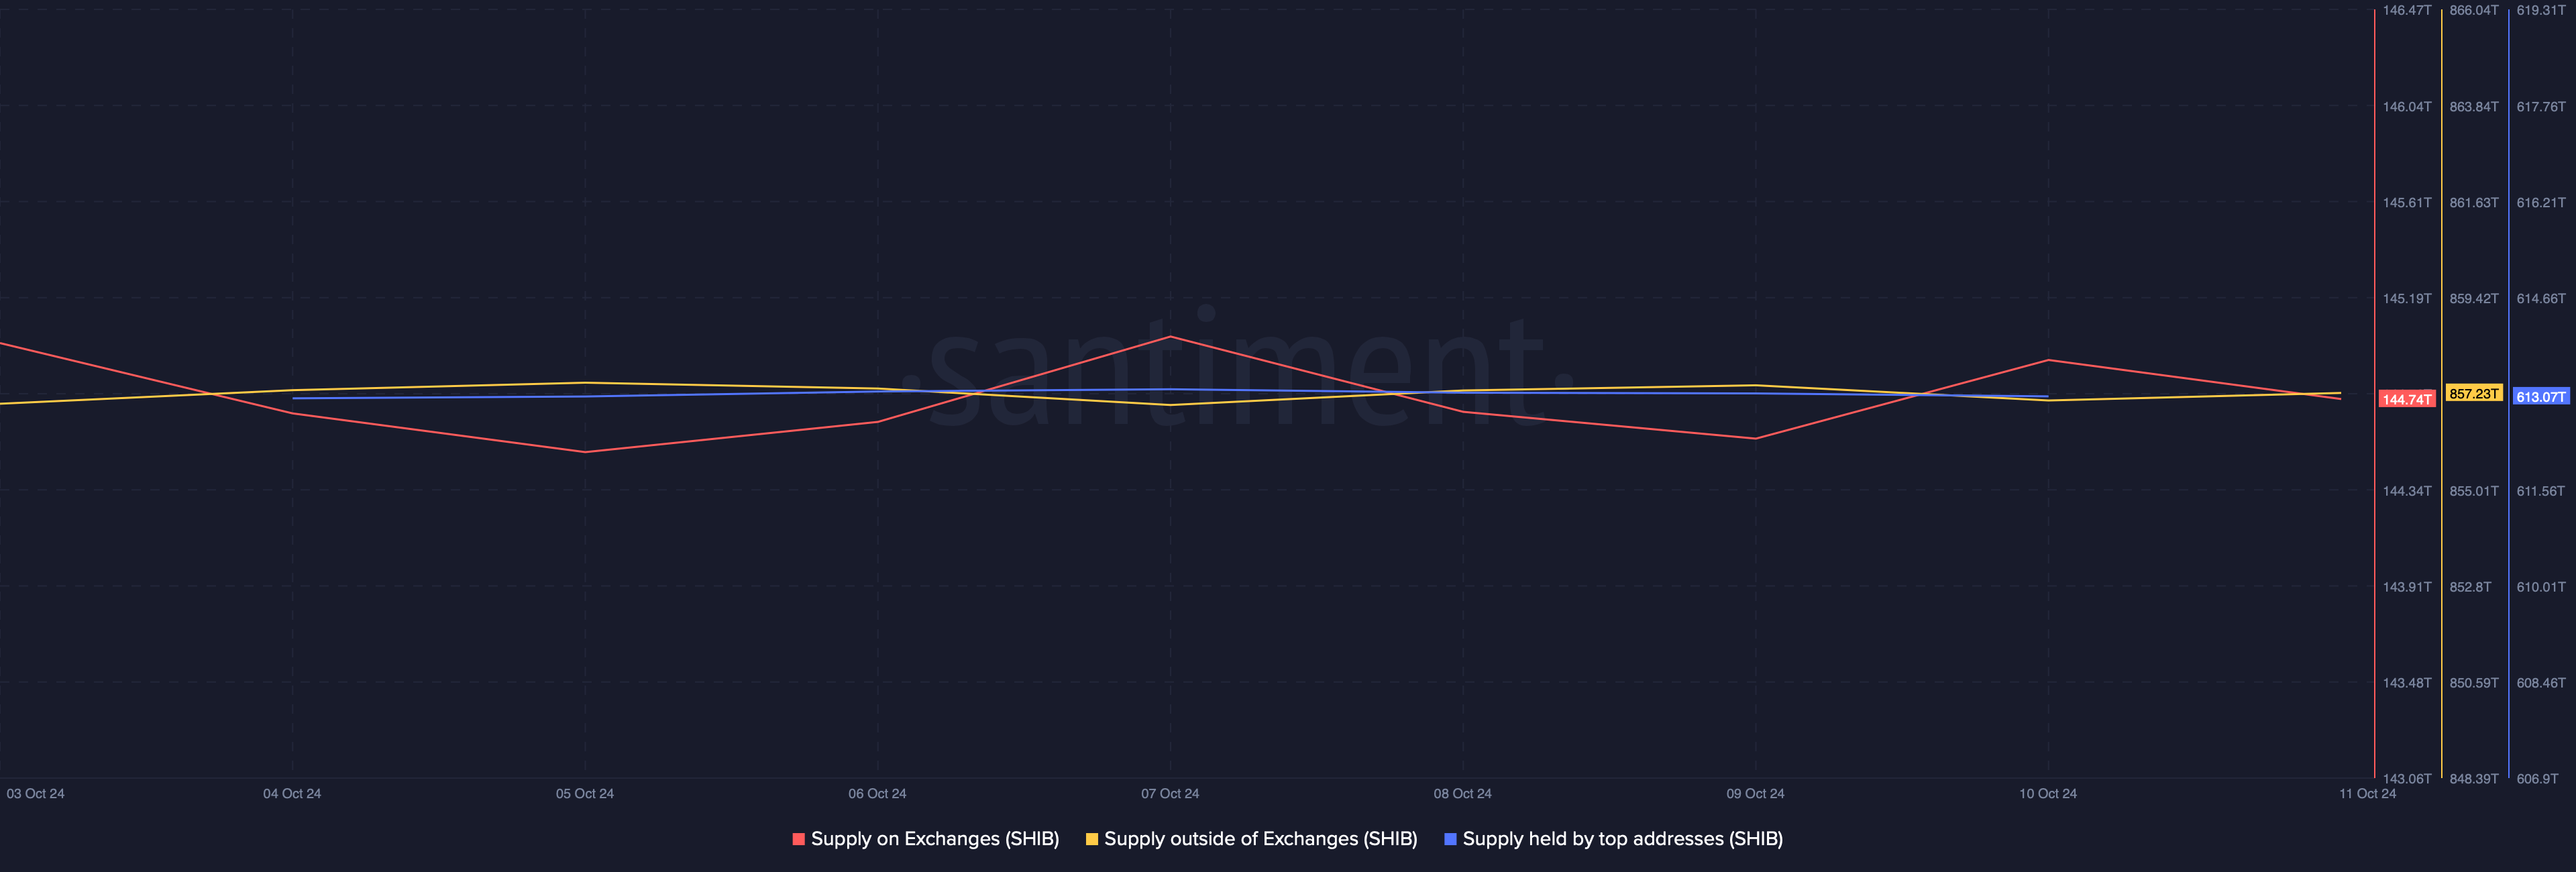
According to our analysis, despite this bullish pattern appearing, selling and buying pressure remained relatively stable. This was evidenced by the closely knit supply on exchanges and supply outside of exchanges graphs. Moreover, whales have also not been actively trading Shiba Inu, as suggested by the flat supply held by the top addresses graph.
Source: Santiment
At the time of writing, SHIB’s fear and greed index was in the “greed” position. Whenever the metric hits this level, it indicates a price correction.
Hence, AMBCrypto assessed the memecoin’s technical indicators to better understand whether a bullish breakout is possible above the pattern.
Read Shiba Inu’s [SHIB] Price Prediction 2024–2025
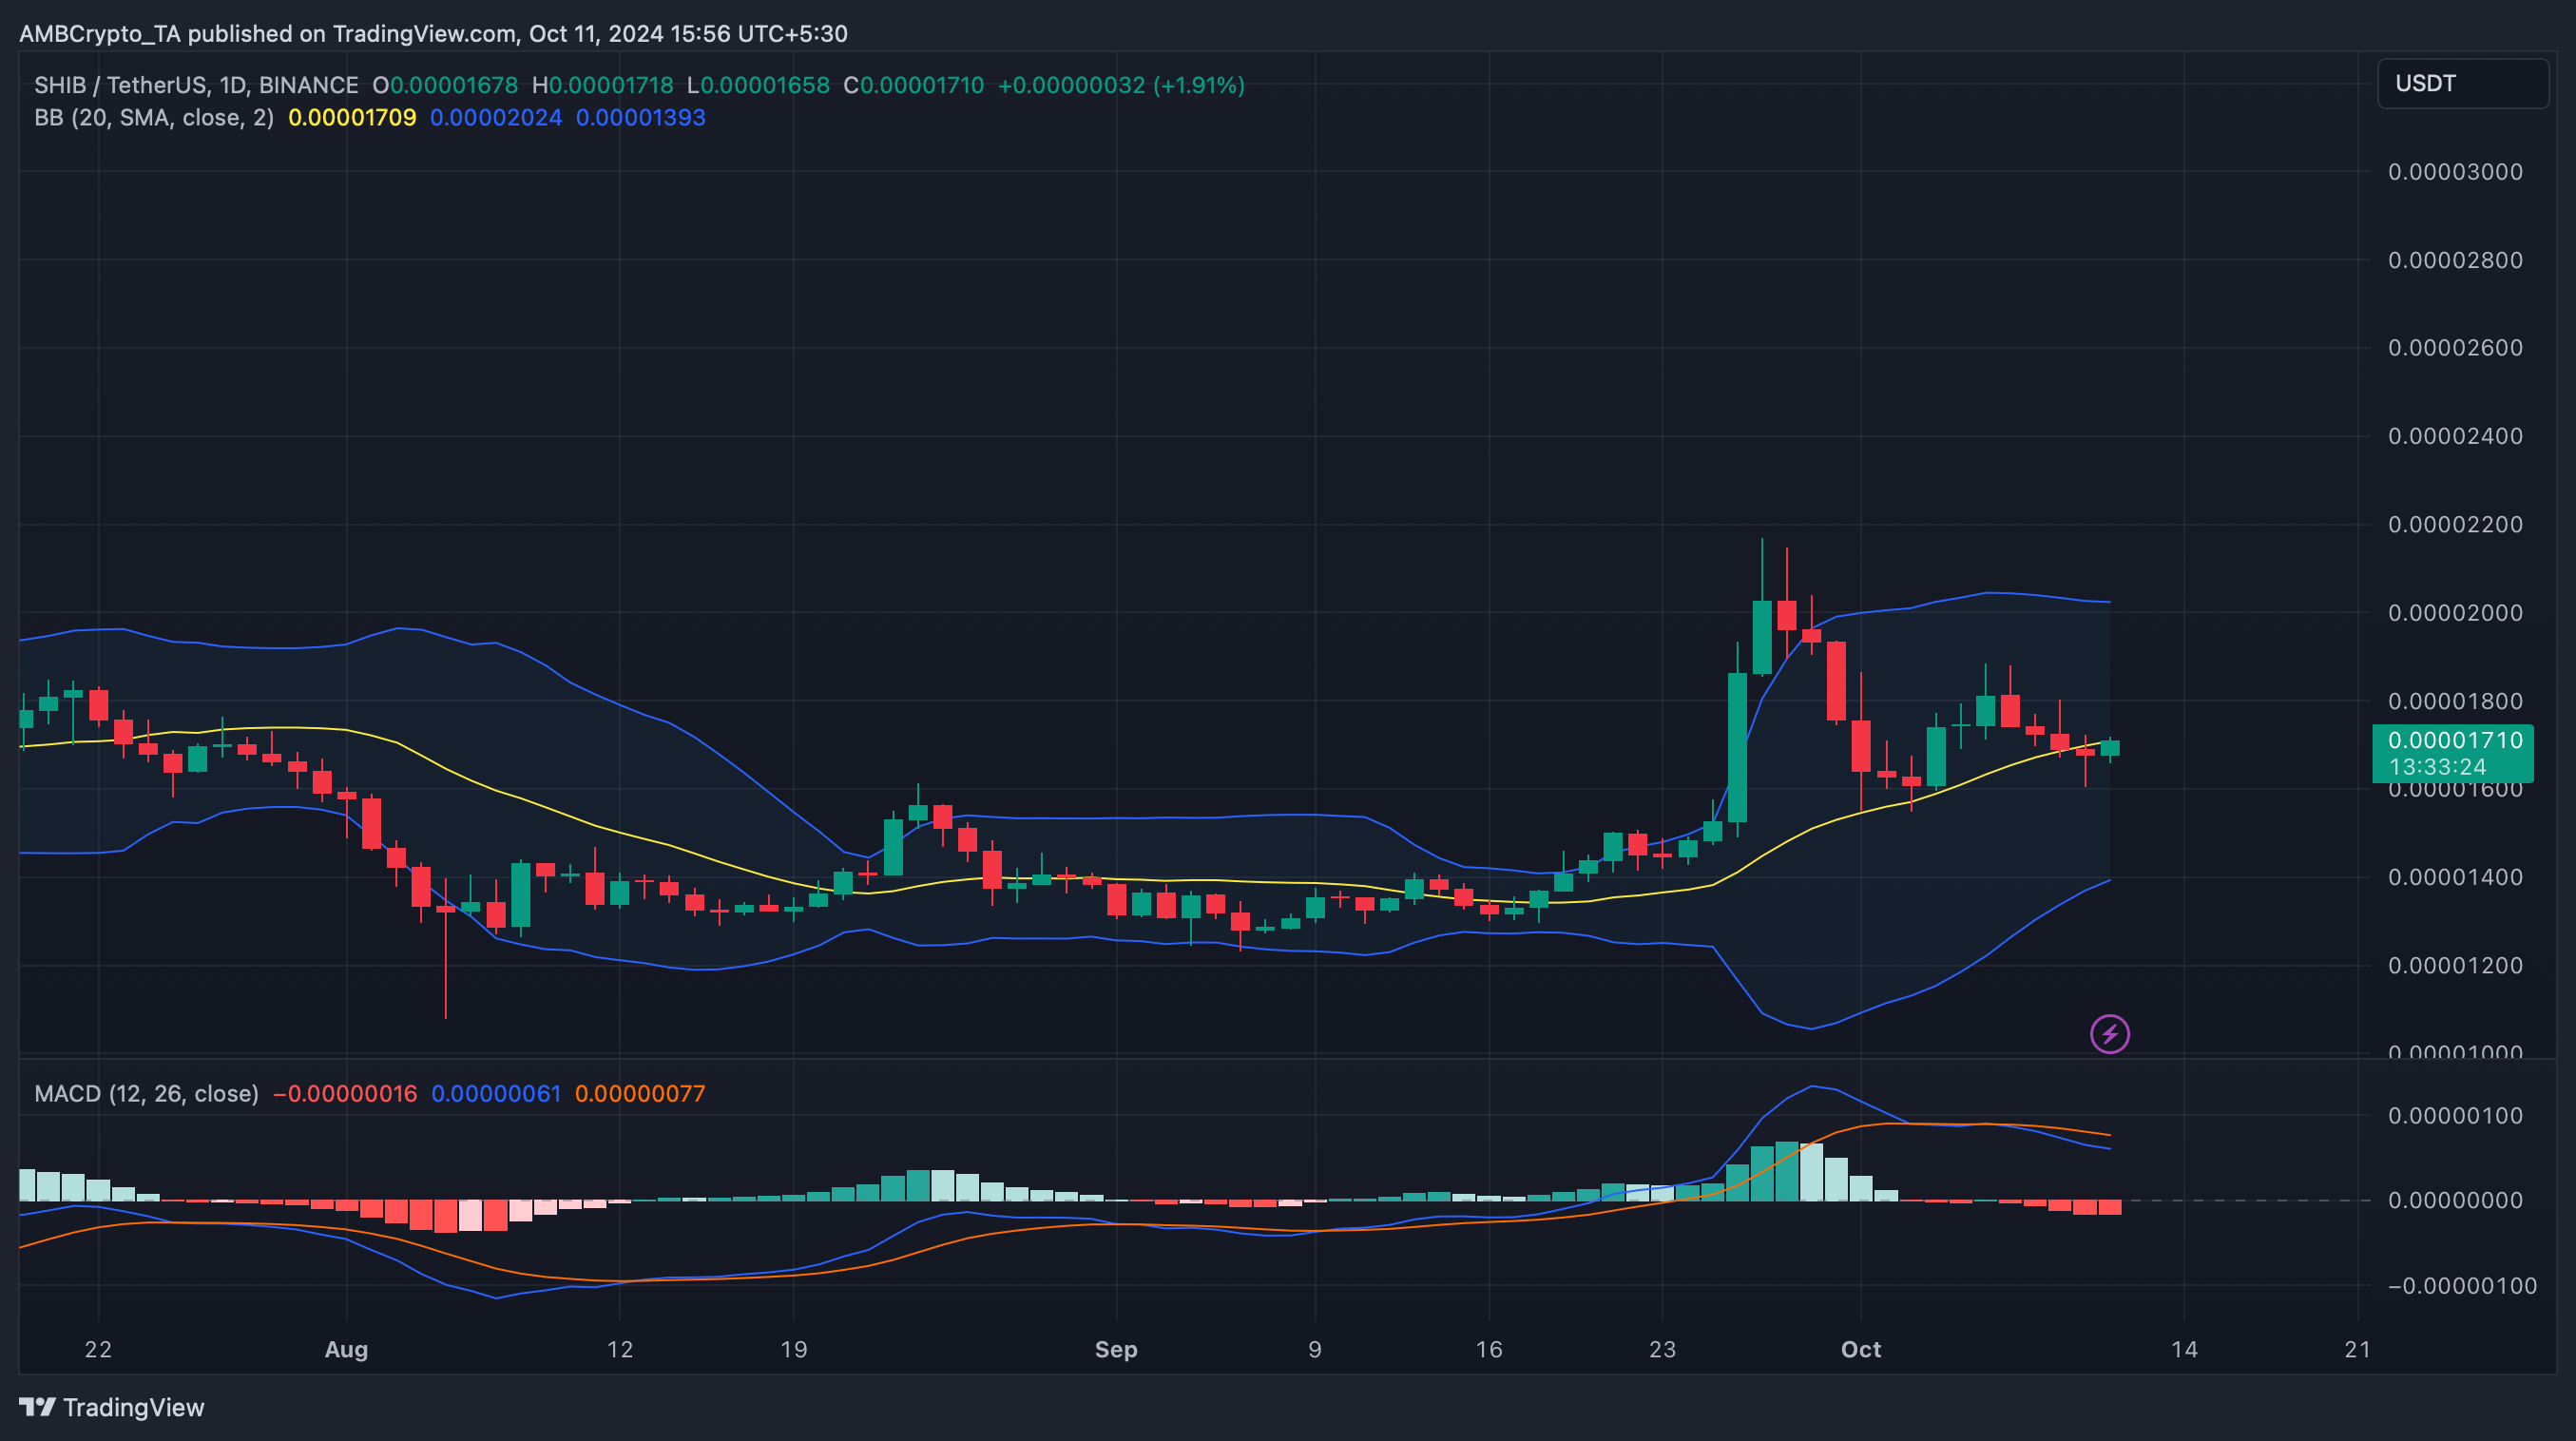
As per our analysis, SHIB was testing its 20-day Simple Moving Average (SMA) resistance too. A breakout above that would ensure a jump above the bullish pattern, allowing it to target $0.000027.
However, the technical indicator MACD flashed a bearish crossover. This might restrict Shiba Inu’s price from moving north in the short term.
Source: TradingView