Shiba Inu: Another 100% surge is possible only if…
Disclaimer: The findings of the following analysis are the sole opinions of the writer and should not be taken as investment advice
Shiba Inu was left troubled after a symmetrical triangle breakdown halted its progress towards its previous target of $0.000012568. Although the last couple of days have resulted in a 50% surge, some of its indicators are yet to assume bullish positions and nullify market uncertainties.
With the ADX picturing a weak directional trend as bulls attempt to flip a key resistance zone, SHIB could remain restricted below the 200% Fibonacci Extension before its indicators start to flash favourable readings.
At the time of writing, SHIB was trading at $0.00005785, up by 2.5% over the last 24 hours.
Shiba Inu 4-hour Chart
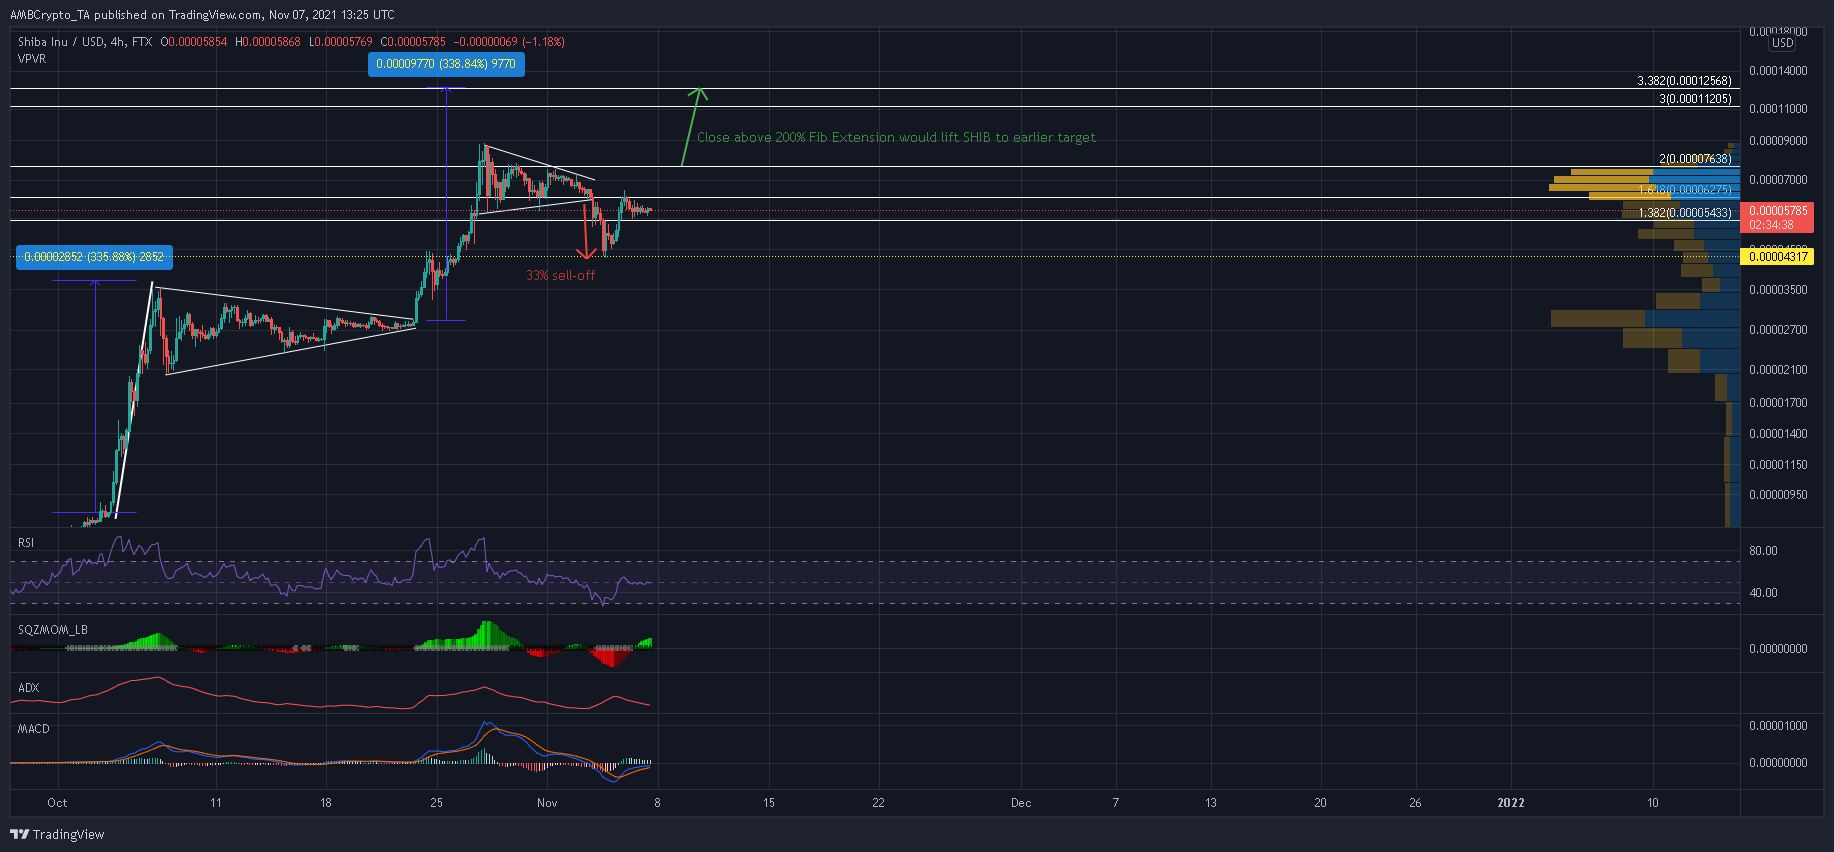
Based on SHIB’s flagpole of its October bull flag pattern, a 340% breakout target was identified at $0.000012568. Once a symmetrical triangle took shape during the final week of October, SHIB looked set to tag its earlier target following a successful upwards breakout. However, a weakening RSI allowed bears to initiate a move in their favor as SHIB suffered a 33% sell-off following a close below the bottom trendline.
Now, the bullish reaction has been instant over the last couple of days, resulting in a 50% pickup from the $0.00004317-support. In order to stretch these gains towards the 3.382% Fibonacci Extension, bulls would need to register a convincing close above $0.00007638.
According to the Visible Range Profile, SHIB saw a huge chunk of trades between the 161.8% and 200% Fibonacci Extension levels and consistent volumes will be needed to overturn this resistance zone.
Reasoning
Despite recent gains, SHIB’s 4-hour RSI still sat close to the half-line and flashed a neutral reading. In fact, the MACD was yet to recover above its equilibrium and bullish momentum was once again receding as per the histogram.
Moreover, the ADX clocked in at 19 and suggested that the market was in equilibrium between buyers and sellers. These signs suggested that SHIB was not poised for a close above the 200% Fibonacci Extension just yet.
Conclusion
Over the near-term, SHIB could continue to trade sideways as the RSI and MACD continue their recovery following a symmetrical triangle breakdown on 3 November. To reach its earlier target of $0.000012568 and register another 100% surge, SHIB would need to maintain healthy volumes on its ascent above the 200% Fibonacci Extension Level.


