Shiba Inu at a demand zone but below it lies a deep chasm
The long-term outlook for Shiba Inu remained on the bearish side even as the price tested, for the third time, the $0.027-$0.029 area of demand on the charts. Note that Shiba Inu prices are represented as current prices multiplied by 1000, to reduce the number of decimal places and help with clarity. Bitcoin was trading at a demand area too, meaning Shiba Inu and the rest of the market could note a rise in price on their USDT (stablecoin) pairs.
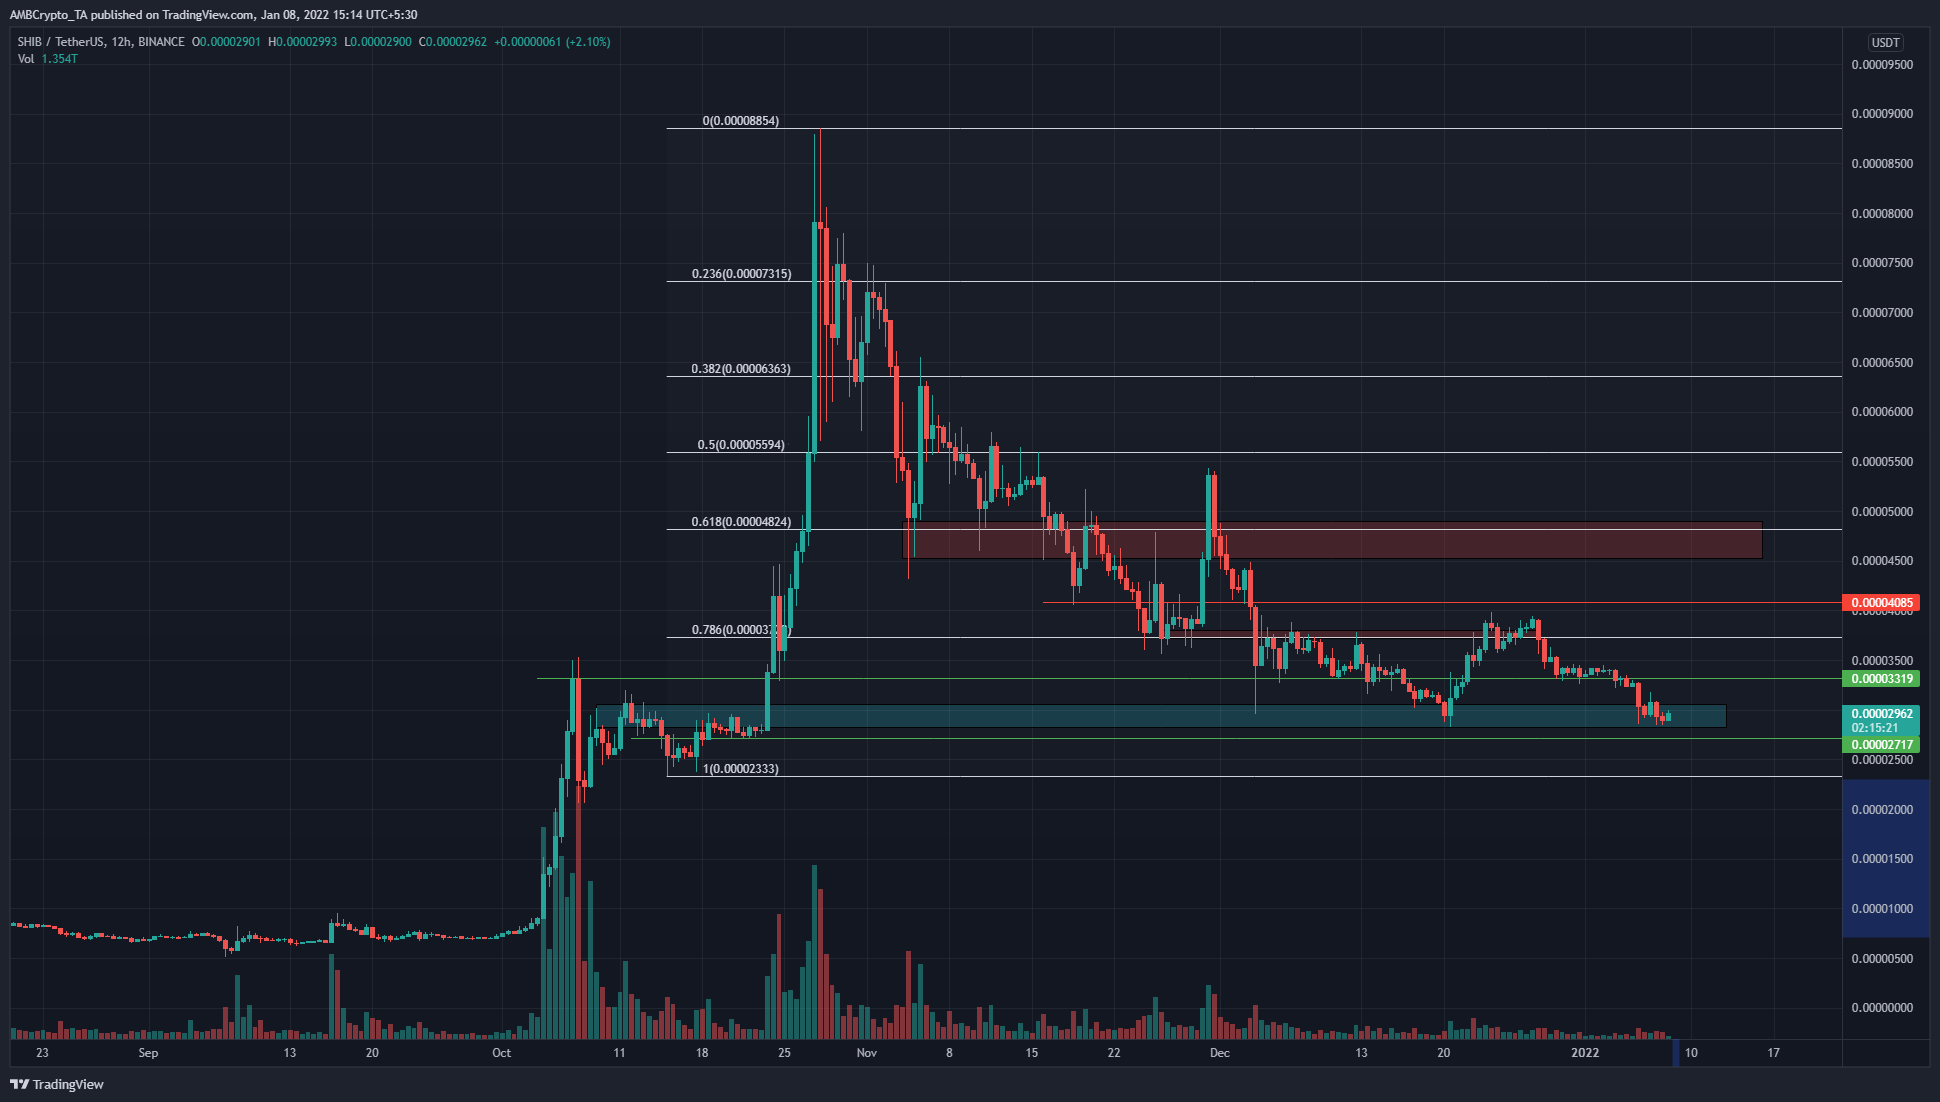
The stakes for Shiba Inu bulls were high. A failure to defend this key level could see Shiba Inu drop 20% to the next significant support zone and a further 70% from thereon.
When the price rises or falls, market participants identify areas where they would look to buy and sell the asset. In this way, even during conditions of a strong trend, the price does see a pullback, or a bounce, depending on the direction of the trend.
In late September and early October, SHIB began a rally from $0.0077 and shot upward to the $0.029 level, and pulled back to the $0.022-$0.023 over the next few days.
This was the area of concern for buyers, and long-term investors in this meme coin hoping it would rally once again and register triple-digit gains. Beneath the $0.029 and $0.023 levels, the price did not have significant areas of support on the way up. This meant that no buyers were present to stop the price from crashing right through. The area where SHIB could find buyers beneath these levels would be after SHIB registered another 70% in losses.
Rationale
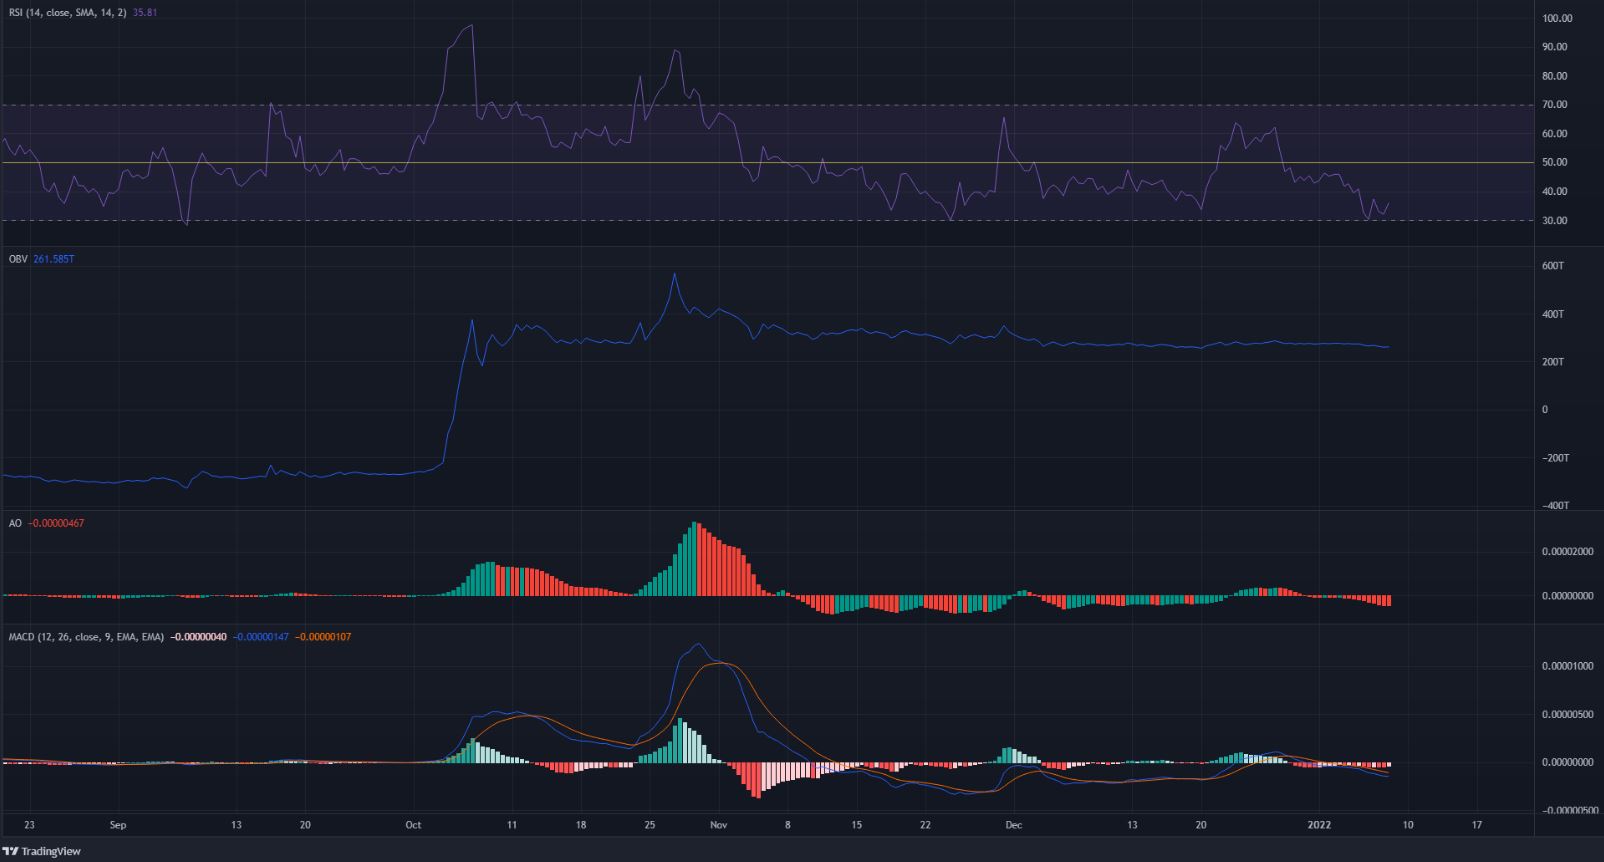
The MACD and the Awesome Oscillator indicated bearish momentum on the 12-hour chart. The RSI bounced off the 30 mark, a place where the bulls have generally been able to halt momentum from leaning heavily bearish.
The OBV was moving sideways, compared to the massive influx of buys that came in during October. However, it too posted a series of lower highs.
Conclusion
The $0.029 (cyan box) does represent a good area, risk-to-reward wise, for buyers to enter SHIB, provided they set a stop-loss just beneath the $0.027 mark. Even the $0.023 level, if SHIB descended that low, can be used to buy SHIB with a tight stop-loss. If these two levels are lost on higher timeframes such as daily, there was only thin air beneath SHIB and a nearly 70% drawdown.


