Shiba Inu, Binance Coin, VeChain Price Analysis: 08 February

Shiba Inu saw exponential gains over the past week and challenged its Point of Control that offered the highest liquidity for nearly three months. Further, Binance Coin and VeChain also projected a one-sided bullish preference in their near-term technicals. Besides, all of these cryptos now flashed an overbought RSI that could eye to test their immediate supports.
Shiba Inu (SHIB)
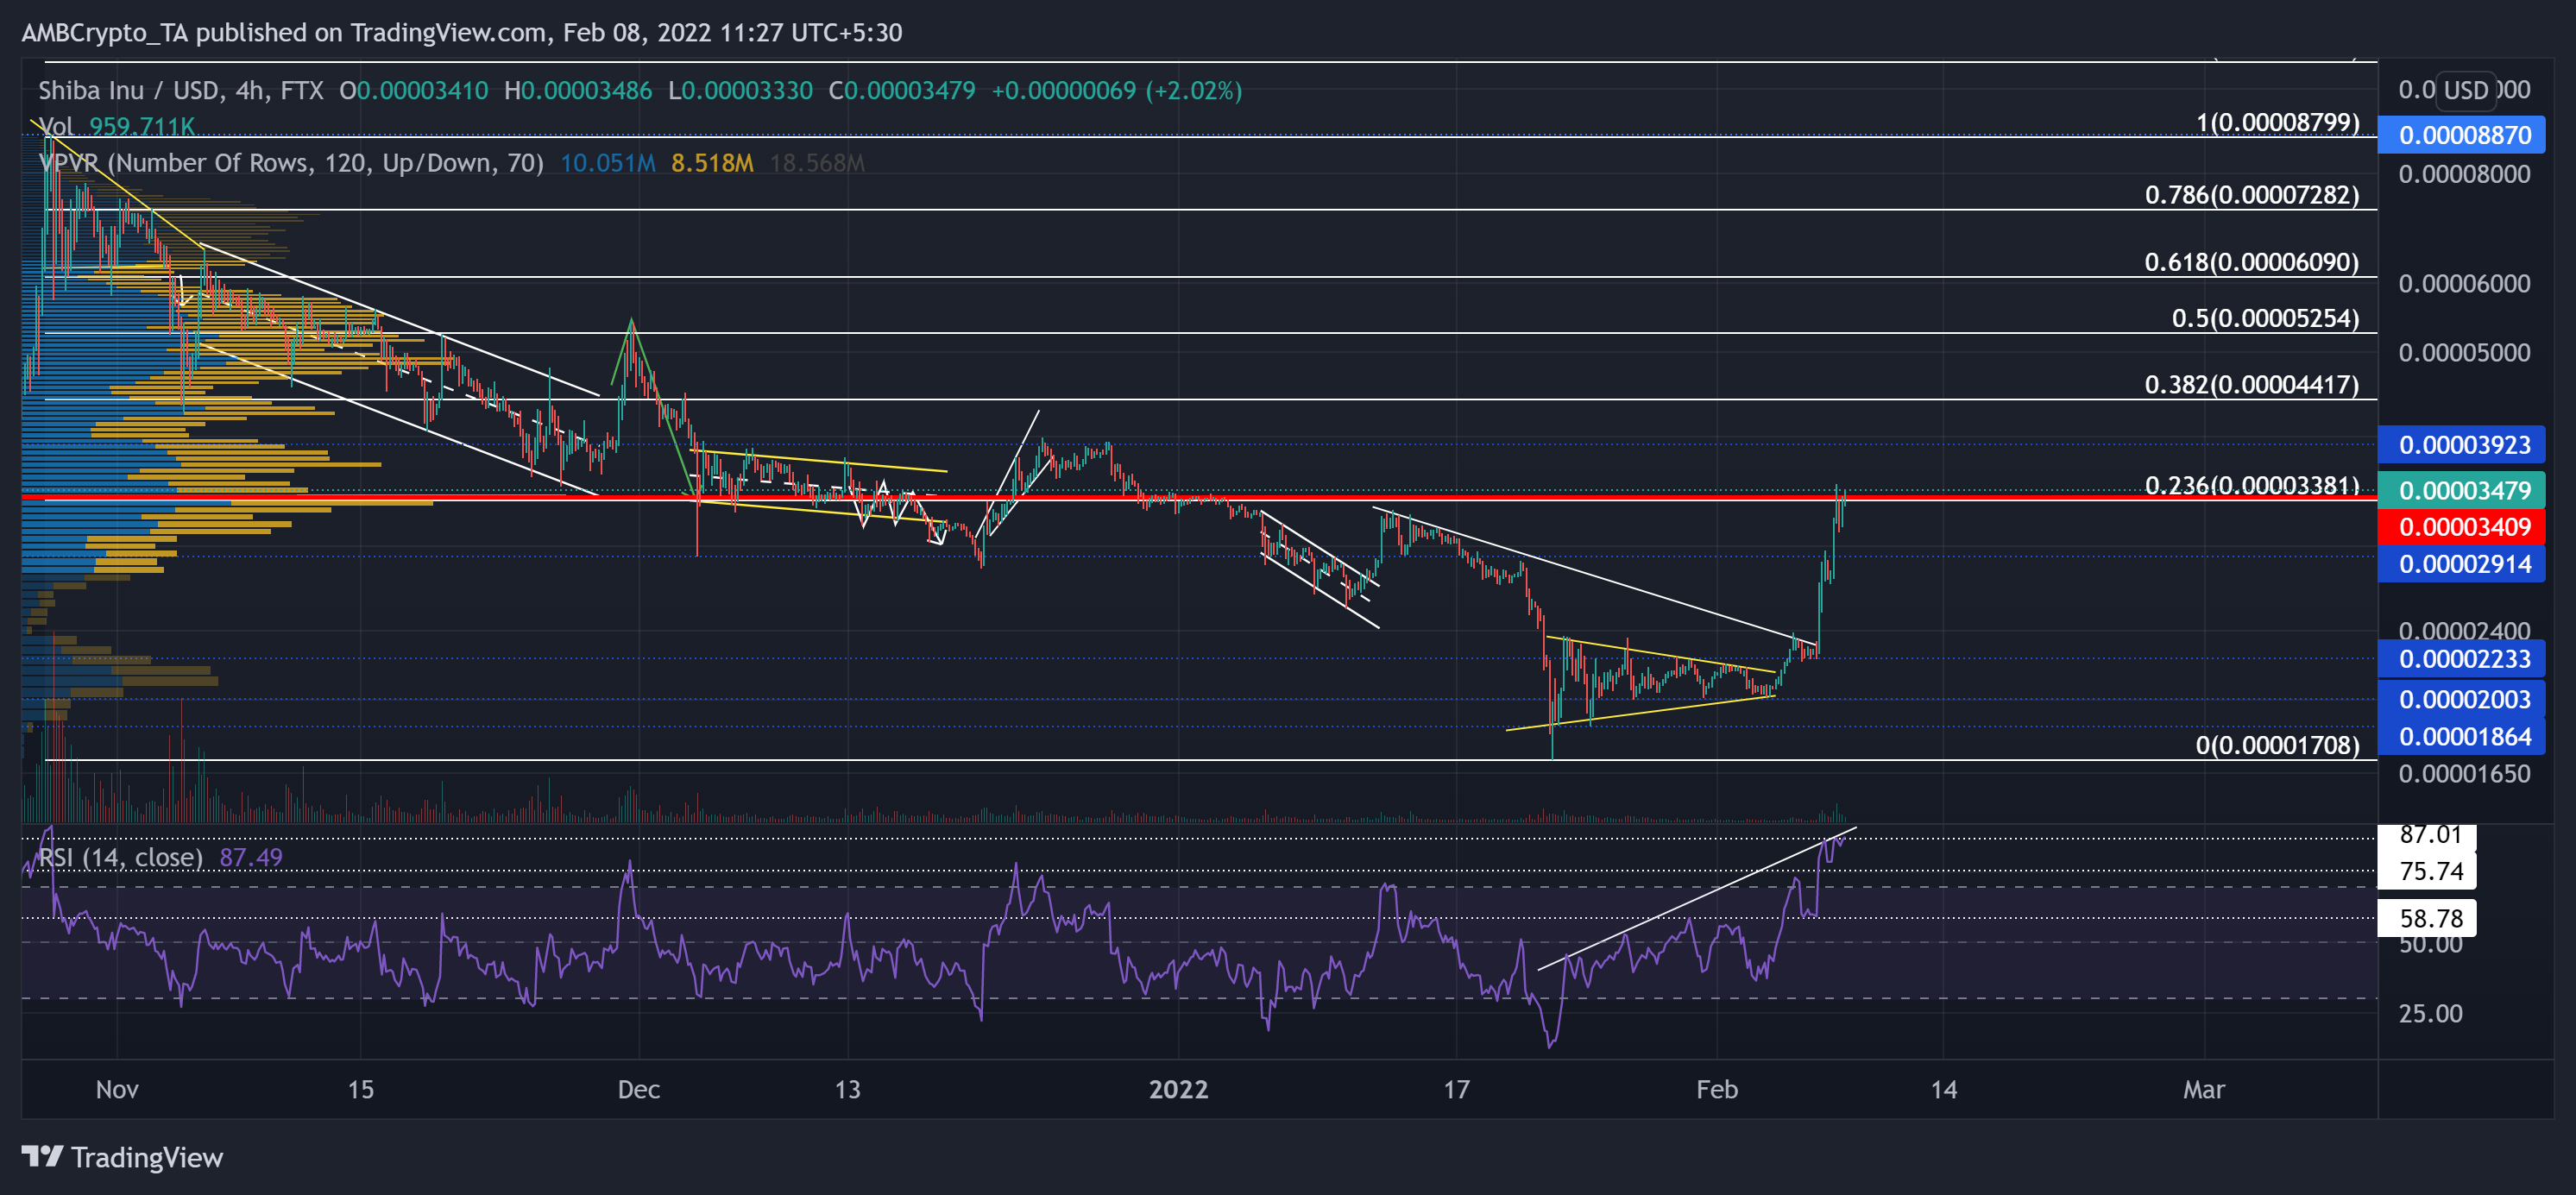
The buyer stepped in at the $0.000018-mark after the alt poked its three-month low on 22 January. Since then, SHIB bulls initiated a recovery and snapped off the trendline resistance (white).
The dog-themed coin witnessed a symmetrical triangle (yellow) breakout on its 4-hour chart on 4 February. Thus, the bulls tested the Point of Control (red) and 23.6% Fibonacci resistance after noting an exceptional 75.5% ROI (from 4 February low). Now, the buyers will continue to face resistance at the current level. Any breakdowns would find testing support near the $0.000029-mark.
At press time, SHIB traded at $0.00003479. After a 50 point surge in just four days, the RSI headed deep into the overbought region and hit its 15-week high on 8 February. Any potential fallout would test the 75-mark before committing to a direction.
Binance Coin (BNB)
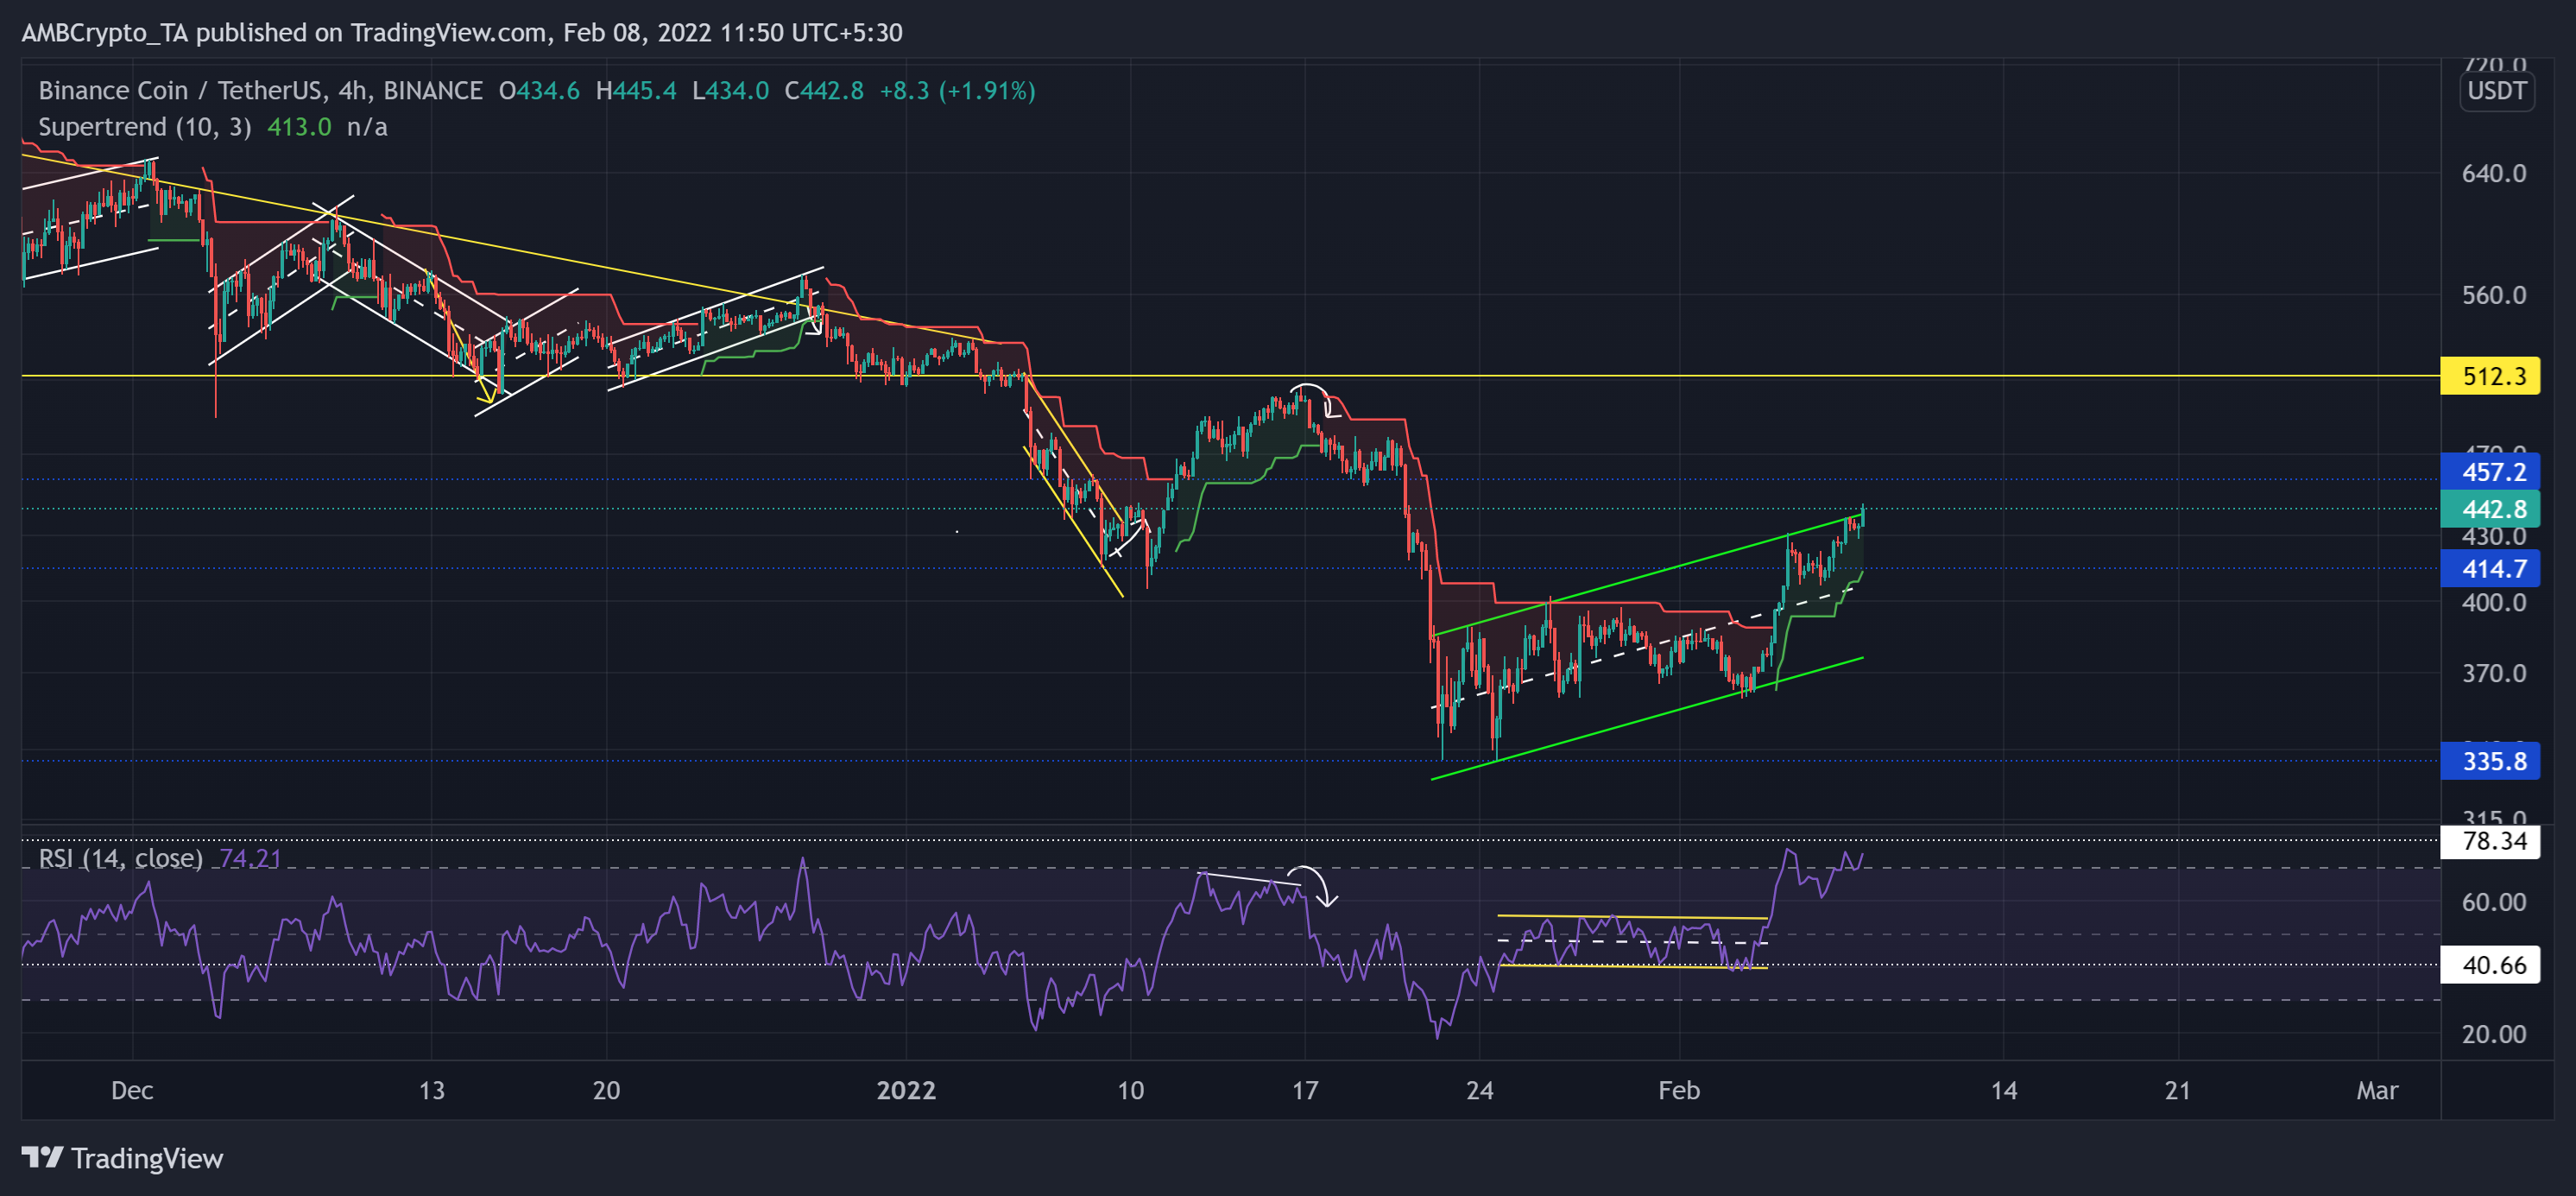
After breaking down from its long-term descending triangle, it witnessed two substantial sell-offs. As a result, BNB noted a 34.78% loss (from 5 January) and touched its 16-week low on 24 January.
However, BNB bulls propelled a recovery as the alt saw a 31.9% ROI to date. As a result, the bulls flipped the $414-mark from resistance to support. Meanwhile, the alt formed an up-channel on its 4-hour chart. Any breakouts from here would find a ceiling near the $457-level. Contrarily, A likely fall from this level would find testing support at the $414-level.
At press time, the BNB was trading at $442.8. The RSI rapidly grew after breaking out of the 11-day rectangle top (yellow). It breached into the overbought territory and eyed to test the 78-mark. Not surprisingly, the Supertrend flashed a green signal, favoring the buyers.
VeChain (VET)
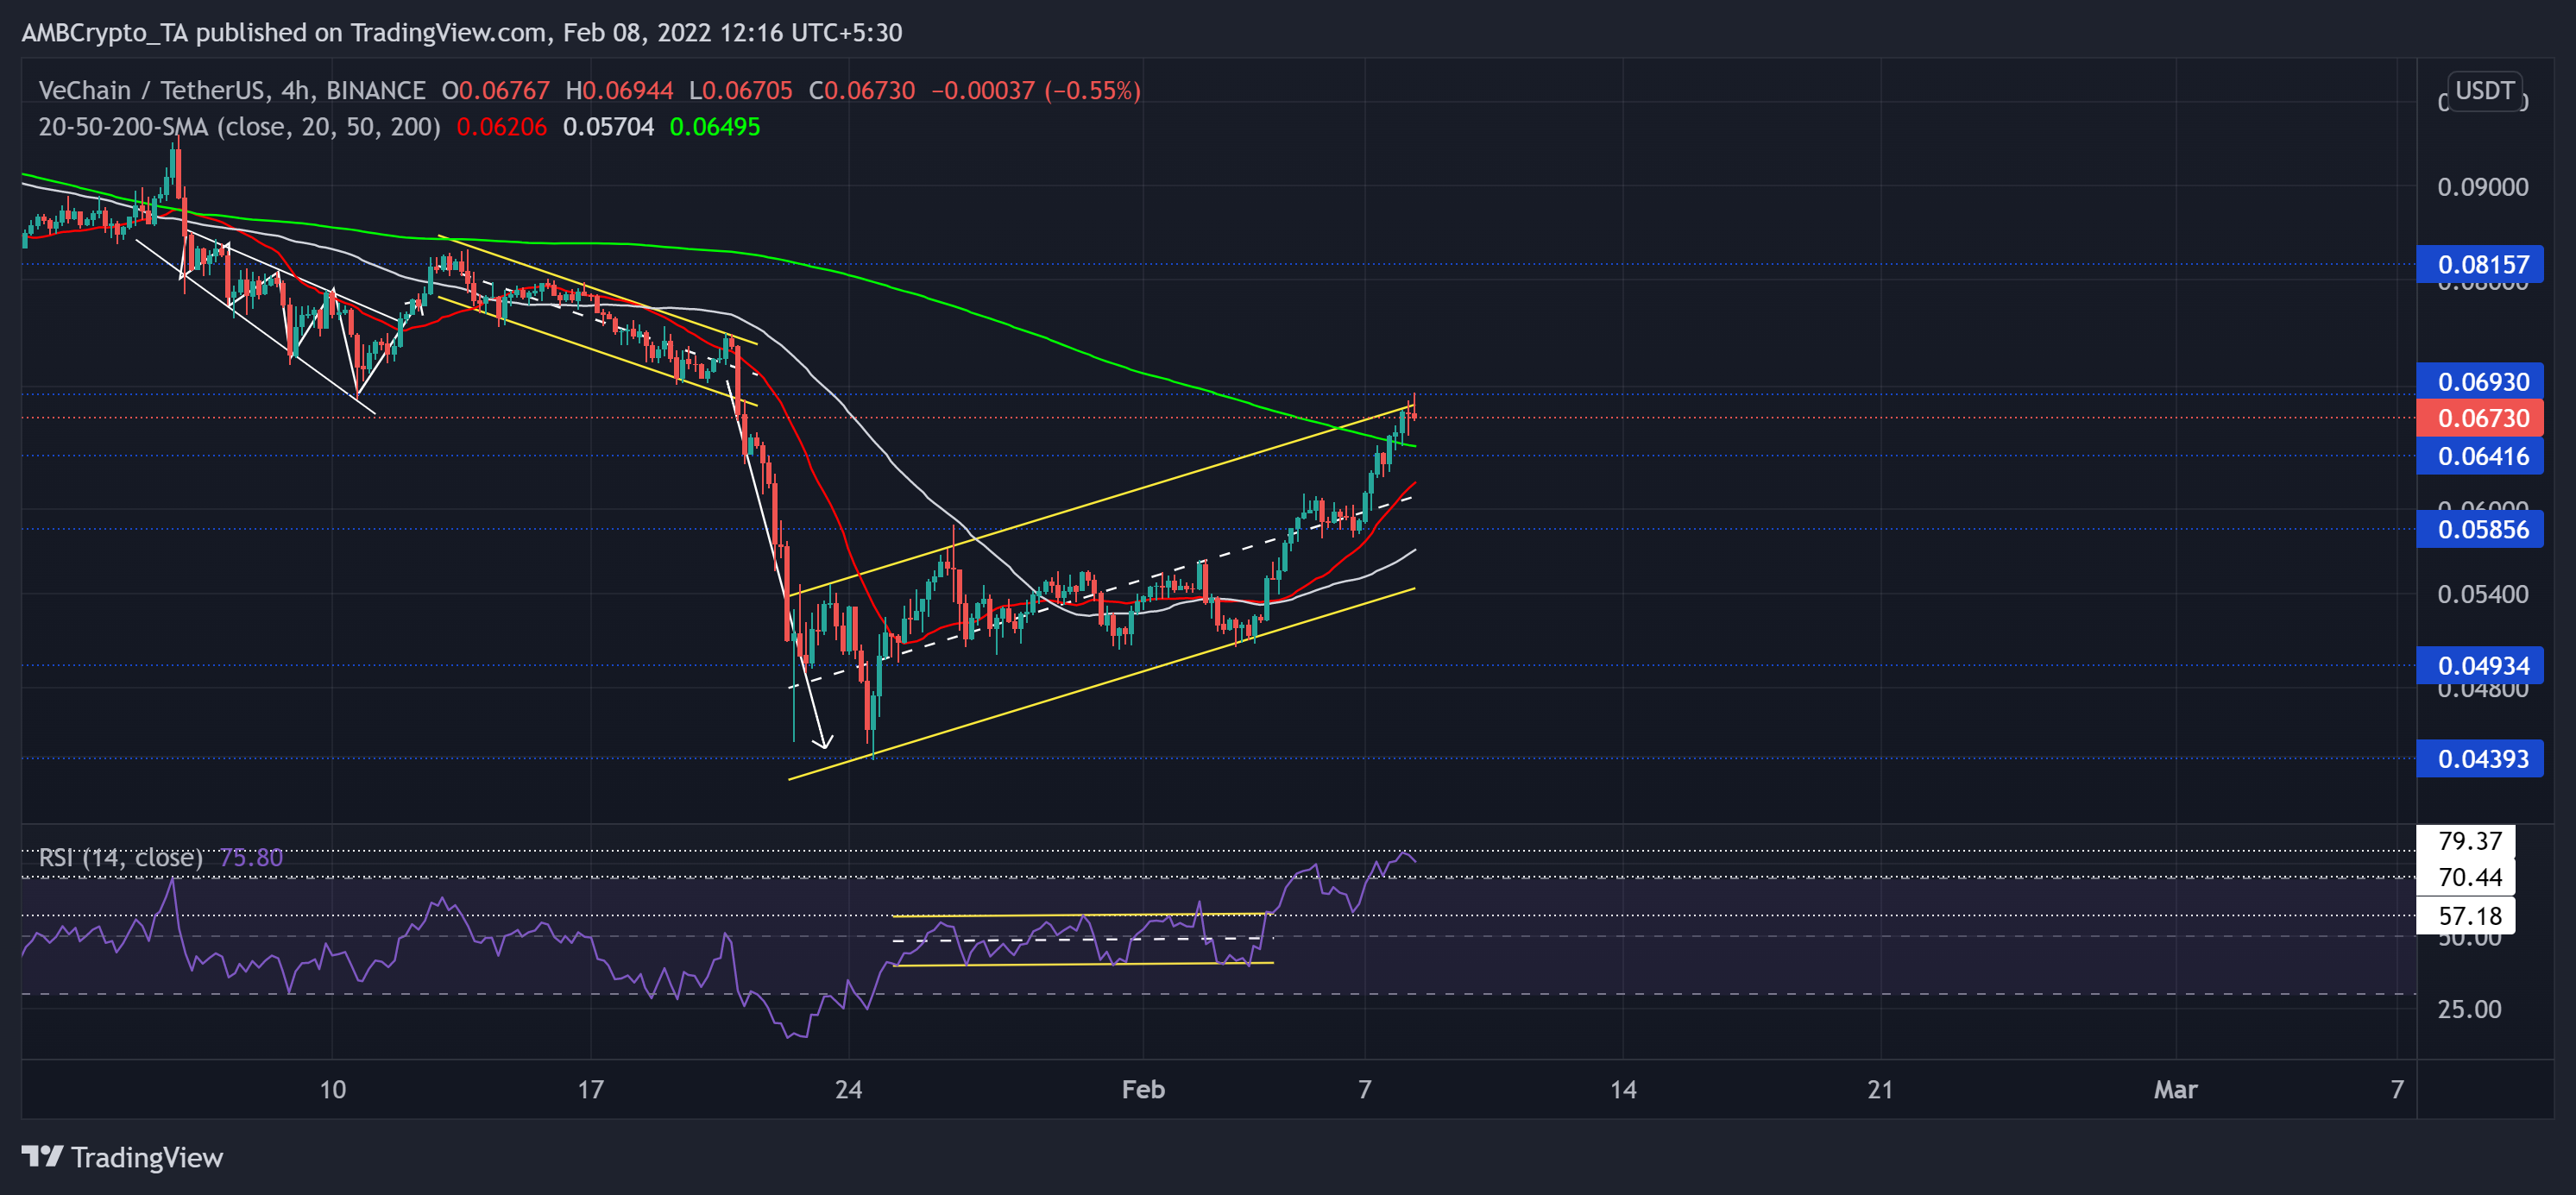
VET lost 54.15% of its value (from 5 January) and fell toward its 11-month low on 24 January. However, the alt saw a 53.77% recovery since then. Over the past few days, VET formed an up-channel (yellow) on its 4-hour chart.
Now, the bulls found it challenging to test the upper trendline of the up-channel (yellow). Further retracements would see a test of the $0.064-mark.
At press time, VET traded above its 20-50-200 SMA at $0.0673. The RSI moved between two horizontal trendlines for ten days. Thus, similar to BNB, VET witnessed a rectangle top breakout. It depicted a bullish bias while touching its six-month high on 8 February. It faced resistance at the 79-mark as it slightly weakened toward the 70-point support.